
Intergenerational differences of spatio-temporal characteristics and influencing factors of home-work location changes since 1978: Empirical analysis based on the micro-survey in Guangzhou, China
Received date: 2017-11-13
Request revised date: 2019-03-11
Online published: 2019-04-23
Supported by
National Natural Science Foundation of China, No.41871148, No.41522104, No.41531178
Natural Science Foundation of Guangdong Province, No.2017A030313228, No.2014A030312010
Copyright
The housing and employment system in urban China has experienced profound transformations in the late 1980s and 1990s. Thus, individual daily behavior and its trajectory in life process have been reshaped and changed. However, previous studies barely focused on the feedback interaction of home-work behavior among different generations, especially beyond Chinese policy transition. Based on the intergenerational difference theory and the perspective of time geography, this paper combines individual jobs-housing course and inter-generational issue to analyze the spatio-temporal characteristics and structural differences of living and working behavior among different generations. These generations were born either before the reform of employment and housing system in 1988 or after in 1998. Through the analysis of the questionnaire, the main results are as follows. (1) Considering the migration of residence, all generations tend to move out from the old city area, and the migration of work places surrounds two city centers, forming a transition process from core area of old city to the suburbs. (2) The average commuting distance increased from 4.91 km to 6.46 km, while the work places and residences of post-1990s' changes much more than those of other age groups, who have suffered higher jobs-housing separation. (3) The commercialization and socialization of housing have greatly increased the freedom of individual residence and job choices after removing residents' house restrictions. In 1998-2016, the rates of post-1960s' and post-1970s' housing change increased to 113.16% and 112.33%, while the rates of their employment place change increased to 148.68% and 197.26%, which are higher compared with before housing reform. (4) The residence time decrease obviously due to the mobility of occupation, with a most obvious change among post-1960s from 14.43 years before 1988 to 5.43 years after 1998. Besides, and the staying in employment place decreased from 12.43 years to 3.95 years. The staying time of post-1980s and post-1990s was much shorter as well after 1988 while that of post-1970s was relatively long. (5) The influences of housing price, marital status, education, welfare house and laid-off status, etc. in capability constraints, coupling constraints and authority constraints are different among different generations on both living and working place migration. However, children's attendance at school and colleagues relationship in combined constraints have no significant different influences between groups on working place migration.
LIN Rongping , ZHOU Suhong , YAN Xiaopei . Intergenerational differences of spatio-temporal characteristics and influencing factors of home-work location changes since 1978: Empirical analysis based on the micro-survey in Guangzhou, China[J]. Acta Geographica Sinica, 2019 , 74(4) : 753 -769 . DOI: 10.11821/dlxb201904010
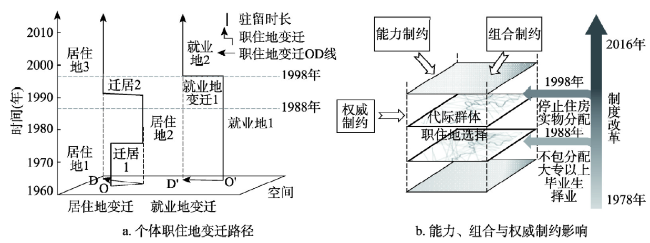
Fig. 1 Transition path of individual house and employment place and constraints图1 个体职住地变迁路径与制约影响 |
Tab. 1 Constraint factors of home-work location change表1 居民职住地变迁制约 |
| 居住地变迁 | 备注 | 就业地变迁 | 备注 | |
|---|---|---|---|---|
| 能力制约 | 家庭总人口 | 人口数 | 学历 | 1:小学;2:初中;3:高中;4:中专/中技/职高;5:大专;6:大学本科;7:研究生以上 |
| 房价/租金便宜 | 1:是;0:否 | 职务 | 1:专业及科研人员;2:教师;3:高级管理人员;4:中级管理人员;5:低级管理人员;6:科员/办事人员;7:技术工人;8:非技术工人及一般体力劳动者;9:服务员;10:个体户;11:散工;12:其他 | |
| 想拥有自己的房子 | 1:是;0:否 | 单位性质 | 1:机关单位;2:事业单位;3:集体单位;4:国有企业;5:私营企业;6:个体;7:其他 | |
| 居住地周边设施完善,生活便利 | 1:是;0:否 | 离住所太远 | 1:是;0:否 | |
| 居住地交通方便 | 1:是;0:否 | 工作前景 | 1:有;0:无 | |
| 居住地比较安全 | 1:是;0:否 | 工资太低 | 1:是;0:否 | |
| 组合制约 | 与家人上班方便 | 1:是;0:否 | 配偶工作调动 | 1:是;0:否 |
| 结婚 | 1:是;0:否 | 子女上学 | 1:是;0:否 | |
| 子女上学 | 1:是;0:否 | 与同事或领导关系不好 | 1:是;0:否 | |
| 权威制约 | 拆迁安置 | 1:是;0:否 | 单位内部调动 | 1:是;0:否 |
| 福利分房 | 1:是;0:否 | 原单位搬迁 | 1:是;0:否 | |
| 下岗 | 1:是;0:否 |
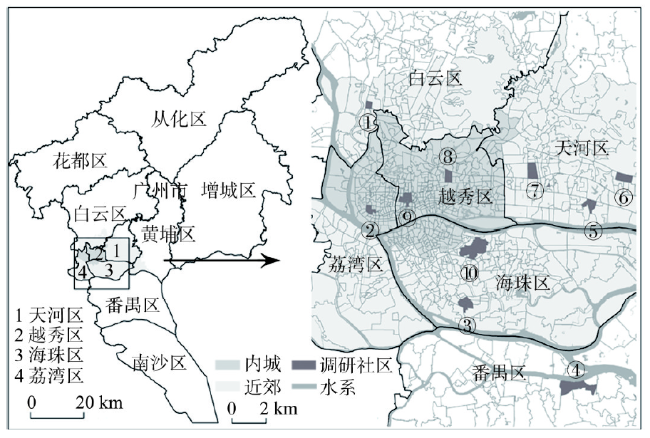
Fig. 2 Research block distribution in Guangzhou图2 广州市调研街区分布 |
Tab. 2 The basic socioeconomic attributes of the interviewees表2 受访者基本社会经济属性 |
| 属性 | 样本数 | 比例(%) | 属性 | 样本数 | 比例(%) | ||
|---|---|---|---|---|---|---|---|
| 性别 | 男 | 414 | 50.36 | 婚姻状况 | 未婚 | 213 | 25.91 |
| 女 | 408 | 49.64 | 已婚 | 608 | 73.97 | ||
| 年龄(岁) | 90后(18~26) | 124 | 15.09 | 离异/丧偶 | 1 | 0.12 | |
| 80后(27~36) | 327 | 39.78 | 个人月收入(元) | 1000~1499 | 2 | 0.24 | |
| 70后(37~46) | 219 | 26.64 | 1500~2999 | 30 | 3.65 | ||
| 60后(47~56) | 152 | 18.49 | 3000~4999 | 291 | 35.40 | ||
| 家庭总人口(人) | 1 | 5 | 0.61 | 5000~6999 | 301 | 36.62 | |
| 2 | 44 | 5.35 | 7000~8999 | 117 | 14.23 | ||
| 3 | 658 | 80.05 | 9000~12000 | 31 | 3.77 | ||
| 4 | 59 | 7.18 | 12000以上 | 50 | 6.08 | ||
| > 4 | 56 | 6.81 | 单位性质 | 机关单位 | 10 | 1.22 | |
| 教育程度 | 小学 | 3 | 0.36 | 事业单位 | 39 | 4.74 | |
| 初中 | 36 | 4.38 | 集体单位 | 104 | 12.65 | ||
| 高中 | 173 | 21.05 | 国有企业 | 91 | 11.07 | ||
| 中专/中技/职高 | 145 | 17.64 | 私营企业 | 498 | 60.58 | ||
| 大专 | 293 | 35.64 | 个体 | 72 | 8.76 | ||
| 大学本科 | 169 | 20.56 | 其他 | 8 | 0.97 | ||
| 研究生 | 3 | 0.36 | |||||
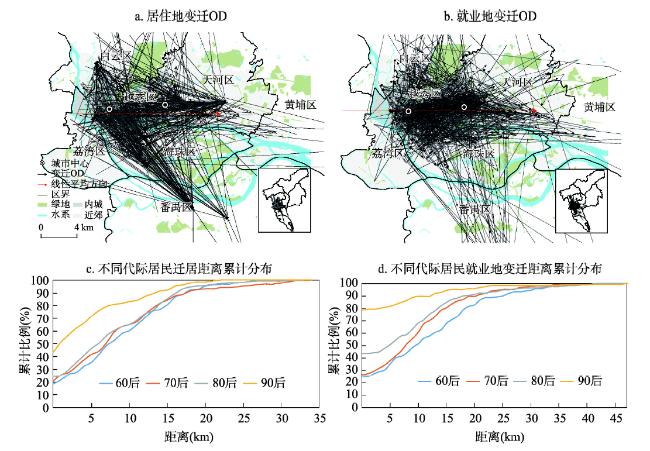
Fig. 3 Origin-destination (OD) line of home-work location and distance distribution in Guangzhou图3 广州主城居民驻留地变迁起讫OD与变迁距离分布 |
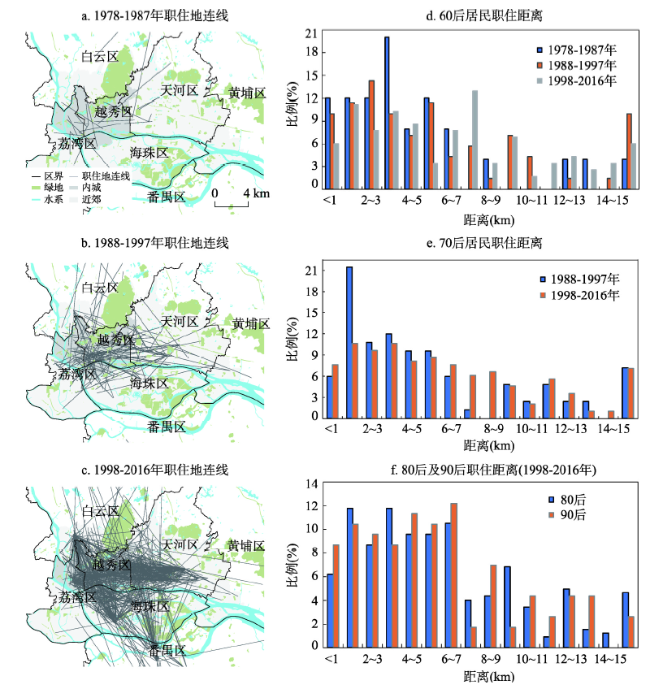
Fig. 4 Linear distance of job-housing before and after the change of housing and employment policy in Guangzhou图4 职住政策变化前后广州主城居民职住距离 |
Tab. 3 Characteristics of different generations' home-work location change of Guangzhou in different periods表3 广州市不同代际居民各时期职住地的变迁特征 |
| 居住地 | 60后 | 70后 | 80后 | 90后 | 就业地 | 60后 | 70后 | 80后 | 90后 | ||
|---|---|---|---|---|---|---|---|---|---|---|---|
| 未变迁(%) | 17.76 | 18.72 | 22.94 | 40.32 | 未变迁(%) | 23.68 | 22.83 | 42.81 | 79.84 | ||
| 1978-1987 | 变迁率(%) | 6.58 (10) | 1978-1987 | 变迁率(%) | 24.34 (37) | ||||||
| 驻留时长(年) | 14.43 | 驻留时长(年) | 12.43 | ||||||||
| 1988-1997 | 变迁率(%) | 38.82(59) | 22.37(49) | 1988-1997 | 变迁率(%) | 58.55 (89) | 48.86 (107) | ||||
| 驻留时长(年) | 9.36 | 9.94 | 驻留时长(年) | 8.12 | 7.70 | ||||||
| 1998-2016 | 变迁率(%) | 113.16(172) | 112.33(246) | 94.50(309) | 69.35(86) | 1998-2016 | 变迁率(%) | 148.68(226) | 197.26(432) | 207.03(677) | 129.03(160) |
| 驻留时长(年) | 5.43 | 6.75 | 3.92 | 1.91 | 驻留时长(年) | 3.95 | 4.54 | 2.30 | 1.31 | ||
注:括号内为对应变迁次数。 |
Tab. 4 Comparison of spatial and temporal characteristics for generational home-work location change in Guangzho表4 广州不同代际群体职住地变迁时空特征模式对比 |
| 60后 | 70后 | 80后 | 90后 | |||
|---|---|---|---|---|---|---|
| 职住地 空间特征 | 居住地变迁 | 分布趋势一致,各代际迁移距离分布相对均匀 | 近距离比例高 | |||
| 就业地变迁 | 相对分散分布,距离分布不均 | 近距离比例高 | ||||
| 职住地距离 | 长距离,分散 | 短距离向长距离转变 | 集中于7 km内 | |||
| 职住地 时间特征 | 变迁率 | 1978-1987年 | 低 | / | / | / |
| 1988-1997年 | 较低 | 较低 | / | / | ||
| 1998-2016年 | 高 | 高 | 高 | 较高 | ||
| 驻留 时长 | 1978-1987年 | 长 | / | / | / | |
| 1988-1997年 | 较长 | 较长 | / | / | ||
| 1998-2016年 | 短 | 短 | 短 | 短 | ||
Tab. 5 Inter-group differences in the factors of generations' home-work location change (Kruskal Wallis test)表5 各代际居民职住地变动因素的组间差异(Kruskal Wallis检验) |
| 居住地变迁 | 卡方 | 就业地变迁 | 卡方 | |
|---|---|---|---|---|
| 能力制约 | 家庭总人口 | 2.342 | 学历 | 88.326*** |
| 房价(租金)便宜 | 8.509** | 职务 | 5.519 | |
| 想拥有自己的房子 | 2.328 | 单位性质 | 0.525 | |
| 居住地周边设施完善,生活便利 | 5.612 | 离住所太远 | 1.595 | |
| 居住地交通方便 | 3.944 | 工作前景 | 1.730 | |
| 居住地比较安全 | 8.925** | 工资太低 | 7.265* | |
| 组合制约 | 与家人上班方便 | 1.904 | 配偶工作调动 | 0.433 |
| 结婚 | 17.843*** | 子女上学 | 1.837 | |
| 子女上学 | 0.000 | 与同事或领导关系不好 | 1.868 | |
| 权威制约 | 拆迁安置 | 1.263 | 单位内部调动 | 13.293*** |
| 福利分房 | 9.421** | 原单位搬迁 | 2.068 | |
| 下岗 | 9.001** |
注:*表示显著性水平P < 0.1,**表示显著性水平P < 0.05,***表示显著性水平P < 0.01。 |
Tab. 6 Multiple comparisons of different significant factors for generations' home-work location change表6 不同代际居民职住地变动差异性因素的多重比较 |
| 居住地 | 全体 | 70后 | 80后 | 90后 | 就业地 | 全体 | 70后 | 80后 | 90后 | ||||
|---|---|---|---|---|---|---|---|---|---|---|---|---|---|
| 能力制约 | 房价/租金便宜 | 60后 | -0.054 | -0.066 | -0.021 | -0.119* | 能力制约 | 学历 | 60后 | -0.532*** | -0.292*** | -0.778*** | -0.359 |
| 70后 | 0.030 | 0.044 | -0.053 | 70后 | -0.189* | -0.486*** | -0.067 | ||||||
| 80后 | -0.037 | -0.097 | 80后 | 0.584*** | 0.419* | ||||||||
| 90后 | 0.088 | 90后 | -0.059 | ||||||||||
| 住地 安全 | 60后 | -0.050 | 0.055 | 0.044 | 0.101** | 工资太低 | 60后 | 0.016 | 0.093 | -0.043 | -0.075 | ||
| 70后 | -0.010 | -0.011 | 0.046 | 70后 | -0.124 | -0.136* | -0.168 | ||||||
| 80后 | 0.006 | 0.057* | 80后 | 0.090 | -0.032 | ||||||||
| 90后 | -0.063 | 90后 | 0.092 | ||||||||||
| 组合制约 | 结婚 | 60后 | 0.058 | -0.082*** | -0.072*** | 0.017 | 权威制约 | 单位内部调动 | 60后 | 0.000 | -0.040 | 0.033 | 0.038 |
| 70后 | 0.047 | 0.010 | 0.099*** | 70后 | 0.062*** | 0.073*** | 0.078*** | ||||||
| 80后 | 0.040 | 0.089*** | 80后 | -0.052* | 0.006 | ||||||||
| 90后 | -0.077* | 90后 | -0.040 | ||||||||||
| 权威制约 | 福利 分房 | 60后 | -0.059 | -0.082** | -0.035 | -0.032 | 下岗 | 60后 | 0.055 | 0.030 | 0.074 | 0.096*** | |
| 70后 | 0.057** | 0.048 | 0.051 | 70后 | 0.020 | 0.044 | 0.066*** | ||||||
| 80后 | -0.010 | 0.003 | 80后 | -0.049 | 0.022 | ||||||||
| 90后 | -0.010 | 90后 | -0.056 | ||||||||||
注:*表示显著性水平P < 0.1,**表示显著性水平P < 0.05,***表示显著性水平P < 0.01;表格中数据为均值差。 |
The authors have declared that no competing interests exist.
| [1] |
[
|
| [2] |
|
| [3] |
|
| [4] |
[
|
| [5] |
[
|
| [6] |
[
|
| [7] |
|
| [8] |
|
| [9] |
|
| [10] |
[
|
| [11] |
|
| [12] |
|
| [13] |
|
| [14] |
|
| [15] |
[
|
| [16] |
|
| [17] |
|
| [18] |
|
| [19] |
|
| [20] |
|
| [21] |
[
|
| [22] |
[
|
| [23] |
|
| [24] |
|
| [25] |
|
| [26] |
|
| [27] |
|
| [28] |
|
| [29] |
[
|
| [30] |
[
|
| [31] |
[
|
| [32] |
[
|
| [33] |
[
|
| [34] |
[
|
| [35] |
[
|
| [36] |
[
|
| [37] |
[
|
| [38] |
[
|
| [39] |
[
|
| [40] |
[
|
| [41] |
|
| [42] |
[
|
| [43] |
[
|
| [44] |
|
| [45] |
|
| [46] |
[
|
| [47] |
|
| [48] |
|
| [49] |
[
|
| [50] |
|
/
| 〈 |
|
〉 |