
Spatial variation and its determinants of migrants' Hukou transfer intention of China's prefecture- and provincial-level cities:Evidence from the 2012 national migrant population dynamic monitoring survey
Received date: 2015-11-16
Request revised date: 2016-05-31
Online published: 2016-11-28
Copyright
Based on data from the 2012 national migrant population dynamic monitoring survey and related statistics, this article examines the spatial pattern and its determinants of migrants' intention of hukou transfer of China's 276 prefecture- and provincial-level cities, using GIS spatial analysis and statistical modelling. The results show that the overall level of migrants' hukou transfer intention of the cities is not high, and varies significantly among different cities. The intention of migrants' hukou transfer increases as the administrative level and/or the size of their destination cities increase. Meanwhile, migrants' hukou transfer intention is generally higher in coastal mega-city regions than in other cities, but it is also relatively high in some provincial capital cities and small and medium-sized cities in some inland regions with good transport location and resource endowment. The spatial pattern of migrants' intention of hukou transfer is shaped jointly by both the characteristics of the destination cities and migrants themselves characteristics, with the former exerting more influence than the latter. High level of socioeconomic development and good location of the destination cities can effectively promote their migrants' intention of hukou transfer; however, their level of basic public services does not have the same effect. The degree of migrants' social integration in the destination cities also exerts positive effects on their hukou transfer intention. However, having medical insurance, the concentration in the secondary labor market and higher household income are negatively related to such intention; furthermore, the individual and family characteristics of migrants do not have a significant impact on it. Finally, on the basis of the above findings, we put forward some suggestions for relevant policy making.
LIN Liyue , ZHU Yu . Spatial variation and its determinants of migrants' Hukou transfer intention of China's prefecture- and provincial-level cities:Evidence from the 2012 national migrant population dynamic monitoring survey[J]. Acta Geographica Sinica, 2016 , 71(10) : 1696 -1709 . DOI: 10.11821/dlxb201610003
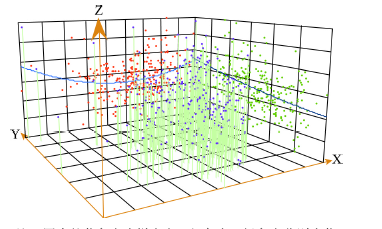
Fig. 1 Trend surface analysis of migrants' hukou transfer intention of China's prefecture- and provincial-level cities图1 中国地级以上城市流动人口户籍迁移意愿趋势面分析 注:图中的紫色点为样本点,红色点、绿色点分别为紫色点在ZX面、YZ面的投影,绿色直线长度表示样本点数据值,蓝色曲线表示东西走向样本的投影趋势,墨绿色曲线表示南北走向样本的投影趋势。 |
Tab. 1 The distribution of China's prefecture- and provincial-level cities by the rank of their migrants' hukou transfer intention表1 中国地级以上城市流动人口户籍迁移意愿的类型划分 |
| 城市类型 | 城市及数量 | 迁移意愿区间(%) | 平均值(%) |
|---|---|---|---|
| I类(极高迁移意愿城市) | 盐城市、临沂市、厦门市、泰安市、大连市、大庆市、七台河市、雅安市、酒泉市、上海市、北京市、克拉玛依市、中卫市、盘锦市14个城市 | 70.01~90.00 | 77.35 |
| II类(高迁移意愿城市) | 常州市、莱芜市、辽阳市、铜仁市、银川市、宜昌市、徐州市、惠州市、贵阳市、巴中市、聊城市、日照市、汕头市、防城港市、石嘴山市、无锡市、池州市、十堰市、朔州市、珠海市、洛阳市、铁岭市、丽江市、哈尔滨市、廊坊市、广州市、乌鲁木齐市、辽源市、河源市、深圳市、眉山市、青岛市、烟台市、威海市、天津市、营口市、濮阳市、伊春市、大同市、武汉市、德州市、南京市、济南市、通辽市、淮北市45个城市 | 50.01~70.00 | 55.97 |
| III类(较高迁移意愿城市) | 邯郸市、苏州市等66个城市 | 41.01~50.00 | 45.35 |
| IV类(中等迁移意愿城市) | 淮南市、临沧市和衡阳市等126个城市 | 20.01~41.00 | 31.29 |
| V类(低迁移意愿城市) | 揭阳市、潮州市、张掖市、汕尾市、安康市、丹东市、来宾市、天水市、信阳市、吉安市、贵港市、陇南市、平顶山市、孝感市、内江市、邢台市、宣城市、抚州市、铜川市、六盘水市、贺州市、莆田市、安庆市、 吕梁市、永州市25个城市 | 0.00~20.00 | 12.40 |
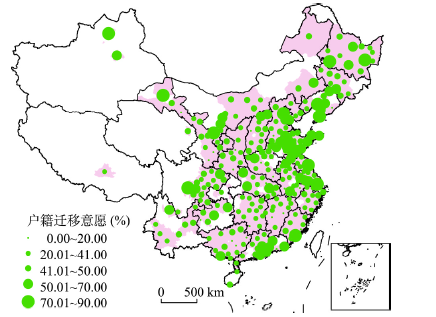
Fig. 2 The spatial pattern of migrants' hukou transfer intention of China's prefecture- and provincial-level cities图2 中国地级以上城市流动人口户籍迁移意愿的空间格局 |
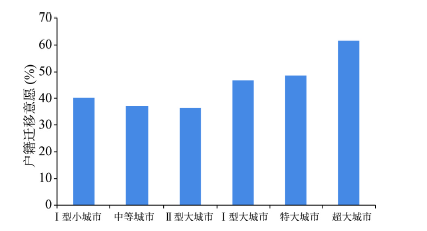
Fig. 3 The migrants' hukou transfer intention of prefecture- and provincial-level cities of different sizes in China图3 中国不同规模城市流动人口的户籍迁移意愿 |
Tab. 2 The theoretical frameworks and relevant variables, mechanisms and their elaboration表2 模型的理论框架及相关变量、机制和归因方式 |
| 理论框架 | 变量 | 机制/逻辑 | 归因方式 |
|---|---|---|---|
| 劳动力市场 分割理论 | 流入地城市的社会、经济发展水平 | 社会、经济发展水平的正向回报机制 | 社会经济水平高,户籍的含金量高,户籍迁移意愿亦高 |
| 流入地城市的劳动力市场特征和社保情况 | 一级劳动力部门与次级劳动力部门的差异 | 集中在次级劳动力市场导致收入水平低,工作缺乏稳定性,户籍迁移意愿低 | |
| 社会融合理论 | 流动人口的社会融合程度、流动时间 | 社会融合的正向回报机制 | 流动时间长、社会融合程度高,对流入地的认同度和归属感高,户籍迁移意愿亦高 |
| 空间区位理论 | 流入地城市的区位特征 | 区位的差异 | 区位条件优越(位于东部和沿海),户籍迁移意愿高 |
| 新劳动力迁移经济学理论 | 流动人口的个体家庭特征、家庭收入与财富水平 | 家庭资源的正向激励机制 | 个人条件优越、在流入城市家庭成员多、家庭收入与财富水平高,生存能力强,户籍迁移意愿高 |
Tab. 3 Principal components analysis of socioeconomic indicators of migrants' destination cities表3 流入城市指标的主成分分析 |
| 经济发展水平(F1) | 社会发展水平(F2) | 公共服务设施水平(F3) | 区位特征(F4) | |
|---|---|---|---|---|
| 公共财政预算收入 | 0.929 | 0.226 | 0.180 | 0.122 |
| 公共财政一般预算内支出 | 0.920 | 0.135 | 0.295 | 0.049 |
| 年末单位从业人员数 | 0.870 | 0.233 | 0.330 | 0.130 |
| 经济总量GDP | 0.811 | 0.387 | 0.326 | 0.205 |
| 社会消费品零售总额 | 0.803 | 0.351 | 0.382 | 0.193 |
| 制造业就业人员 | 0.784 | 0.321 | 0.237 | 0.293 |
| 在岗职工平均工资 | 0.570 | 0.539 | -0.186 | 0.154 |
| 外商直接投资实际使用额 | 0.486 | 0.458 | 0.414 | 0.193 |
| 人均城乡居民储蓄年末余额 | 0.174 | 0.863 | 0.053 | 0.201 |
| 人均图书馆图书册数 | 0.153 | 0.789 | 0.103 | 0.002 |
| 人均GDP | 0.350 | 0.694 | -0.196 | 0.320 |
| 城镇居民可支配收入 | 0.393 | 0.595 | 0.033 | 0.490 |
| 是否为省会、副省级城市 | 0.442 | 0.533 | 0.331 | -0.134 |
| 普通中学在校学生数 | 0.137 | -0.087 | 0.917 | 0.066 |
| 普通中学专任教师数 | 0.461 | -0.006 | 0.844 | 0.114 |
| 医院床位数 | 0.443 | 0.219 | 0.777 | -0.019 |
| 区位(东中西) | -0.025 | 0.114 | 0.142 | 0.866 |
| 是否为沿海城市群内 | 0.179 | 0.177 | 0.056 | 0.833 |
| 是否沿海 | 0.164 | 0.040 | -0.029 | 0.667 |
| 载荷因子累计贡献率 | 31.361 | 50.246 | 66.485 | 79.996 |
Tab. 4 Principal components analysis of migrants' socioeconomic indicators表4 流动人口指标的主成分分析 |
| 就业特征(F5) | 家庭收入与财富水平(F6) | 个体和家庭 基本特征(F7) | 流动时间(F8) | 社会融合 程度(F9) | 社会保险 情况(F10) | |
|---|---|---|---|---|---|---|
| 在私营企业就业比例 | 0.842 | 0.039 | 0.159 | -0.108 | -0.029 | -0.079 |
| 制造业从业人员比重 | 0.830 | 0.242 | 0.013 | 0.039 | -0.145 | 0.056 |
| 雇员比例 | 0.773 | -0.113 | 0.421 | -0.042 | -0.030 | 0.057 |
| 第三产业从业比重 | -0.741 | 0.264 | 0.096 | -0.078 | 0.028 | 0.007 |
| 跨省流入比重 | 0.436 | 0.366 | 0.015 | 0.003 | -0.408 | 0.408 |
| 家庭月收入 | -0.014 | 0.966 | -0.045 | 0.051 | -0.041 | -0.014 |
| 家庭年储蓄金额 | 0.151 | 0.909 | 0.052 | -0.023 | -0.044 | -0.036 |
| 个人月均收入 | -0.195 | 0.833 | -0.028 | -0.105 | 0.015 | 0.143 |
| 平均受教育年限 | -0.268 | 0.046 | 0.735 | -0.320 | 0.134 | -0.028 |
| 白领比例 | 0.216 | 0.156 | 0.719 | 0.240 | 0.040 | -0.024 |
| 本地家庭规模 | -0.262 | 0.100 | -0.716 | 0.272 | 0.097 | -0.252 |
| 已婚比例 | -0.142 | 0.155 | -0.626 | 0.366 | 0.117 | -0.085 |
| 在外流动时间 | 0.049 | 0.046 | -0.115 | 0.842 | -0.047 | 0.014 |
| 本地滞留时间 | -0.063 | -0.148 | -0.178 | 0.825 | 0.051 | 0.045 |
| 社区活动参与度 | -0.038 | -0.018 | -0.038 | -0.247 | 0.788 | 0.250 |
| 社会心理认同度 | -0.111 | -0.021 | 0.027 | 0.260 | 0.739 | -0.210 |
| 享有城镇职工医保比重 | -0.035 | 0.042 | 0.125 | 0.057 | 0.031 | 0.897 |
| 载荷因子累计贡献率 | 17.792 | 34.354 | 47.547 | 58.867 | 67.158 | 74.140 |
注:社会融合是流动人口逐渐融入流入城市、被周围环境同化和个人心理上逐步认同的过程。尽管社会融合已经是一个相对成熟的概念,但目前尚未形成统一的指标体系和测量标准。本文结合问卷从社区活动参与和社会心理认同两个方面来衡量流动人口在流入城市的社会融合状况。社区活动参与度采用题项“今年以来您或您的家人是否在本地参加过以下活动?”(活动包括社区文体活动、社会公益活动(如献血、募捐、做义工等)、计划生育协会活动、社区卫生健康教育活动、选举活动),用参与活动数之和来测度流入地的社区活动参与度;社会心理认同度通过问卷中“我喜欢现在居住的城市”、“我关注现在居住城市的变化”、“我觉得本地人愿意接纳我成为其中的一员”、“我愿意融入本地人当中,成为其中一员”、“我感觉本地人总是看不起外地人”5个题项的同意程度的分值总和来测量,同意程度的赋值分别为“1. 完全不同意,2. 不同意,3. 基本同意,4. 完全同意”。 |
Tab. 5 Multiple linear regressions of the determinants of migrants' hukou transfer intention of China's prefecture- and provincial-level cities表5 中国流动人口户籍迁移意愿空间差异的逐步多元回归模型结果 |
| 非标准化系数 | 标准化系数 | t值 | Sig. | |
|---|---|---|---|---|
| (常量) | 39.248 | 54.599 | 0.000 | |
| 社会融合程度(F9) | 6.277 | 0.405 | 8.475 | 0.000 |
| 社会发展水平(F2) | 5.243 | 0.339 | 6.972 | 0.000 |
| 经济发展水平(F1) | 5.008 | 0.324 | 6.617 | 0.000 |
| 流动时间(F8) | 3.789 | 0.247 | 5.285 | 0.000 |
| 社会保险情况(F10) | -2.173 | -0.139 | -2.919 | 0.004 |
| 城市区位(F4) | 3.558 | 0.229 | 3.966 | 0.000 |
| 就业特征(F5) | -2.885 | -0.188 | -3.346 | 0.001 |
| 家庭收入与财富 水平(F6) | -1.706 | -0.110 | -2.205 | 0.028 |
The authors have declared that no competing interests exist.
| [1] |
|
| [2] |
[
|
| [3] |
[
|
| [4] |
[
|
| [5] |
[
|
| [6] |
[
|
| [7] |
[
|
| [8] |
|
| [9] |
|
| [10] |
|
| [11] |
[
|
| [12] |
[
|
| [13] |
[
|
| [14] |
[
|
| [15] |
. [
|
| [16] |
[
|
| [17] |
[
|
| [18] |
[
|
| [19] |
[
|
| [20] |
[
|
| [21] |
[
|
| [22] |
[
|
| [23] |
[
|
| [24] |
[
|
| [25] |
[
|
| [26] |
[
|
| [27] |
[
|
| [28] |
[
|
| [29] |
|
| [30] |
[
|
| [31] |
[
|
| [32] |
[国家卫生和计划生育委员会流动人口司. 中国流动人口发展报告2013. 北京: 中国人口出版社, 2014.]
|
| [33] |
. [
|
| [34] |
[
|
| [35] |
[
|
| [36] |
[
|
| [37] |
|
/
| 〈 |
|
〉 |