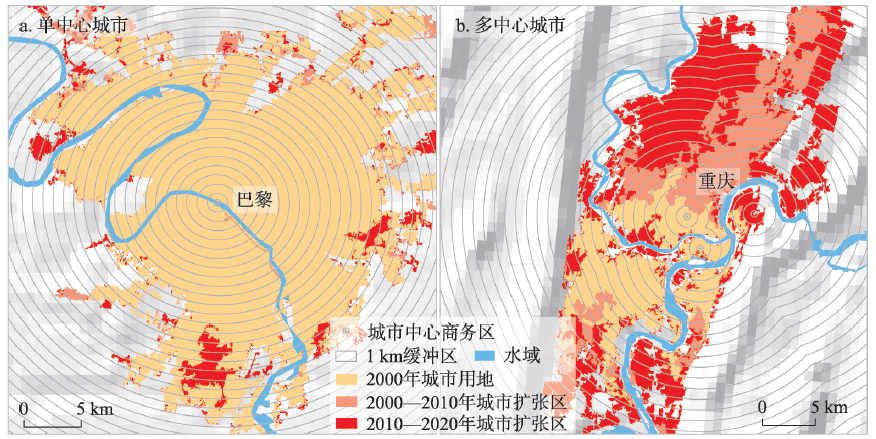
The ultimate form of urbanization is the megacity, which is the typical form of urban structural characteristics and population agglomeration effects. However, the comparative studies on the urban form and expansion patterns of megacities worldwide are still insufficient. This study first analyzed the spatiotemporal changes of land use in megacities based on the Global Urban Land Use/Cover Composites with a 30 m spatial resolution (GULUC-30) by using the method of urban expansion intensity differentiation index (UEDI). Then, the fractal structure and expansion patterns of megacities were investigated using the area-radius model. Finally, urban land use efficiency was assessed through a linear relationship between urban land area and its interna population. The findings include: (1) Southeast Asia and China had experienced the most dramatic urban land expansion (3148.32 km2 and 5996.26 km2) over the last 20 years, along with the average UEDI of both greater than 3. (2) In 2000-2020, morphological characteristics and sprawl patterns of megacities developed toward greater intensification and compactness, with the mean radial dimension increased from 1.54 to 1.56. Meanwhile, radial dimension difference showed a year-by-year decreasing trend, and the intra-city structure showed integration. (3) In 2020, urban land use efficiencies in both North America and Europe were low, with urban land area to its population ratio coefficients ranging from 0.89 to 4.11. On the contrary, high values happened in South Asia and Africa, from 0.23 to 0.87. Spatial patterns and morphological changes in megacities provide important reference values for the intensive utilization of urban land and its sustainable development. Controlling the scale of megacity expansion and promoting the balanced exploitation of urban land are the essential ways for building resilient cities and sustainable urban planning.
Scientifically regulating cultivated land fragmentation (CLF) to make sustainable intensification conducive to and adaptive to the local contexts is the goal of long-term efforts in the research and practice of CLF governance. Starting from the theoretical connotation of CLF and sustainable intensification of cultivated land use (SICLS), this study analyzed the theoretical mechanism of CLF affecting SICLS, and then attempted to construct a sustainable intensification-oriented CLF governance framework from the coupling perspective of "feature-influence-environment", and systematically discussed key issues, scenario decision-making mechanisms, spatial scale effects and operating mechanisms in CLF governance. The results show that: (1) CLF is a composite system covering multi-dimensional attributes such as resources, space, utilization and ownership, which has extensive and complex impacts on resource utilization, agricultural production, and landscape ecology, etc. CLF has become the core factor affecting SICLS through action pathways such as multi-scale and omni-direction, difference and uncertainty, and interaction. (2) The situation and extent to which CLF becomes a problem or a benefit depends on its impacts, the local contexts of physical geography, agroecology, social economy, etc., and the orientation of agricultural development. (3) The CLF comprehensive governance framework from the perspective of "feature-influence-environment" deconstructs five key issues, two relationships, two tendencies and three-level spatial scale interconnection mechanisms in complex CLF scenarios. This framework can provide new ideas for scientifically judging the governance orientation of CLF and optimizing the governance model, which is beneficial to improving the governance system of CLF and promoting the SICLS.

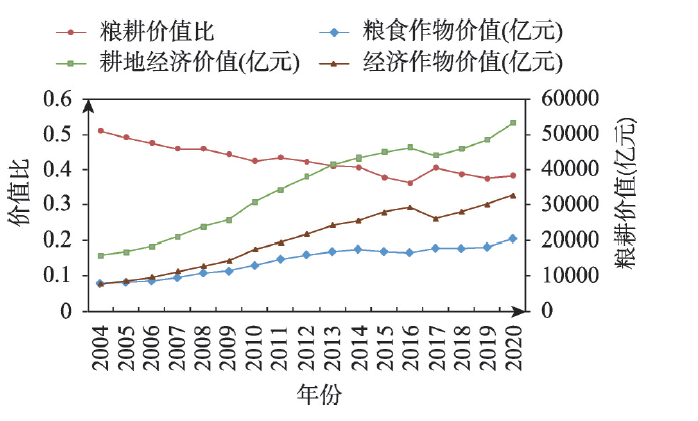
Both the food production value on arable land and the structure of food crop cultivation have impacted on national food security. Therefore, exploring changes in their spatial and temporal coupling patterns can help us to understand their relationships and to further improve food security. In this research, we took provincial-level regions in China as the object, and based on an in-depth interpretation of the connotation of the grain-to-arable value ratio and cropping structure, Simpson's index model, coupling coordination model and spatial auto-correlation are comprehensively used to study the spatial and temporal evolution patterns of grain-to-arable value ratio and cropping structure in the study area from 2004 to 2020, and the spatial and temporal dynamics between them in different regions are revealed in consequence. The results show that: (1) The spatial distribution of the grain-to-arable value ratio in all the provincial-level regions from 2004 to 2020 shows a double-decreasing characteristic, one from north to south and the other from west to east; (2) The spatial pattern of cropping structure shows a Hu-Huanyong-line-ridge in terms of spatial distribution, where Northeast, North and East China witness a significant decrease in crop diversity; (3) The degree of coupling coordination between the grain-to-arable value ratio and cropping structure is found between barely coupled and coordinated and highly coupled and coordinated, showing regular spatial clustering characteristics. In the central, western and northeastern China, there is a high-high concentration with matching advantage; in the southeast coastal region, there is a low-low concentration for matching improvement; and the overall distribution presents a pattern of high in the northeast and central regions, and low in the southeast. The study believes that, based on the heterogeneous characteristics of the spatial concentration and diffusion of factors, the synergistic evolution of food quality and diversity on arable land should be encouraged according to the local conditions, so as to promote the harmonious development of food structure and efficiency.
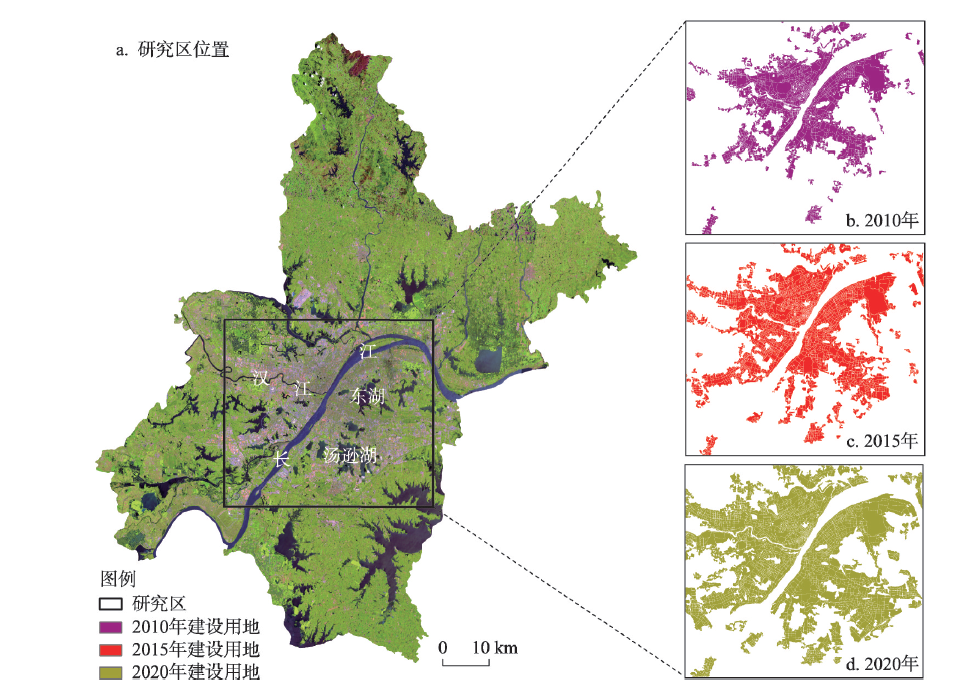
Simulation of urban land use change is the scientific basis for optimizing land resource allocation, and improving its refinement and reliability is helpful to accurately grasp the development trend of urban land use. This is immensely crucial for accurate regulation of urban land resources. The simulation of land use change based on remote sensing classification is macroscopic and simple. However, it is difficult to apply this approach to reveal the change in urban land use social functions, as well as the source and mechanism of spatial scale effect in the refined simulation at block scale. This study identified the refined urban land use characteristics by combining remote sensing images and POI data. Moreover, the optimal spatial scale combination was calibrated for refined land use simulation with the response surface method. Based on the optimal spatial scale combination, the refined simulation of future land use change was performed by using the CA-Markov model. Considering the Wuhan core urban area as an example, the results demonstrate that: (1) POI-based refined urban land use identification method can deeply analyze the social functions of urban construction land, which greatly improves the traditional remote sensing-based macro interpretation of land cover. (2) Optimal spatial scale combination of CA-Markov model for refined land use change simulation in the study area is at the cell size of 30 m and neighborhood size of 7 using the Von Neumann neighborhood type, at which the reliability of refined land use change simulation can be improved. The results of the response surface design can effectively distinguish not only the main sources of the spatial scale effect, but also the magnitude of their influence and the positive or negative effects on the simulation accuracy in the refined simulation process. (3) It is predicted that by 2025 the construction land scope of the study area will continue to expand to the periphery with various types of land interlaced, and the spatial pattern of land use will become more fragmented.
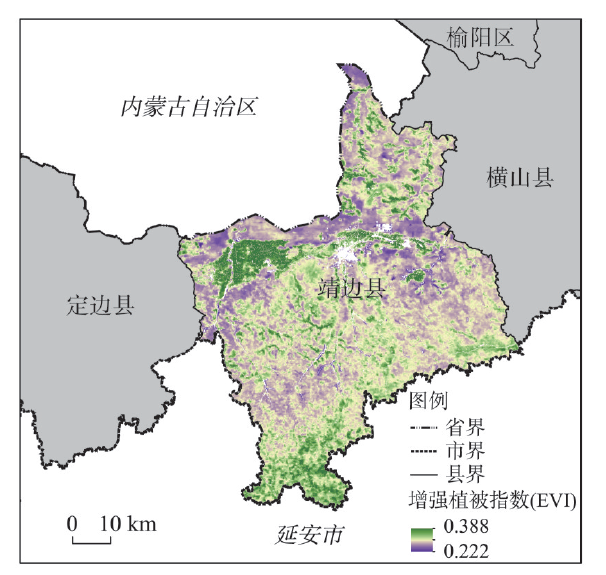
As an important factor affecting vegetation coverage, the terrain is of great importance to vegetation restoration evaluation and ecological restoration planning. The terrain niche index (TNI), a comprehensive index proposed to measure the combined topographic effect, has incomparable advantages over any single terrain factor. However, the whole study area was taken as a unit reference for the TNI calculation in the previous algorithms, which did not consider the spatial heterogeneity of terrain factors. As a result, the old TNI cannot well reflect the local environment of vegetation growth. Inspired by the geographical environment similarity emphasized in the Third Law of Geography, this study integrated the "proximity of spatial location" and the "similarity of environmental characteristics", and modified and improved the traditional TNI model in the following two aspects: (1) local window algorithm was introduced to highlight the local terrain features; and (2) the new TNI was calculated in each habitat unit formed by the combination of different environmental factors to eliminate the interference of environmental heterogeneity on the topographic effect. The case study shows that the improved model can increase the explanatory power of TNI on vegetation coverage, and the correlation coefficient between TNI and vegetation coverage can be maximized when considering the habitat unit and adopting the optimized local window. In addition, among different habitat factor combinations, it can be found that locations with higher temperature values and less precipitation values show a much closer correlation between the new TNI and vegetation coverage, which indicates that the more the water-deficient areas are, the more the sensitive vegetation coverage is to the local terrain conditions. As a result, this study is expected to provide new indicators for vegetation restoration evaluation and planning.
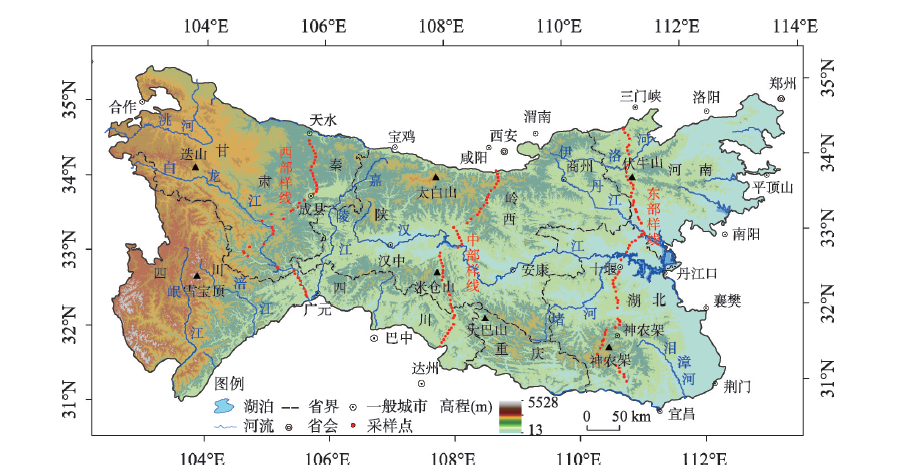
The Qinling-Daba Mountains constitute the bulk of the north-south transition of China. The transitions and patterns of plant species distribution must be determined to understand the spatial variation and complexity of this region and demarcate the boundary between the warm temperate and subtropical zones of China. We analyzed variations in plant species richness, relative importance value (RIV) and typical species abundance in a north-to-south direction based on plant community filed survey data. There were 163 sample sites along three north-south transect lines in the eastern, middle, and western Qinling-Daba Mountains. Furthermore, the differences in RIV between subtropical and temperate species (SND-RIV) revealed the dominance of northern and southern plant species and explained spatial vegetation patterns. The results show that: (1) along the eastern (Sanmenxia-Yichang), middle (Xi'an-Dazhou) and western (Tianshui-Guangyuan) transects, the richness and RIV of subtropical plant species increased while those of temperate plant species decreased from north to south. In the eastern transect, temperate plant species richness and RIV were the highest at Shennongjia and Funiu Mountains, respectively, because of the high elevation there. In the middle transect, subtropical plant species richness and RIV were the highest in Daba Mountain. In the western transect, richness and RIV were higher for subtropical compared with temperate plant species in the south of Longnan. (2) In the eastern, middle, and western transects, the crisscross areas of the northern and southern plant species were ~180 km, ~100 km, and 50-60 km, respectively. (3) The eastern, middle, and western transects differed in terms of their north-south plant species transition patterns and the factors driving them. Decreases in subtropical plant species from south to north were related to the decreases in annual precipitation in the eastern and western transects. In the middle transect, mean annual temperature had a slightly greater influence on plant species distribution than the moisture index.
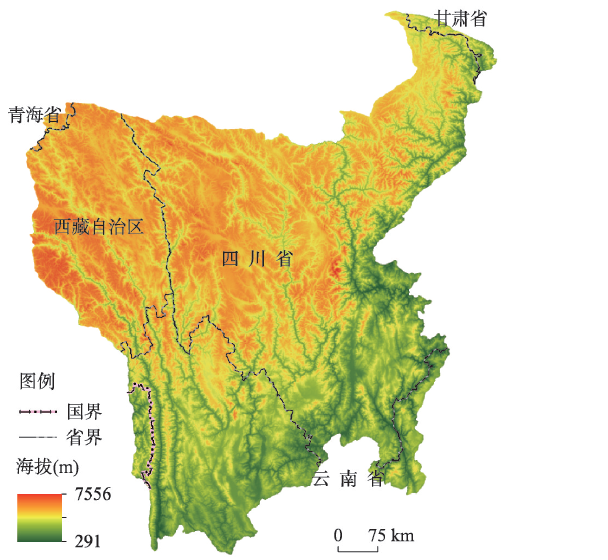
The Hengduan Mountains is one of the most biologically diverse areas in the world, geographically located in the eastern part of the Qinghai-Tibet Plateau and the upstream of several major rivers. These mountains are ecologically conservated, with an extremely important ecological barrier function. Since 1990s, China has implemented several significant ecological restoration and construction projects in the research area. Due to limited data and lack of field investigations, few studies explored the integrity and long-term vegetation changes in this area. Hardly any of them discussed the systematical relationship between vegetation changes and elevation factors of the Hengduan Mountains. In view of filling this research gap, we used the Climate Change Initiative Land Cover (CCI-LC) dataset for the period 1992-2020 and the Normal Difference Vegetation Index (NDVI) dataset from MODIS for the period 2000-2020 to reflect changes in vegetation distribution and activity, respectively. Here, we used transfer matrices to investigate the transition relationships among different vegetation types, and used Theil-Sen Median trend analysis to explore the spatial and temporal trends of vegetation activities. We also used the partial correlation analysis to quantify the influencing factors of vegetation activities. Herein, the relationship between vegetation coverage area and mean elevation change was also investigated. The results showed that: (1) The most widely distributed vegetation in the study area contained evergreen coniferous forests and shrub-grass types. Vegetation changes were distributed in river valleys, and southern low-altitude areas. The grasslands were mainly converted to evergreen coniferous forests to gradually improve the vegetation coverage. This showed that ecological protection policies played an essential role. However, vegetation coverage changes are generally in the initial stage of policy implementation. (2) The overall vegetation activity showed an increasing trend. In unchanged vegetation regions, vegetation activities increased in more than 75% of the area, and more than 20% of the area increased significantly (P < 0.05). The changing trend of forest vegetation was more significant than that of grassland. (3) The environmental factors that significantly impact vegetation activities are climate change and topographic slope. Although vegetation coverage was enhanced by increasing temperatures, the precipitation influenced the vegetation in hot and dry valleys. Nearly 25% of the total research area shows a decreasing. This decreasing trend is due to natural disasters such as landslides and mudslides caused by much precipitation and steep mountain slopes. These findings can provide a reference for the evaluation of ecological protection policies, the comprehensive risk assessment of natural disasters, and the prediction of vegetation changes under the influence of future climate change in the Hengduan Mountains.
The investigation of the dynamic changes of vegetation growth in arid areas is important to the study of the formation, development, and evolution of desertification. By using the Sen+Mann-Kendall method to detect the change of the time series trend, this paper analyzed the spatio-temporal variation characteristics of the vegetation cover in the potential extent of desertification in China (PEDC) from 2000 to 2020, especially in the forest and grass-covered area, based on the data set of annual vegetation coverage obtained by the improved directional dimidiate pixel model. The research results show that: (1) The average vegetation coverage of the PEDC is 0.284, the improved vegetation coverage estimation result well reflects the vegetation coverage, and the estimation accuracy is 86.98%. The vegetation growth situation is getting better, among which the arid area has the most prominent performance, with a significant increase of 48%, while the average increase in the sub-humid arid area is 0.1. (2) The ecological restoration projects of the forest and grass sector are effective, but vegetation restoration is a long and slow process. In terms of forest and grass area, the increase is small (0.002%) from 2000 to 2010 and relatively large (0.371%) from 2010 to 2020. (3) The forest quality of PEDC has improved most obviously among all vegetation types, while the grassland is relatively stable, and the areas of forestland and grassland which have seen significant increase account for 76.4% and 71.8% respectively from 2000 to 2020. Among them, the vegetation coverage of forestland increased by 0.15 in the sub-humid arid region, while that of grassland increased by only 0.06. This study can provide an in-depth understanding of the long-term vegetation growth status in the PEDC, especially in the forest-grass coverage area, and provide important information for the further formulation and implementation of various ecological projects.
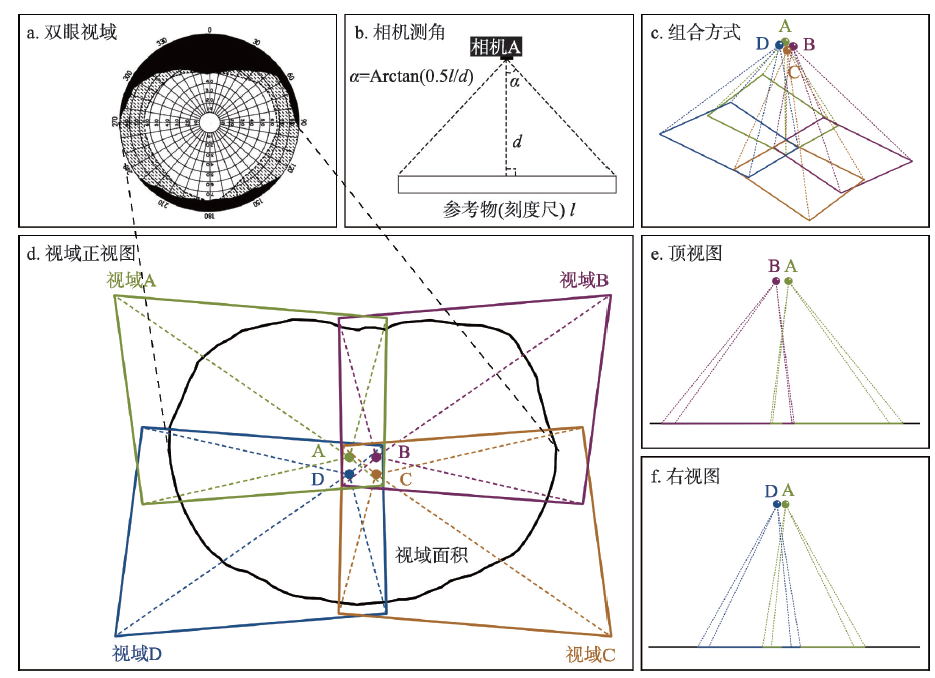
With the visual landscape quality (VLQ) as the evaluation index, scenic roads are among the efforts for the integrative development of tourism and transportation. The current progress in computer vision techniques provides an opportunity for exploring the VLQ. Technique revolution brings about a new methodology to cut across the long-standing dichotomy of subjectivity and objectivity in landscape quality research. Taking the Simao-Xiaomengyang highway in Yunnan as a case study, this paper develops a multi-camera configuration approach to capture and synthesize landscape images fitting with human field of view, and adopts the image recognition technique to acquire the pixel data. Based on these data, we conceptualized the non-scale semantic differential analysis to calculate the landscape qualities from the dimensions of "naturalness—artificiality", "diversity—coherence", and "openness—deepness". The results show that the VLQ in the road in the case study is distinctive, which is highly natural, relatively coherent and open. The VLQ is different in various driving directions, but the differences diminish with the expansion of observation distance. Based on the empirical results, we propose to set up branch byways to consolidate the image of the scenic road, as well as increase differentiated construction measures between directions of the road. The case study results are intuitive and accurate in the aspect of the scenic road VLQ evaluation, which indicates that our methodology is advantageous in integrating subjectivity and objectivity. This method would help the road administrators to formulate policies in planning, construction and management, hereby promoting the high-quality development of scenic roads in China.
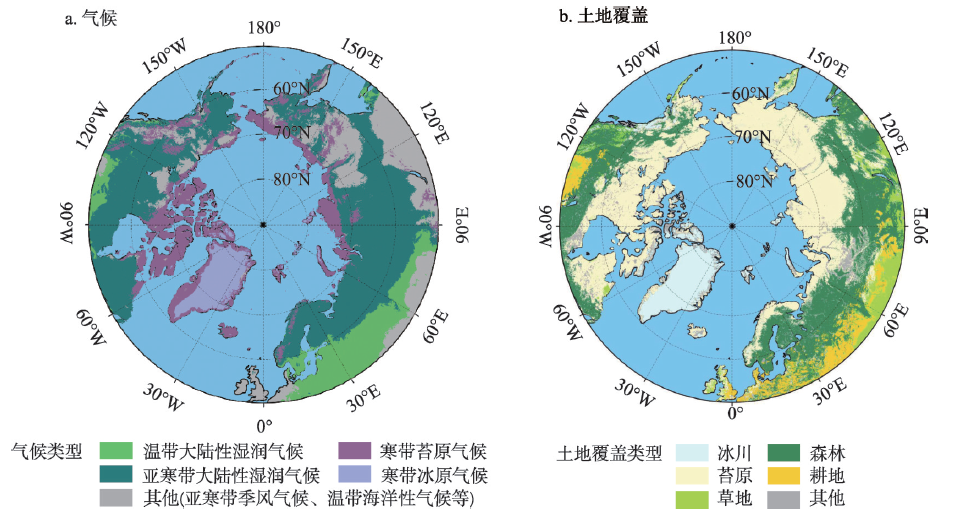
The Arctic is undergoing unprecedented climatic and terrestrial environmental changes. The Arctic primary industry has experienced a wide and significant effect from these shifting environmental factors, such as rising temperatures, greening vegetation, thawing permafrost, and frequent wildfires. It is essential to integrate the knowledge of impacts caused by climatic and terrestrial environmental changes on Arctic primary production in order to support the sustainable development of primary industry and inform the formulation of industrial policies. The four main sectors of primary industry (cultivation, livestock husbandry, forestry, fishery and aquaculture) were discussed in this work. This study synthesized the types and extent of the impacts caused by climatic and terrestrial environmental changes on each sector, and provided a summary and outlook from five aspects with a cross-sector perspective: (1) the specific ways of climate changes affecting primary production; (2) the challenges of integrating knowledge from local researches; (3) the enactment and implementation of adaptation strategies; (4) the demand for integration and innovation in data and methods; and (5) the inspiration of the climate change-induced alteration in Arctic primary industry for China. This study concluded the priorities of researching the impact of climate changes on Arctic primary industry, and the results would be capable to aid China's participation in the sustainable development of Arctic primary producing activities.
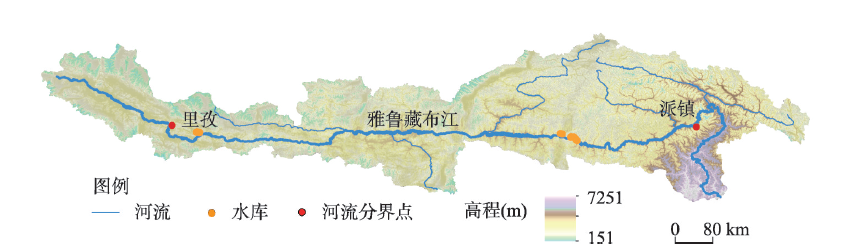
River width, as one of the basic parameters of river morphology, is very important to understand the hydrological process and ecosystem function on Earth. The Yarlung Zangbo River is not only a global plateau river with typical regional characteristics, but also an important international river. However, due to its remote location, mountainous terrains, and harsh environmental conditions, the gauge stations are sparsely distributed in the Yarlung Zangbo River, which greatly impedes a better understanding of its hydrological dynamic characteristics. Satellite remote sensing makes it possible to monitor and analyze the wide and long-term dynamic changes and to examine the hydrological characteristics of the Yarlung Zangbo River by providing multi-temporal image data. Based on the Global Land Analysis and Discovery (GLAD) dataset and the threshold segmentation method of water boundary inundation frequency, this study reconstructed the complete monthly water area of the study area, and then estimated the spatial and temporal distribution of the river width from 2000 to 2020. The results indicate that due to the seasonal differences in temperature and precipitation, the width of the river showed a significant seasonal variation from 2000 to 2020. The seasonal variation in the middle reaches was the largest (453.6 m), while that of the downstream was the smallest (90.3 m). Influenced by climate and topography, the spatial distribution of river width in the whole course of the Yarlung Zangbo River varies greatly. The narrowest part of the observed river channel is about 30 m, i.e., a spatial resolution of Landsat images. The maximum river width in the middle and lower reaches of braided rivers can reach 5935.7 m. About 50% of the river segments of the Yarlung Zangbo River are narrower than 150 m, and only 2.0% of the river segments are wider than 2000 m. From 2000 to 2020, the average river width of the main stream first decreased, then increased and finally decreased. There was a very significant positive correlation between the mean river width of the mainstream and precipitation and air temperature, and the correlation coefficient R was 0.7, which passed the confidence test of 0.01. In addition, the monthly river width based on GLAD was also evaluated by the river width results derived from 10 m resolution Sentinel-2 data. The results showed that both of the relative deviations were less than 2%, indicating that the estimation results were relatively reliable in general.
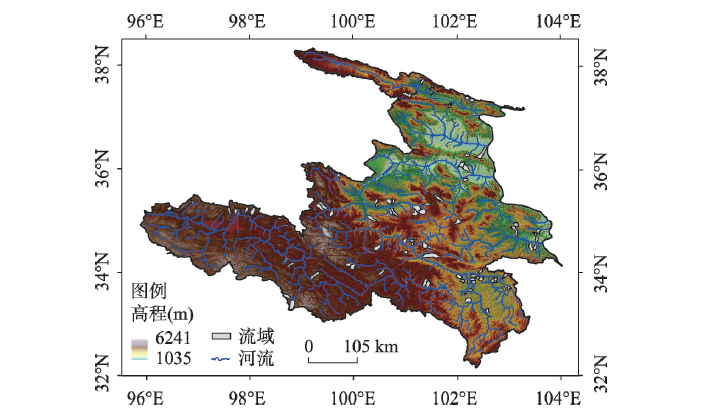
The landform of the Yellow River source zone is diverse, leading to various drainage patterns. To understand the drivers of planform geometry of river networks in the Yellow River source zone, 83 representative sub-basins, including dendritic, pinnate, rectangular and symmetric pinnate patterns are selected for studies. Attributes to characterize the planform geometry of river networks are calculated. The relationships between river network attributes and environmental factors are examined. The results show that the differences in the characteristics of the 4 drainage patterns are well reflected by the aspect ratio, drainage density and the maximum frequency of flow directions. Changes in drainage density and the maximum frequency of flow directions are well expressed by slope and precipitation variation. Aspect ratio is significantly influenced by precipitation. The pinnate networks are mainly distributed at the northern edge of the upper plateau where the climate is arid and the surface is bare. The mean basin slope of this pattern is 4.5o, and the mean relief is 730 m. The rectangular networks are concentrated in the Zoige basin where the mean basin slope and relief are 2.3o and 177 m, respectively. The climate of the Zoige basin is relatively humid and there are plenty of swamps and wetlands. The symmetric pinnate networks are more likely to occur in the high-relief valleys where the precipitation varies greatly. The average slope and relief of the symmetric pinnate networks are 16.9o and 1167 m, respectively. The dendritic networks are distributed mainly in mountainous areas of the middle reaches and fluvial plains in the northeast part of the source zone. The average slope and relief of the dendritic networks are 15.4o and 968 m, respectively. The vegetation coverage is better than that of the upper plateau. Our analysis suggests that topography is the main factor that leads to the differences of planform geometry among various drainage patterns. Climate and vegetation coverage play an important role in the development of river networks when the constraints of topography are reduced.
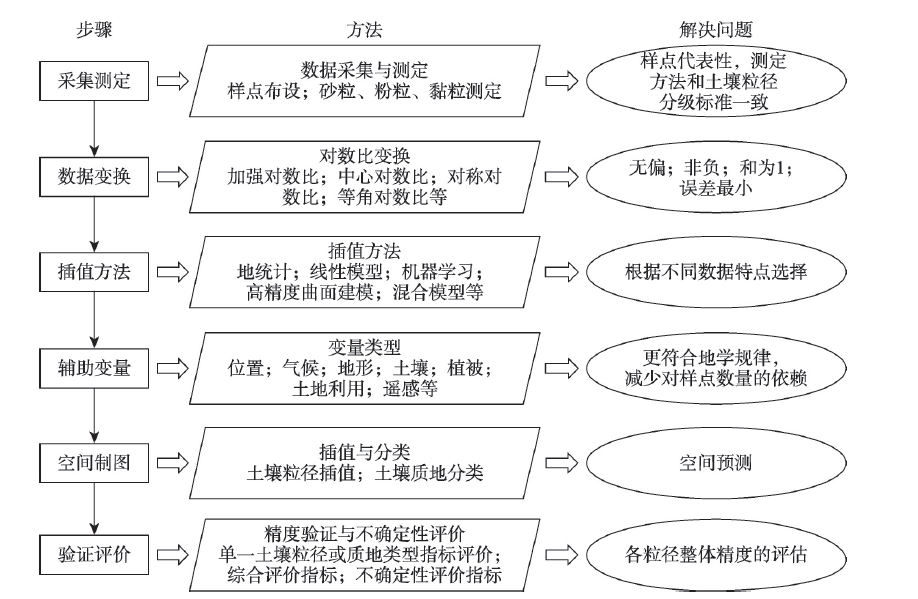
Soil particle-size fractions (PSFs), including sand, silt, and clay, are key parameters for land-surface process simulation and ecosystem service evaluation. More accurate interpolation of soil PSFs can help better understand the simulation of the above models. As compositional data, soil PSFs have special demands of the constant sum (1 or 100%) in the interpolation process, and the spatial distribution accuracy is mostly affected by the performance of spatial prediction methods. Here, we provided a framework for the spatial prediction of soil PSFs, and reviewed a series of methods in the steps of this framework, including methods of log-ratio transformation of soil PSFs (additive log-ratio, centered log-ratio, symmetry log-ratio, and isometric log-ratio methods), spatial interpolators of soil PSFs (geostatistical methods, regression models, and machine learning models), validation methods (probability sampling, data splitting, and cross-validation) and indices for accuracy assessments in soil PSF interpolation and soil texture classification (rank correlation coefficient, mean error, root mean square error, mean absolute error, coefficient of determination, Aitchison distance, standardized residual sum of squares, overall accuracy, Kappa coefficient, and precision-recall curve) and uncertainty analysis (prediction interval, confidence interval, standard deviation, and confusion index). In addition, we summarized several ways to improve the prediction accuracy of soil PSF, such as normalizing the data distributions through effective data transformation, choosing suitable prediction methods based on the data distribution characteristics, improving mapping accuracy and distribution reasonability through the combination of auxiliary data, improving interpolation accuracy through hybrid models or joint modeling for multi-components. Finally, we proposed the future research fields of the spatial prediction methods of soil PSFs, including considering the principles and mechanisms of data transformation, developing joint simulation models and high accuracy surface modeling methods for multi-components, and combining soil particle size curves with stochastic simulations. Our review highlights the importance of spatial prediction methods for soil PSFs, and also provides a clear framework for improving the performance of these methods for other researchers in this field.
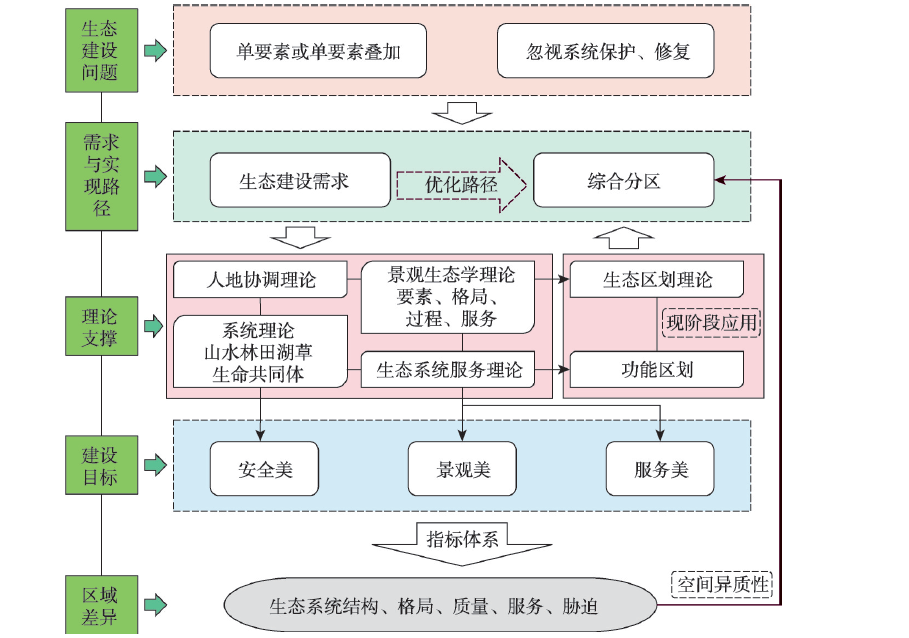
Guided by the conviction that "mountains-rivers-forests-farmlands-lakes-grasslands is a life community", we should optimize the ecological construction of the "Beautiful China" vision. This is a key scientific issue, and as well as an essential resolution to meet the huge demands of the national ecological civilization. Furthermore, it is important to realize the vision of "Beautiful China" via the establishment of ecological regionalization. However, ecological regionalization studies have not considered systematic ecological construction or the spatial heterogeneity of ecosystems, which are affected by changes in global climate and human activities. In this study, a holistic "beautiful landscape, beautiful ecosystem services, and beautiful ecological security" theoretical framework of ecological construction regionalization was constructed, taking into account the spatial heterogeneity of ecosystem structure, pattern, quality, services, and pressure; then, we built three grades of ecological construction regionalization indicators, an integrated ecological construction index, and an integrated ecological degradation index for ecosystem status and assessed the ecosystem degradation. Then, spatial cluster analysis based on the national third watershed was performed and the whole country was divided into five first-grade and 22 second-grade ecological construction regions, respectively. Then, we chose one typical region and established the third-grade ecological construction region. These ecological regionalization-associated results can serve as important application supports for the ecological construction of "Beautiful China". Future ecological regionalization should emphasize the correlation between the indicators and the diversity of ecosystem functions and consider coupling the interference from changes in global climate and human activities.
Accurately identifying the dominant factor of karst ecosystem services is a prerequisite for the rocky desertification control. However, the explanatory power of environmental factors for the spatial distribution of ecosystem services is affected by scaling, and the quantitative research on the scale effect still needs to be further strengthened. This study used Geodetector to access the explanatory power of environmental factors on soil erosion and water yield at different spatial resolutions, and then explored their differences in three geomorphological types. Results showed that slope and vegetation coverage were the dominant factors of soil erosion, and the interactive explanatory power between the two factors was stronger. Affected by the universality of topographic relief and landscape fragmentation in the study area, the explanatory of slope and land use type on soil erosion was optimal at a low resolution. Precipitation, elevation, and land use type were the dominant factors for the spatial heterogeneity of water yield, and the interaction between precipitation and land use type could explain more than 95% of water yield. The spatial variability of elevation in different geomorphological types affected its optimal explanatory power, especially in the terrace and hill type areas. The spatial variability of elevation was weak, and its explanatory power was optimal at a high resolution. However, in the mountainous areas, the spatial variability of elevation was strong, and its explanatory power was optimal at a low resolution. This study quantitatively identified the optimal explanatory power of ecosystem service variables through multi-scale analysis, which aimed to provide a way and basis for accurate identification of the dominant factors of karst mountain ecosystem services and zoning optimization.