We propose a theoretical framework for assessing the ecological benefits provided by national key ecological projects in China over the past 20 years. A dataset consisting of six primary indicators and nine secondary indicators of ecosystem structure, ecosystem quality, and ecosystem services for the period 2000-2019 was generated using ground survey and remote sensing data. Ecological benefits were quantitatively evaluated following the implementation of national key ecological projects in China. Areas with medium, relatively high, and high degrees of ecological restoration accounted for 24.1%, 11.9%, and 1.7% of the national land area, respectively. Degrees of ecological restoration were higher in areas with a greater number of ecological projects. Areas with relatively high and high degrees of ecological restoration were mainly concentrated in the Loess Plateau, the farming-pastoral zone of northern China, the Northeast China Plain, and an area spanning the border areas of Sichuan, Yunnan, Guizhou, Chongqing, and Hunan. The relative contributions of climatic factors and ecological projects to changes in vegetation net primary productivity were 85.4% and 14.6%, respectively, and the relative contributions of climatic factors and ecological projects to changes in water erosion modulus were 69.5% and 30.5%, respectively. The restoration potential of national vegetation coverage was 20%, and the restoration potential percentages of forest and grassland vegetation coverage were 6.4% and 23%, respectively. Climatic conditions can inhibit ecological restoration. Areas with relatively high and high degrees of ecological restoration were mainly distributed in areas with an annual average temperature greater than 0 ℃ and annual precipitation greater than 300 mm. Therefore, the limitations associated with climate conditions should be considered during the implementation of national ecological projects. The implementation of single ecological projects or single ecological restoration measures should be avoided, the use of combined measures should be emphasized, and the benefits of ecological investment funds should be maximized.
Water shortage, unmatched combination of resources and unbalanced regional development are acute problems in northwest China. This region has a strategic location in promoting coordinated regional development, communicating international and domestic markets, adjusting economic structure and building ecological barriers. Therefore, the construction of eco-economic pivotal zones in northwest China would contribute to relieving the eco-environmental dilemma and improving the level of regional ecological security, which has a positive influence on the national economic development. Based on the analysis of human-environment interaction, urban agglomeration and development system, population distribution and ethnic composition in northwest China under the "Three Water Lines" pattern, this study firstly interprets the basic connotation of the eco-economic pivotal zones in this region. We propose that the eco-economic pivotal zone is a strategic area for national and global man-land coordination, which could be defined from the perspectives of ecological function zone, economic hub zone, cultural integration zone and deep-land passage zone. Based on the needs of national macro-strategic layout and land-sea coordination, we clarify the multi-functional orientations of eco-economic pivotal zones. Furthermore, this paper constructs a comprehensive development pattern in northwest China under "Three Water Lines" strategy, which is composed of 9 urban growth poles, 71 city nodes, 4 development axes and 4 eco-economic pivotal zones. And the construction layout as well as the development paths of Hexi, Lanzhou-Xining, north slope of Tianshan Mountains and circum-Tarim Basin eco-economic pivotal zones are also proposed. Finally, this paper discusses the interactive mode between the eco-economic pivotal zones and China's national development strategy layout, which would help the formation of a new pattern of development in western China, and provide a scientific basis for a better understanding of the Belt and Road Initiative.
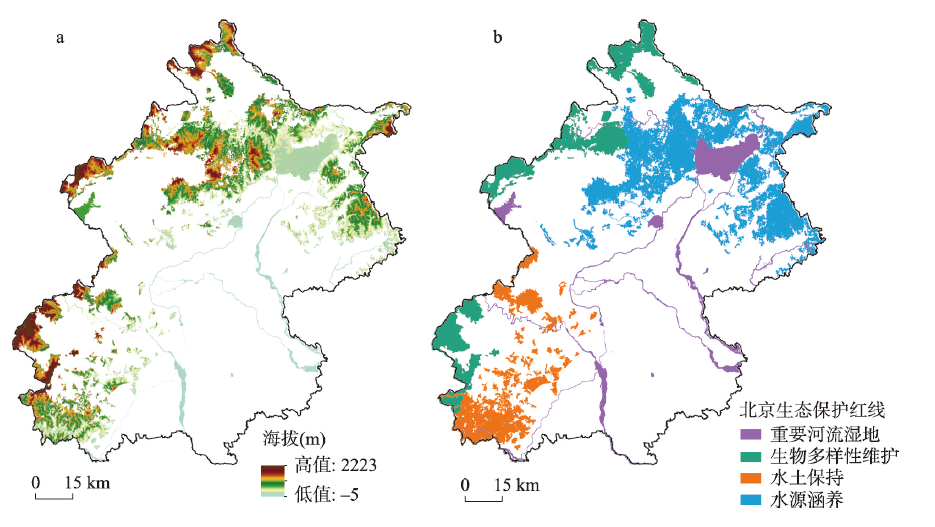
Spatial and temporal variations in ecosystem services (ESs) are driven by two dimensions, environmental factors and trade-off/synergy between services. In the ecological conservation red line area that can guarantee regional and national ecological security and sustainable economic and social development, it is particularly important to clarify the driving mechanism of ESs for the management and optimization of ecosystem. Taking Beijing's ecological conservation red line area as an example, this study considers soil conservation, water yield and vegetation carbon sequestration, and uses Geodetector to identify the influencing factors of the relationship between the three ESs. Then, based on the partial correlation method, the impact of the net relationship between services and environmental variables on ESs is quantitatively separated and compared. Results show that trade-offs and environmental variables have varying degrees of influence on the spatial heterogeneity of ESs, and their interactions can enhance the decisive power of the corresponding individual variable. The differences in the formation process of various services make the factors that affect the relationship between services different, but the land use intensity is the most important factor for the spatial relationship between the three services, indicating that the rational planning of land use is crucial to the coordinated optimization of ESs in the Beijing's ecological conservation red line area. After removing the extremely important factors, the net relationship between services and the impact of environmental variables on ESs were compared. It is found that environmental variables (slope and precipitation) had stronger driving force on the spatio-temporal change of soil conservation. Precipitation and vegetation carbon sequestration have similar effects on water yield. Spatial and temporal changes in vegetation carbon sequestration, with relatively small effects from environmental variables, were closely related to the other two services.
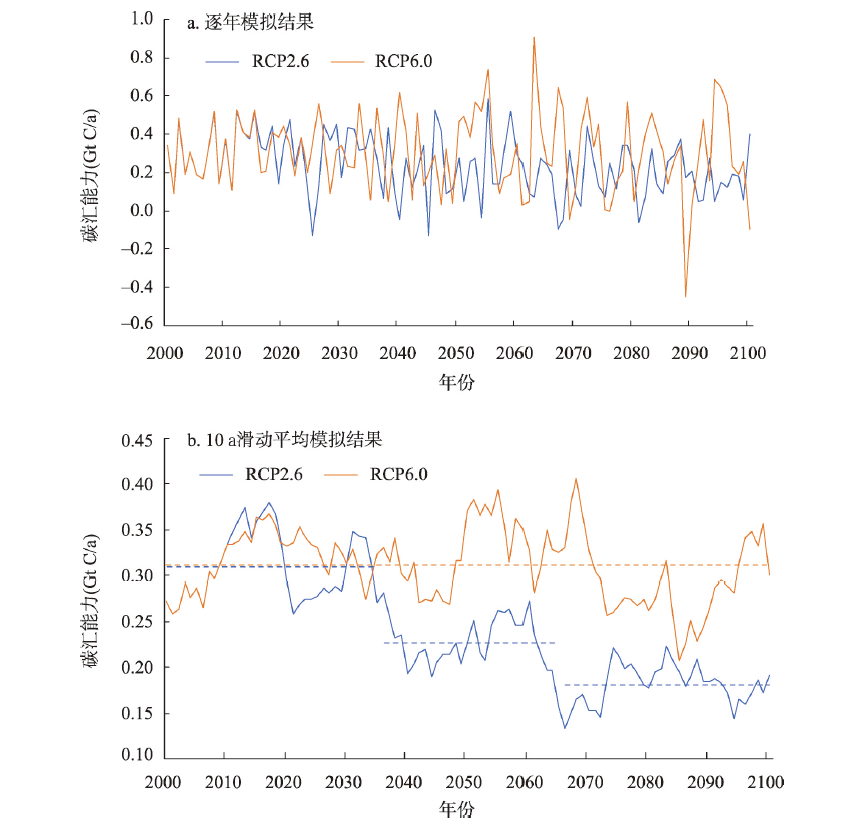
Scientifically predicting and analyzing China's carbon neutrality pathways under different scenarios is helpful for the reasonable advancement of carbon neutrality goals, but there has been limited comprehensive analysis that combines carbon emission-sink change trend and a systematic analysis that uses international scenarios for climate change research. Our research simulates China's carbon emission-sink paths in the 21st century under the shared social economic paths, with the usage of WITCH integrated assessment model and IBIS vegetation dynamic model. We also predict and analyze the timetable and paths of China's carbon neutralization. We find that: (1) China's carbon aggregates show that there is a 3-4 year cyclical fluctuation. Under the RCP6.0 climate scenario, China's average carbon sinks are stable at about 0.30 Gt C/a. Under the RCP2.6 climate scenario, the amount shows a downward trend, and it is predicted to drop to about 0.18 Gt C/a in 2065-2100. (2) China's carbon emissions are jointly affected by world's economic and social development path and policy intensity. Under medium or high intensity emission reduction policies, China's carbon emissions will show a downward trend after reaching the peak in 2025-2030, and under SSP1 or SSP4 with high intensity carbon emission reduction policy, carbon emissions will be reduced to about 0.30 Gt C/a in 2060 and achieve the goal of carbon neutrality. (3) The research of pathways based on typical carbon neutral scenarios finds that, it is required to actively promote the progress and application of clean energy technology, the transformation of non-electric energy to electric energy, the popularity of biomass energy and CCS technology, and advocate the development of electric vehicles in order to realize carbon neutrality goals.
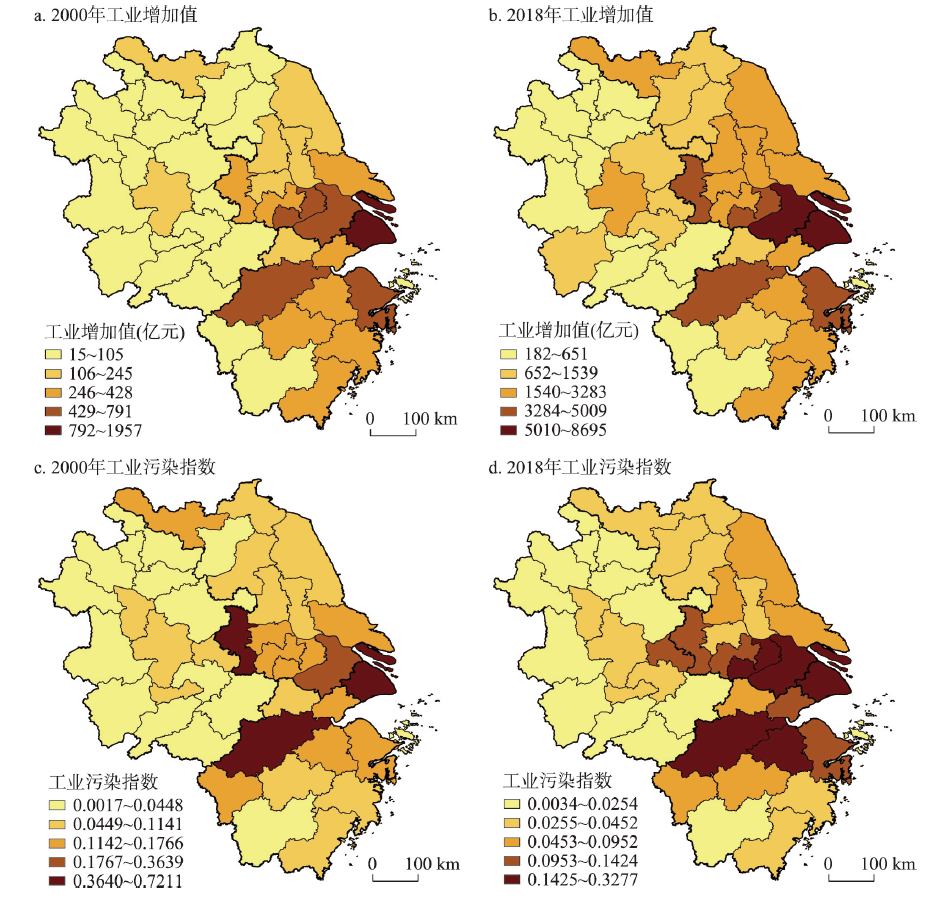
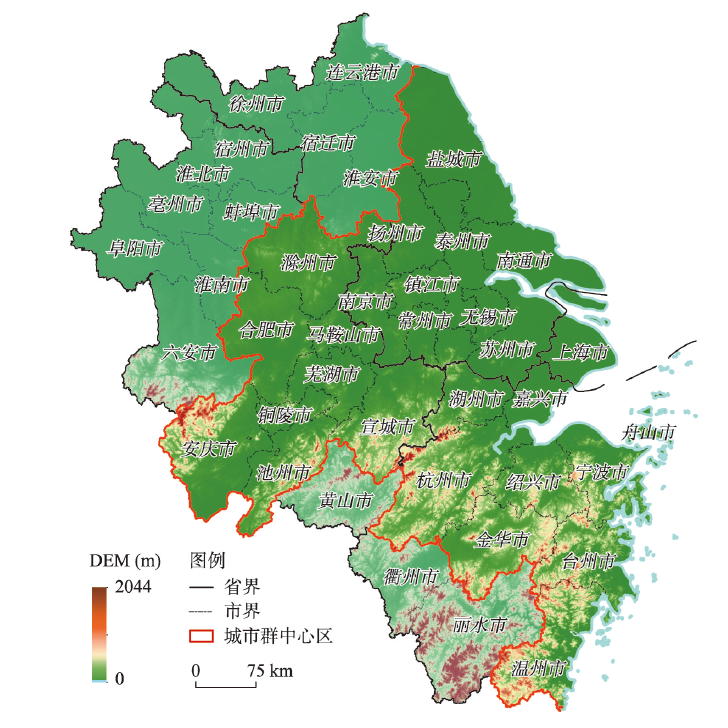
Clarifying the link between economic growth and environmental pollution is an essential issue to achieve regional high-quality development and establish "dual circulation" development patterns. Using the size of industrial economies and industrial pollution index in the Yangtze River Delta (YRD) region during 2000-2018 as the research object, this study constructs allometric growth models based on the size of industrial economies and industrial pollution index to reveal their spatio-temporal changes. We also investigate the influence mechanism of allometric growth using a boosted regression tree model. The results showed that: (1) The spatial pattern of the size of industrial economies and industrial pollution index in the study region has strong stability and high similarity, demonstrating a decreasing trend from east to west. Moreover, the industrial pollution index shows a decreasing trend with the increase in the size of industrial economies. (2) In terms of the vertical direction, the allometric growth in the YRD changes along with the pattern of the economic environment coordinated basically-the weak economic expansion-the economic environment coordinated basically. For the horizontal direction, the rate of industrial pollution index is lower than the size growth rate of the industrial economy and shows a downward trend in most of the cities. (3) Urban ecological foundation, energy efficiency, industrial development level, technological development level, opening-up level and financial investment level are the main factors affecting allometric growth, and these factors have positive impacts on allometric growth in the early stage, while turn into negative impacts during the later stage. (4) The misaligned relationship between market-driven economic growth and government-driven environmental protection induces the allometric growth of the economy and environment, and promotes regional integration. Regional integration and the allometric growth of the economic environment promote each other. Promoting economic and ecological integration in the YRD, as well as realizing the coordination of lucid waters-lush mountains and mountains of gold and silver, is the only way to accomplish regional high-quality development.
Revealing the driving factors and scale effects of water pollutant discharges is of great importance in the study of the environmental consequences of urban agglomeration evolution. It is also a prerequisite for ensuring collaborative water pollutant reduction and environmental governance in urban agglomerations. This study, taking 305 counties in the Yangtze River Delta (YRD) as an example, selects Chemical Oxygen Demand (COD) and Ammonia Nitrogen (NH3-N) as two distinctive pollutant indicators, and uses the Spatial Lag Model (SLM) and Spatial Error Model (SEM) to estimate the driving factors of water pollutant discharges in 2011 and 2016. Then the Multiscale Geographically Weighted Regression (MGWR) model is constructed to diagnose the scale effect and spatial heterogeneity of the driving factors. The findings show that the size of permanent population, the level of urbanization, and economic development level show positive global-scale impacts on water pollutant discharges, while the level of industrialization, social fixed assets investment, foreign direct investment, and local fiscal decentralization are dominated by micro impacts at the local scale. The spatial heterogeneity of local influencing factors mainly presents the following characteristics. Social fixed assets investment has a strong positive effect on both COD and NH3-N discharges in the Hangzhou-Jiaxing-Huzhou region and coastal area of the YRD; industrialization has a positive effect on COD discharges in the Taihu Lake basin and Zhejiang province; foreign direct investment has a local inhibitory effect on NH3-N discharge, and the "pollution halo" effect of foreign investment is more prominent in the marginal areas of the YRD such as northern Jiangsu, northern Anhui, and southern Zhejiang; local fiscal decentralization has a noticeable inhibitory effect on COD discharge in the central part of the YRD, reflecting the positive impacts of improved local environmental awareness and stronger constraints of multi-level environmental regulations in the urban agglomeration. Therefore, it is recommended to take green production and living style to reduce the discharge base of water pollutants, to embed environmental push-back mechanism in the fields of industrial production, capital investment and financial income and expenditure, and to establish systematically a high-quality development pattern of urban agglomerations that is compatible with the carrying capacity of the water environment.
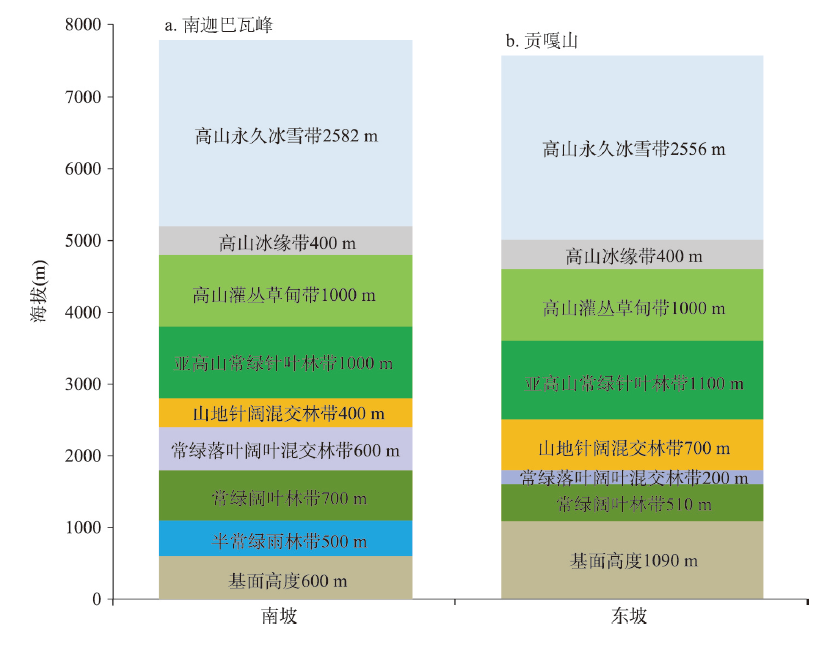
Mountain altitudinal belts are the miniature of horizontal differentiation and succession of climatic and vegetational zonation. However, altitudinal belts' vertical range, transition model, inner structure and combining pattern vary from place to place. In Mt. Taibai of the central section of China's north-south transitional zone, we have found an altitudinal belt with the largest range in the world, namely, the montane deciduous broad-leaved forest, which extends continuously from the mountain base to about 2800 m, including basal oak belt, typical oak belt of two sub-belts and cold-tolerant pioneer birch belt of two sub-belts, which could otherwise develop independently. Characterized by a "three layers and five sub-belts" structure, this "super altitudinal belt" is much vertically broader than the threshold of 1000 m for normal altitudinal belts. Its formation is closely related with its transitional geographic location, integral spectrum of altitudinal belts in central Qinling Mountains, rich and diverse species of deciduous woody plants, and their strong competitiveness. The finding of the super altitudinal belt has multiple significance: Its existence is another significant physio-geographic feature of China's north-south transitional zone; it shows that an altitudinal belt may have rather complex inner structure and broad vertical range in some special mountain environment. This broadens our understanding of altitudinal belt structures and their mechanisms, and is of great significance for developing structural theory for montane altitudinal belts. This finding also demonstrates that there are many big questions for us to explore and study in the north-south transitional zone, and it is expected that our finding could trigger in-depth study of local climate and biodiversity responsible for the formation of this super belt, and of the complex structure and ecological effect of China's north-south transitional zone.
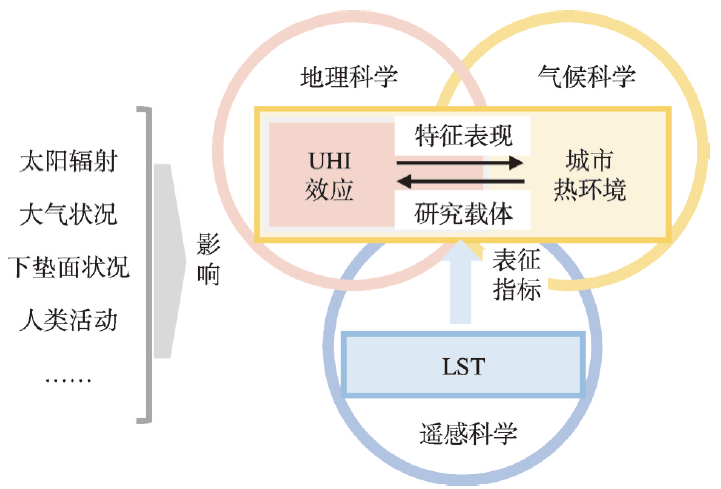
Understanding the conceptual connotation related to urban heat island (UHI) effect and clarifying its quantitative characterization methods are important foundations for effective UHI effect research. The global urbanization has made the UHI effect more and more common, which leads to a rapid increase in the number of related studies. In this context, different concepts related to UHI effect have emerged, and particularly, various quantitative characterization methods have been developed for surface urban heat island (SUHI) which has the advantage of spatial heterogeneity characterization. However, there is still a lack of systematic review of quantitative characterization methods of SUHI. Therefore, this study distinguished and analyzed the confusing concepts such as urban heat island, urban heat island effect, surface temperature and urban thermal environment. Then, the typical spatial locations and scale ranges of various UHIs were summarized. In the quantitative characterization of SUHI effect, this study categorized the SUHI range identification methods into four categories: methods based on urban and rural temperature threshold, temperature grade threshold, Gaussian fitting parameter, and temperature attenuation mutation. The current SUHI range identification research focuses on the cognition of the SUHI impact scale. This study also sorted out the SUHI intensity indicators corresponding to various range identification methods. Understanding the essential connotation of each indicator is the prerequisite for grasping the potential differences between the indicators. Future research should integrate multi-source SUHI monitoring methods, develop large-scale SUHI quantitative characterization methods, and cognize connected SUHI spatial morphology.
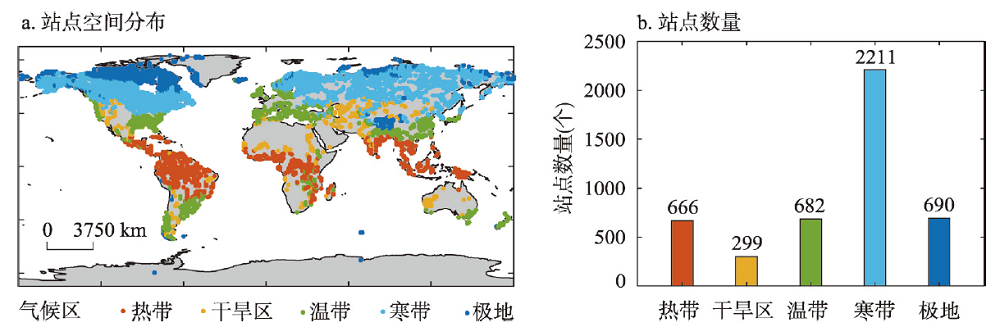
Quantification of the surface temperature difference (ΔTs, lake minus land) between lakes and their surrounding lands is an important step for understanding lake climate effects. In this study, we investigated the spatial and temporal patterns of ΔTs of global lakes and elucidated biophysical mechanisms that underly these patterns. Results are based on outputs from a fully coupled simulation with the Community Earth System Model (CESM) for the period from 1991 to 2010. We found that ∆Ts showed large seasonal variations, with the strongest warming (mean ΔTs = 4.37 K) in September and the strongest cooling (-0.99 K) in April in the northern hemisphere. There is no significant interannual variation in ∆Ts in individual climate zones or on the global scale. Spatially, only lakes in the arid climate showed a cooling effect (annual mean ΔTs = -1.19 K). Lakes in the other four climate zones (tropical, temperate, cold, and polar) exhibited warming effects (annual mean ΔTs from 0.92 K in cold climate to 2.78 K in tropical climate). The dominant biophysical drivers of ∆Ts differed across climate zones. In arid climate zone, the lake cooling effect was mainly caused by lake evaporation stronger than land evaporation. In tropical and temperate climate zones, low lake energy dissipation efficiency was the dominant contributor to lake warming. In cold and polar climate zones, the lake warming was caused by large albedo contrasts between the lake and the snow-covered land, with additional contribution from energy consumed by lake ice-melting. On the global scale, the reduced lake energy dissipation efficiency increased ∆Ts by 3.77±0.13 K, while enhanced evaporation decreased ∆Ts by -2.01±0.1 K.
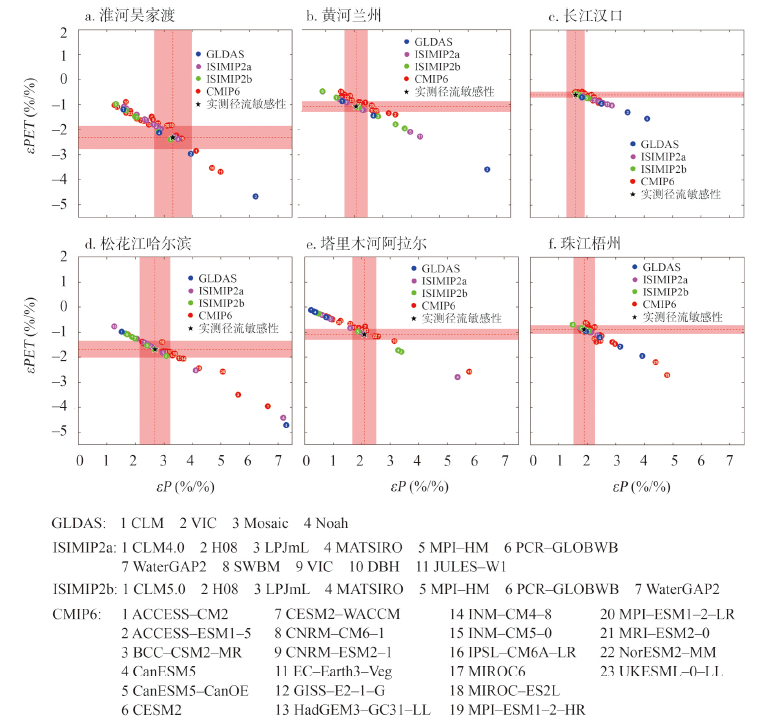
Accurately assessing the sensitivity of runoff to climate change is critical for water resource management. In recent years, multi-source meteorological and hydrological datasets have been widely used in the analysis of runoff sensitivity to climate change, but no studies has evaluated different datasets from the perspective of runoff sensitivity. Based on the observed meteorological and hydrological data of six watersheds in China with different climatic conditions, the sensitivity of runoff to changes in precipitation and potential evapotranspiration were estimated. The sensitivity index was then used as the benchmark to evaluate the simulation capability of runoff sensitivity of 45 datasets in GLDAS (Global Land Data Assimilation System), ISIMIP2a (Inter-Sectoral Impact Model Intercomparison Project Phase 2a), ISIMIP2b, CMIP6 (Coupled Model Intercomparison Project Phase 6). The results showed that the simulation accuracy of the GLDAS dataset was low, and the simulation accuracies of CMIP6, ISIMIP2a, and ISIMIP2b datasets had little difference. For specific datasets, CLM4.0 in ISIMIP2a, UKESM1-0-LL and MIROC6 in CMIP6 had good runoff sensitivity simulation results in the six watersheds, and they can be applied to runoff sensitivity simulations under different climatic conditions. The results can provide reference for the predictions of runoff and water resources changes in watersheds with limited observation data under the influence of climate change.
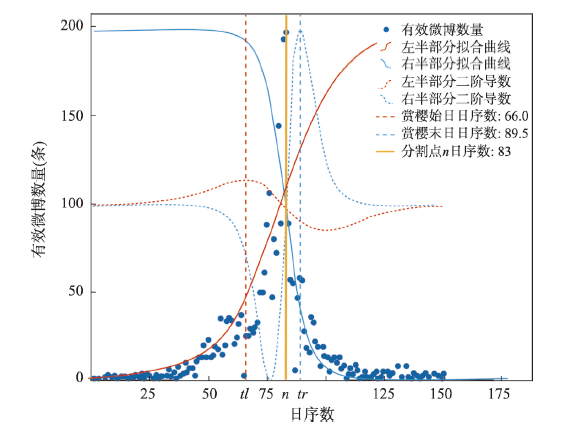
Studying the impact of climate change on the tourism and leisure functions provided by plant ecosystems is an important field of tourism geography. Obtaining plant phenological timing data and analyzing its change characteristics and mechanism not only provides evidence of the impact of climate change on tourism but also supports the practical work of tourism responding to climate change. Based on the logistic curve fitting method, this paper developed and optimized a method to extract the timing for cherry blossom-viewing tourism, filtered 587891 valid microblogs from 2879033 Sina blogs related to cherry blossoms, and then extracted and reconstructed a dataset of cherry blossom-viewing tourism activities in China from 2010 to 2019, which has been verified by observation site records and the relationship between temperature factors. On this basis, the spatiotemporal pattern of the start timing, end timing, and duration of cherry blossom-viewing activities in the past 10 years were analyzed, and the time trend of cherry blossom-viewing activities from 2020 to 2050 were simulated and predicted under the climatic scenarios of SSP2-4.5 and SSP5-8.5. The results revealed that: (1) In the past 10 years, the start time of cherry blossom-viewing activities in most cities (61.9%) across the country was earlier, so was the end time (76.2%), and the duration was shortened (52.4%). For every 1° increase in latitude, the start time and end time were delayed by 0.286 days (P < 0.01) and 0.394 days (P < 0.01), respectively, and the duration was shortened by 0.286 days (P > 0.05). (2) Under future climate scenarios, the start time and end time of cherry blossom-viewing activities in most cities will be advanced and the duration will be extended. The SSP5-8.5 scenario has a more obvious impact on the cherry blossom-viewing activities than the SSP2-4.5 scenario. The framework and method in this paper can inspire researchers to focus more on the impact of climate change on specific tourism activities using big data methods.
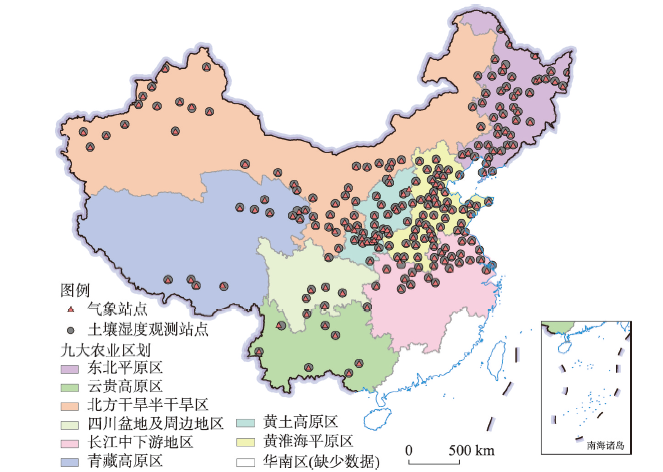
Soil moisture is an important variable that affects water-heat exchange between land and air, indicating the evolutionary characteristics of drought. In order to reveal the characteristics of soil moisture in dry cropland across China and its meteorological driving factors, this paper uses site data to study the spatial and temporal characteristics of soil moisture change trends in dry cropland across the country from 1992 to 2018, and uses correlation and sensitivity analysis methods to explore the driving mechanism of soil moisture. The results showed that the soil moisture in dry cropland across China tended to change from decreasing to increasing in 2001, which was dominated by soil moisture in summer and autumn. In addition, there is spatial heterogeneity in the change of soil moisture. Since 2001, the soil moisture in the northeast region has increased significantly, while that of the southwest region has decreased significantly. The spatiotemporal variation of precipitation and evapotranspiration is the main reason for the spatiotemporal variation of soil moisture, and the two factors have a synergistic effect. The northern region is dominated by precipitation, while the southern region is dominated by evapotranspiration.
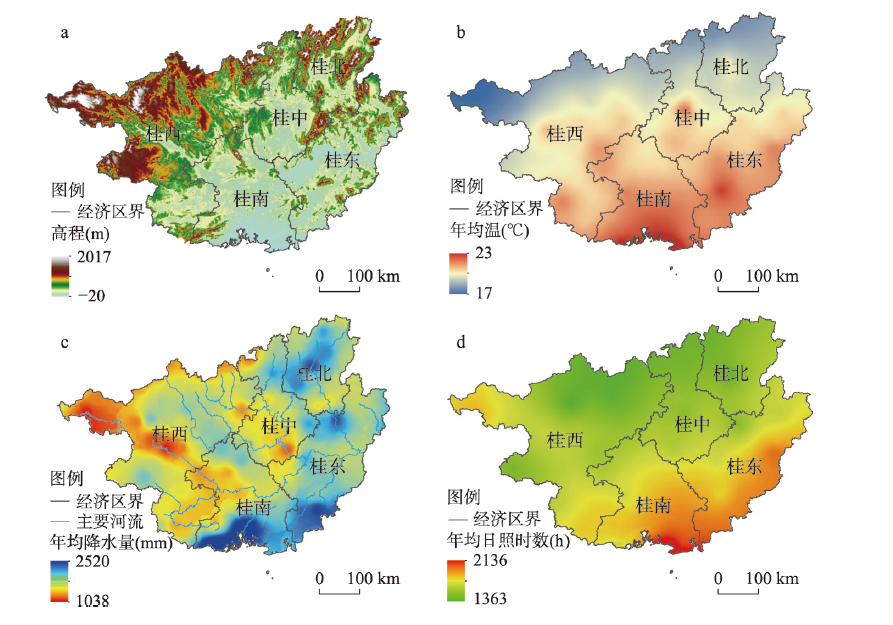
Crop production structure and layout is a traditional research content of agricultural geography, and the research on the evolution characteristics and mechanism of crop production pattern can provide some reference for the optimal allocation of regional agricultural production elements. In this paper, we use the location Gini coefficient, gravity center movement model and comparative advantage index to reveal the evolution characteristics of the production pattern of four major crops, i.e., grain, sugar, fruits and vegetables, in Guangxi from 1995-2019 and their formation mechanism, and accordingly put forward relevant optimization suggestions. The results showed that grain crops "retreating", and sugar, fruits and vegetables "advancing" constitute the basic situation of the major crops competition. In terms of spatial distribution, the grain and vegetables are relatively scattered, the sugar production has an obvious trend of geographical agglomeration, and the fruit production has moved from relative concentration to dispersion. The scale comparative advantage of major crops dominates the aggregated comparative advantage, and the weak position of grain production is gradually strengthened. Sugar production has the absolute scale and aggregated comparative advantages. Fruits and vegetables have a prominent scale comparative advantage, but the efficiency comparative advantage needs improvement. The combination of forces such as the constraints of resource endowments, the dominance of market supply and demand and comparative efficiency, the inducement of changes of rural social development factors, the guidance or correction of institutional environment, and the circular accumulation of agglomeration economy, all together drive the evolution of crop production patterns. The unique regional situation determines that Guangxi's crop production should coordinate economic, social and ecological functions, and promote the transformation of crop production from scale expansion to comprehensive benefit enhancement by adjusting production structure, optimizing the spatial layout and strengthening industrial agglomeration.
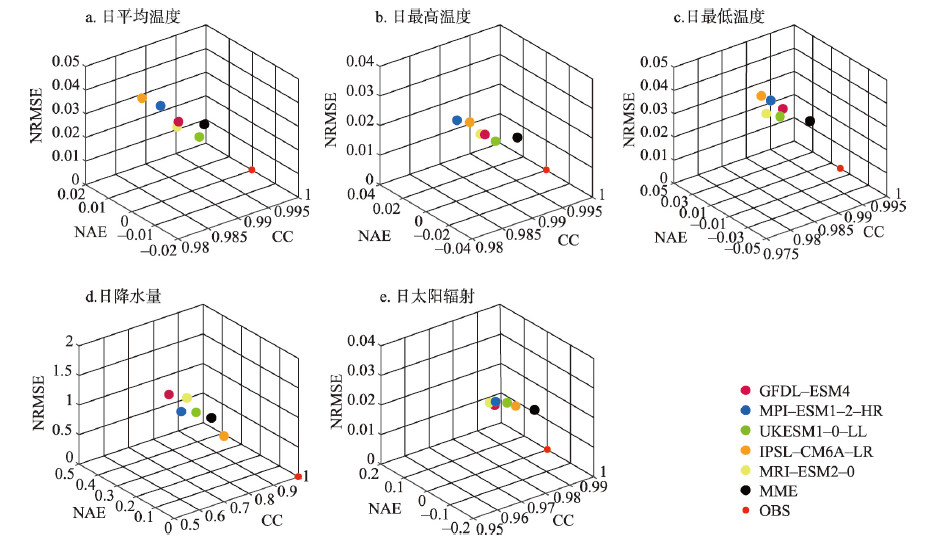
Frequent occurrence of extreme drought events has great impacts on cotton production in Central Asia. In this study, data from field experiments designed for different sowing densities and irrigation levels at the Zangiata experimental station in the Tashkent of Uzbekistan were adopted for calibration and validation. Using the CMIP6 climate change datasets for three shared socioeconomic pathways (SSP1-2.6, SSP3-7.0 and SSP5-8.5), we analyzed the variations in the standardized precipitation evapotranspiration index in three-month steps (SPEI-3) within the growing seasons from May to August during the period from 2021 to 2090 and simulated the changes in cotton yields under meteorological drought conditions using the APSIM-Cotton model considering CO2 fertilization. The results showed that the APSIM-Cotton model accurately simulated the cotton yield in Tashkent, and the relative errors between the simulated and measured yields were lower than 10.4% in both the calibration and validation years. Both temperature and drought frequency are expected to increase in the future during the cotton growing period in Tashkent. For the SSP3-7.0 and SSP5-8.5 scenarios, the percentages of severe drought are 36.7% and 40.0% from 2021 to 2050, respectively, and the percentages of extreme drought are 66.7% and 86.7% from 2061 to 2090, respectively. Severe meteorological droughts under three emission scenarios (SSP1-2.6, SSP3-7.0, and SSP5-8.5) would cause reductions of 28.0%, 29.6%, and 32.1% in cotton yields from 2021 to 2050, respectively, compared with the period 1961-1990. Severe meteorological droughts under the SSP1-2.6 scenario would result in a reduction of 31.5% in cotton yield from 2061-2090. Under the SSP3-7.0 and SSP5-8.5 scenarios, severe meteorological droughts would result in reductions of 33.1% and 35.7% in cotton yield, respectively, and extreme meteorological droughts would cause reductions of 41.3% and 54.2% in cotton yields, respectively. CO2 has a certain fertilization effect. The rise in CO2 concentration would increase the cotton yield by 14.9% to 25.0%; however, the increase in yields will not be sustained at concentrations above 750 µmol/mol. The results will provide scientific data for planting strategies for cotton in Central Asia that account for climate change and a reference for the future cooperation mode of the cotton industry between China and Central Asian countries.
Analyzing the characteristics and formation mechanism of the spatial correlation network for urban water utilization efficiency has important policy implications for improving coordination and efficiency of regional urban water utilization. In this paper, we take 107 cities at prefecture level and above located in the Yangtze River Economic Belt as the research area. We calculate the water utilization efficiency from 2009 to 2018 by using the stochastic frontier analysis and construct the spatial correlation matrix. We also investigate the overall structure, individual structure, and spatial clustering mode of the spatial correlation network of urban water utilization efficiency based on the social network analysis, and explore the network formation mechanism based on the quadratic assignment procedure. The empirical results indicate that: First, the overall utilization efficiency of urban water is still at a low level, but has improved significantly with the appearance of the spatial correlation network pattern. The overall network has good accessibility and little asymmetry exists between connection pairs. However, there are still some problems such as loose correlation and poor stability of network structure. Second, the central cities in the upper, middle and lower reaches act as the main undertakers and intermediary communicators, showing the spatial distribution characteristics of "core-periphery" among the central and marginal cities. Third, the spatial correlation plates of urban water utilization efficiency can be divided into the net spillover, main benefit and two-way spillover plates, following the distribution characteristics of the urban agglomerations in the Yangtze River Delta, the middle reaches of the Yangtze River, and the Chengdu-Chongqing region. Last, geographical proximity, economic development, openness, and other natural geographical conditions and socio-economic factors have significant impacts on the formation of the urban water utilization network.
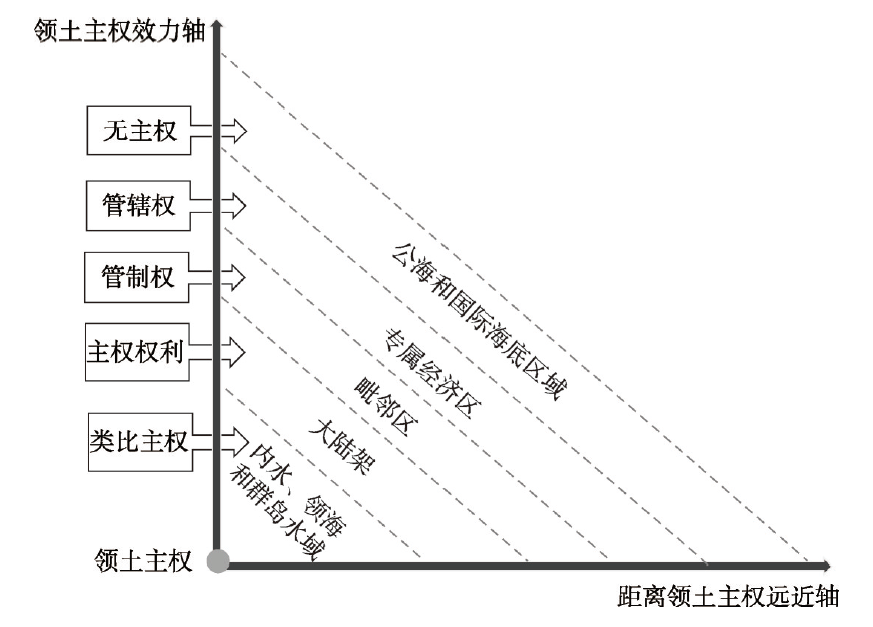
For a long time, the ocean has been located at the edge of the society, and the ocean governance inevitably falls into the terrain-centrism. This paper criticized the marine territorial governance of terrestrial ontology and its territorial logic, and constructed the ocean as a four-dimensional space-time where volume space meets dynamic time. It pointed out that the ocean was multi-dimensional, fluid, nonlinear and non-objective, and constructs a framework for analyzing the ocean territory, which is characterized by volume territory, mobile territory and dynamic territory. Furthermore, it is applied to the theory and policy cognition of maritime territorial governance in the South China Sea (SCS), reconstructing the concept of "time, space and movement" that has long been shackled on the land norms, and responding to the new materialist orientation of cultural and political geography. The results show that: (1) In terms of volume control in the SCS, island expansion is an effective strategy. The expansion of islands and reefs has folded the volume of the sea into a two-dimensional territory, controlling the three-dimensional space by flattening it, and changing the geographical and spatial nature of the SCS. (2) In terms of liquidity control in the SCS, due to the fluid, scale and depth characteristics of the sea, as well as the ambiguity of the legal boundary, it is more complicated to maintain maritime security in the SCS. Therefore, it is necessary to consider the corresponding regulatory strategy to control illegal liquidity. (3) In terms of the dynamic management and control in the SCS, attention should be paid to fishermen's unique ecological ethics, and the dialogue between different ontologies and information translation should be considered for marine protection, so that the protection behavior can be more closely integrated into the local social and cultural contexts. This study provides a critical perspective for marine territorial governance from political geography and promotes the study of the relationship between human beings in human geography.
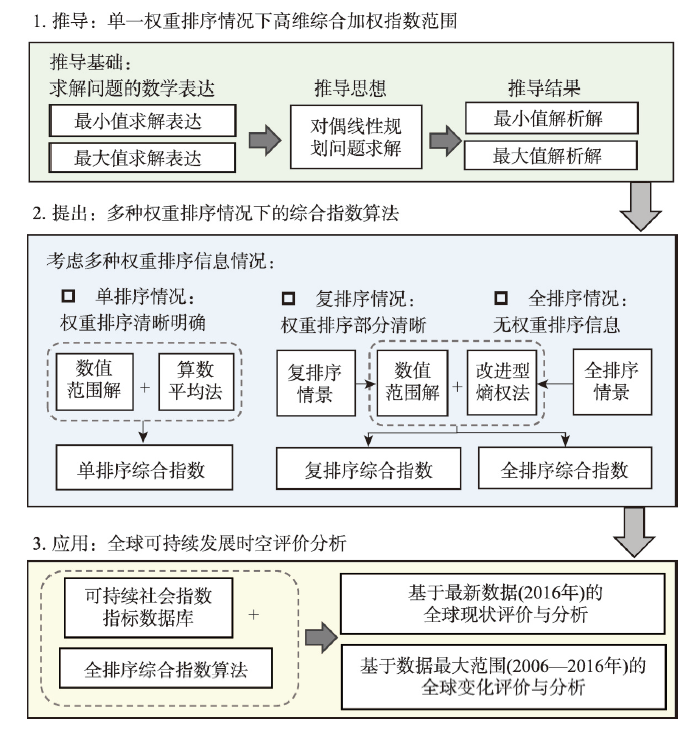
To achieve regional sustainable development and high-quality development, regular monitoring and scientific assessment are needed. The most widespread and informative method for such an assessment is to employ a composite index. To generate a composite index, various indicators that reflect regional development quality in different aspects are weighted and then aggregated to an index. The core idea of the composite index is weighting, which can be achieved objectively or subjectively. Objective weighting is usually conducted using statistical characteristics of indicator values; thus, the resultant weights change with the values of indicators. This change questions the objectivity of the weighting. In contrast, subjective weighting well reflects the willingness of decision-makers, who feel it is difficult to determine the weights of each indicator if there are too many. Fortunately, a recently developed method eliminated this difficulty. It requires only the rank (also ranked weights) instead of the accurate weights of different indicators, but the number of indicators is restricted to only three. In this study, we improved this method by relaxing such a restriction. We employed the duality of linear programming to generalize the method for calculating a composite index based on any number of indicators. The aggregation is adjusted to expand the scope of the application, and the use of entropy weights is adjusted to improve the interpretability of results. Furthermore, we developed three different calculation modes: single, multiple, and full ranks, corresponding to three conditions of decision-makers' subjectivity: strong, weak, and non-subjective, respectively. Finally, we employed this method to examine global sustainable development patterns temporally and spatially. Since this method is suitable for high- and low-dimensional cases and can consider decision-makers' subjectivity, it has strong universality.