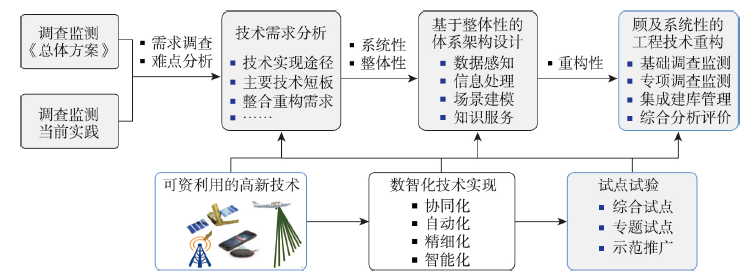
Designing and building up the natural resources surveying and monitoring technological system (referred to as the "Technological System") is an important measure to establish and improve the natural resources management, promote the intensive and economical utilization of natural resources, and harmonize the coexistence between man and nature. It is a geo-science related research project with many complicated factors and challenging tasks. Following the mandates and requirement of the unified natural resources surveying and monitoring, the paper firstly analyzes the basic problems in designing and building up the "Technological System" from the holistic characteristics of the surveying and monitoring process and the systematic characteristics of its engineering implementation. A comprehensive overall framework of "Technological System" is resulted and discussed. Then the development direction of "Technological System" is proposed and analyzed, including the collaborative data sensing, automatic information processing, elaborative natural resource scene modeling and management, as well as intelligent knowledge service. Then the article discusses the digital-intelligent realization path of the "Technological System" to meet the advanced and practical requirement. It has led to the formulation of the future research agenda with five major research and development tasks, including the development of space-sir-ground-ocean-web collaborative sensing network system, construction of automatic information processing platform, spatio-temporal scene modeling of natural resources, development of spatio-temporal knowledge service of natural resources, and reconstruction of engineering technical flow. In the future, it is necessary to strengthen the strategic needs analysis, enhance key technologies innovation and promote interdisciplinary collaboration in order to effectively build up the "Technological System" and promote its operational application.
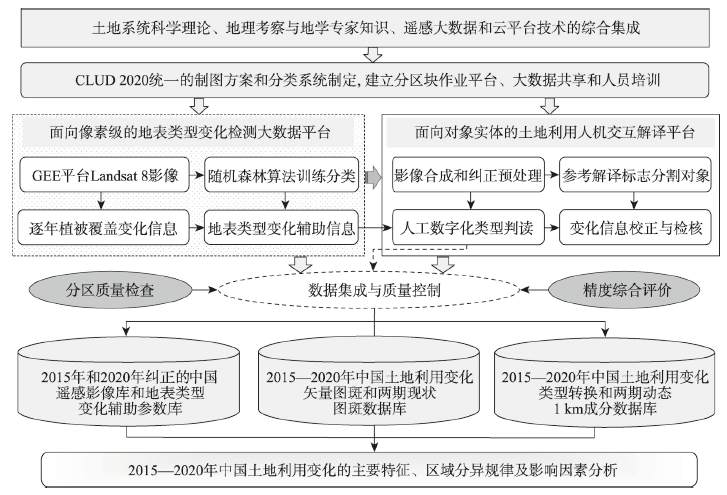
The continuous remote sensing monitoring of land use/cover change at the national scale is of great scientific significance for land spatial planning and blueprint drawing of "Beautiful China" in the new era. Landsat 8 OLI, GF-2 and other satellite remote sensing data were used to develop the data of land use change across China during 2015-2020 and China Land Use/Cover Dataset in 2020 (CLUD 2020) by integrating remote sensing big data and expert knowledge-assisted human-computer interaction interpretation methods. Long time series land use dynamic database at a 30-m resolution in China was established at 5-year interval in the end of 1980s-2020. On this basis, the general trend, regional differences and main characteristics of land use change in 2015-2020 were revealed from national and regional scales. The research indicated that integrating vegetation cover change at a 30-m resolution and land change information generated by remotely sensed big-data cloud calculation into the expert human-computer interaction interpretation can effectively improve the efficiency of mapping and the accuracy of land use change detection. The overall accuracy of CLUD 2020 first-level type mapping reaches 95%. In general, the intensity of territorial development entered a stable state compared with 2010-2015. During the period, the cropland continued to decrease. Nationwide farmland was encroached by urban development and construction, paddy fields in Northeast China continued to decrease, and cultivated land in Xinjiang was reclaimed in the south and abandoned in the north. The built-up land continued to increase, showing a spatial pattern that "the expansion of built-up land changed from the agglomeration of coastal areas and mega and large cities in 2010-2015 to the surrounding sprawl of large, medium and small towns in the central and western regions in 2015-2020". Although the area of natural ecological land for forest and grass continued to decrease nationwide, the intensity decreased compared with 2010-2015. Under the continuous impact of climate change, the area of water in the Qinghai-Tibet Plateau increased significantly. The pattern of land use change is closely related to the national macro strategy for high-quality development during the "13th Five-Year Plan" period (2016-2020) and ecological civilization construction, as well as the impact of climate change.
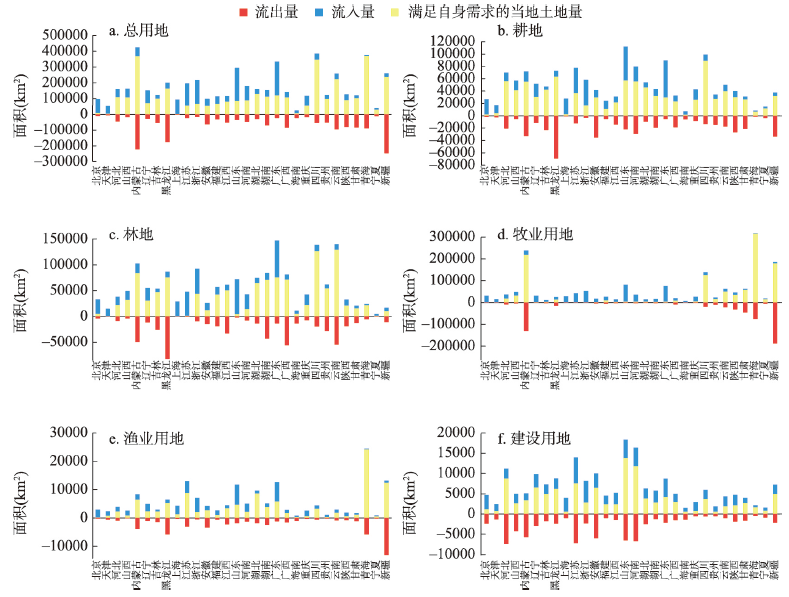
With the continuous enhancement of regional connectivity, the indirect land resources use through trade in goods and services plays an increasingly important role in the utilization of land resources. However, relevant research in this field is still in its infancy, and few papers have addressed this issue. This paper, for the first time, uses the multi-region input-output model to calculate the embodied land in the 30 provinces (autonomous regions and municipalities) and 8 regions of China from the perspective of regional trade, and further analyzes the spatial pattern characteristics of embodied land flows. The results show that the amount of embodied land occupied by China's inter-regional trade accounts for 21.39% of the country's total land, and an average of 38.54% of China's provincial land demand is met by land export from other provinces. More than 80% of land consumed by Beijing, Tianjin and Shanghai are from other provinces. Heilongjiang, Inner Mongolia, Xinjiang, and Hebei are the provinces with the largest net exporter of cultivated land, forest and grazing land and aquatic land, fishery land, and construction land, respectively (the outflows account for 42.26%, 27.53%, 38.66% and 35.28% of the corresponding land types in the province); and Guangdong, Shandong and Zhejiang are the main net importer. The flow of agricultural land (cultivated land, forestland, grazing land and aquatic land) mainly generally shows a shift from west to east and from north to south. The regions in northeast and northwest China have the largest scale of agricultural land outflow, mainly into East and South China. In addition, 8.43% of cultivated land, 7.47% of forestland, 6.41% of grazing land, 6.88% of aquatic land and 18.35% of built-up land in China are provided for foreign use through international trade. This paper provides feasible ideas and a theoretical basis for solving the contradiction between land use and ecological protection, and realizing sustainable land use in China.
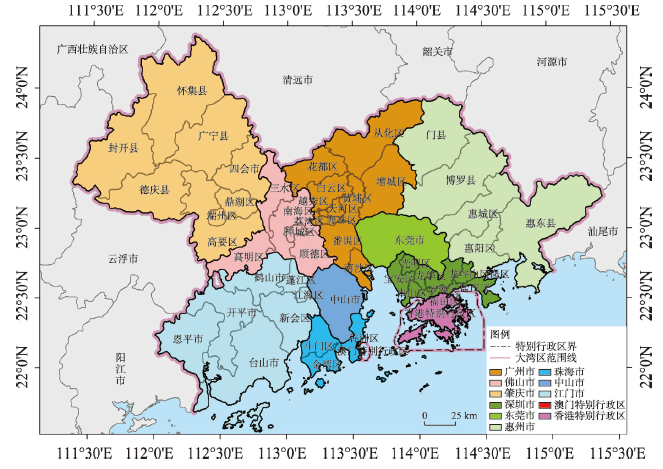
Exploring the types of spatial patterns of urban land use in the Guangdong, Hong Kong and Macao since the reform and opening up in the late 1970s, and the multi-dimensional and interactive driving mechanism for the evolution of urban land spatial pattern, is important for promoting the construction of the Guangdong-Hong Kong-Macao Greater Bay Area, and building a world-class bay area and urban agglomeration. This study divided and defined the evolution of urban land patterns types in the Greater Bay Area from the perspectives of area, shape and distribution characteristics based on fuzzy clustering. Using geographic detectors, this study measured the multi-dimensional driving forces and interactions of urban land use changes in the study area. The results showed that: (1) In terms of spatial pattern, there are five types of urban land use: fractal/complex large area, fractal small area, complex small area, simple small area and scattered area. The area scale and shape complexity of urban land had a certain positive correlation. (2) Socio-economic factors such as population, GDP, local fiscal revenue, fixed asset investment, and road network density had significant impacts on urban land area and morphological changes. The impacts of core cities on the development of urban agglomerations became apparent after 2000. In the later stage of the research, the differences among the effects of various influencing factors on the changes in the area, distribution and spatial pattern types of urban land use tended to be weakened, but the influences of social and economic factors on the shape characteristics increased. (3) The interactions of influence on the change of urban land area characteristics were the most complex, with four types of nonlinear enhancement, synergy enhancement, single factor weakening and nonlinear weakening; the interactions of influence on shape, distribution and spatial pattern changes were mainly manifested as synergistic enhancement and non-linear enhancement. Interactions between core city traction, road network density, river network density and most factors produced a "1+1 > 2" effect, reflecting the strong promotion effects by the core cities of urban agglomerations and transportation advantages.
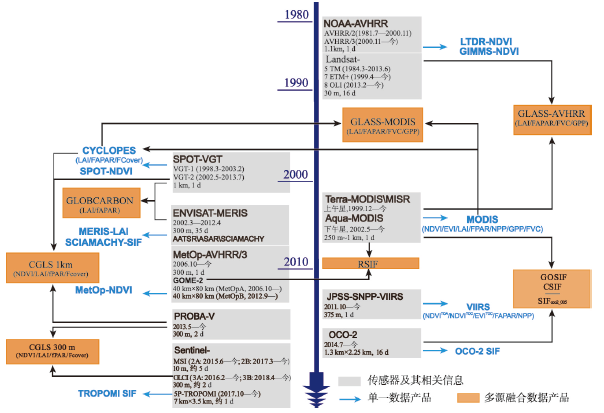
In recent years, earth observation and remote sensing technology has enabled a better assessment of the terrestrial vegetation dynamics and improved our understanding of critical global environmental change issues. Various long-term satellite derived vegetation datasets have been produced at the global scale. However, a systematical review of these new resources from the perspective of various end-users is still lacking. We review the history of remote sensing derived global vegetation datasets by focusing on satellite missions and corresponding data products, and paying special attention to the sources, characteristics and connections of them. These products have undergone remarkable transitions, i.e. (1) from vegetation spectral index to biophysical characteristics, (2) from traditional optical remote sensing to Solar-induced Chlorophyll Fluorescence (SIF) and satellite radar system, and (3) from single-sensor-derived products to datasets fusing multiple remote-sensing sources. In the future, in order to improve the quality of existing products considerably, including its temporal and spatial resolutions, accuracy, consistency and continuity, new datasets can be developed through fusing multiple data sources based on the raw data of long-term satellite observations. Regions and ecosystems characterized by unique natural conditions should be given more attention in the way of developing algorithms. Meanwhile, multiple vegetation traits need to be monitored. In addition, the development of sharing platforms for remote-sensing datasets, enabling targeted vegetation monitoring, is urgently required so as to facilitate standard data processing and distribution services, and deliver data quality information to end-users in an efficient and transparent way.
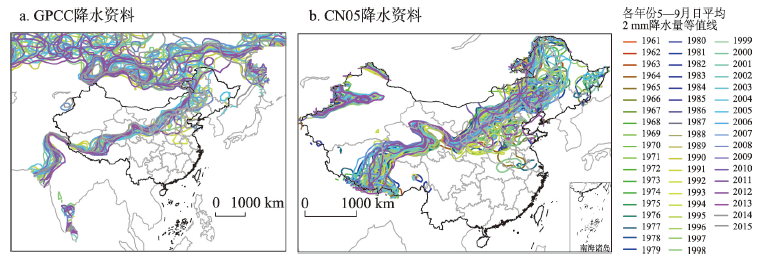
In this study, the NCEP1 (National Centers for Environmental Prediction) daily reanalysis data and GPCC (Global Precipitation Climatology Centre) precipitation reanalysis data from 1961 to 2016 are used to define the spatial range of the northern marginal zone of Asian summer monsoon (ASM). Then, the inter-annual and inter-decadal variations characteristics of precipitation, location and area of the northern marginal zone are analyzed, and the interactions among them are detailedly investigated. Moreover, the physical mechanisms of the summer precipitation anomalies in the ASM marginal zone are explored. The results show that the average position of the ASM northern marginal zone is located in the strip domain which initiates from the central part of the Tibetan Plateau, crosses the Loess Plateau and Northeast China and finally extends to the east coast of Asia. According to the types of underlying surface, regional ecological environment and climate characteristics, the ASM northern marginal zone is divided into three areas: Tibetan Plateau (85°E~105°E), Loess Plateau (105°E~115°E) and Northeast China (115°E~135°E). There is a notable positive correlation between the inter-annual variation of the precipitation in the ASM marginal zone and the location of its southern boundary. In the Tibetan Plateau, there is significant negative correlation between the area of marginal zone and the location of its southern boundary. For the Loess Plateau and Northeast China, there is notable positive correlation between the area and the location of northern boundary of the ASM marginal zone. Moreover, the location, area and precipitation of the three ASM marginal areas have significant inter-annual and inter-decadal variations. The abnormally less precipitation in the ASM marginal zone is related to the wave train of Eurasia teleconnection pattern over middle-high latitudes. During the period with less precipitation in the ASM marginal zone, the convective activity is weak at low-latitude areas. The anomalous convergence at 200 hPa over the equatorial region on the eastern shore of Africa may lead to the weakening of the ASM and the Somali jet. At 200 hPa, the Asian jet stream is also weaker and more northward. At 500 hPa, under the control of anomalous high pressure over North China, the precipitation caused by the ASM mainly concentrates in South China, and the precipitation in the ASM marginal zone in summer is abnormally less. The synoptic situation of 200 hPa and 500 hPa is opposite from that of ASM marginal zone with more precipitation. The abnormally more precipitation is related to the wave train of the Silk Road pattern in middle-high latitudes over Eurasia. The summer monsoon precipitation in East Asia is characterized as "more in the north and less in the south", and the summer precipitation in the ASM marginal zone is more than the normal level.
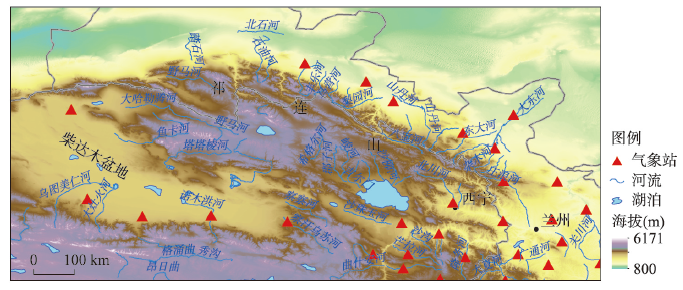
Due to global warming, dry-wet condition of the Qilian Mountains has experienced significant change in recent decades. Thus, predicting future climate change is critical for studies on the environmental evolution. To explore the climate trends under increasing temperature, we took the millennial-scale Middle Holocene Warm Period and the centennial-scale Medieval Warm Period, as "historical analogues" to compare with undergoing global warming. In this paper, we integrated abundant paleoclimate records (e.g., fluvio-lacustrine deposits, ice cores, pollen, and tree rings) in the Qilian Mountains region and paleoclimatic model simulation of the PMIP3/CMIP5 project to assess the response of dry-wet change during warm periods. Results show that strong East Asian summer monsoon brought a warm and humid climate with more precipitation during the Mid-Holocene warm period (7.2-6.0 ka BP). The Medieval Warm Period (950-1250 AD) and the little ice period show a combination of warm-dry and cold-wet climate. Modern observational data show that the climate of the study region is becoming warm and humid. Modern climates have similarities with historical warm periods at millennial and centennial scales. However, the historical analogues are due to the orbital parameters and insolation. In modern warm period they are caused by greenhouse gases and human activities. Therefore, in order to predict the future dry and wet pattern in the study area accurately, the joint effect of natural factors and human activities should be elucidated.
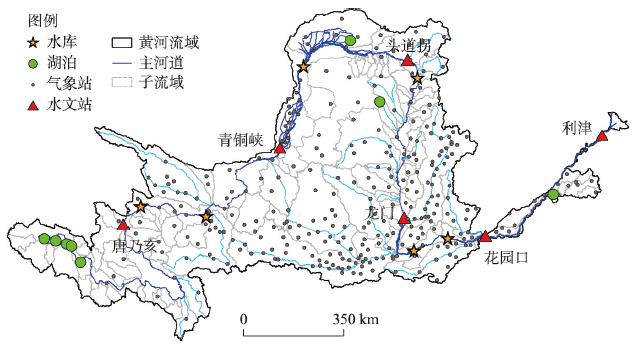
The Yellow River Basin (YRB) has been facing severe water shortages, hence the monitoring of long-term dynamics of surface water area (SWA) is essential to better understand the spatial and temporal variation of surface water resources and its driving factors. In this study, the spatial and temporal change characteristics of SWA in the YRB were revealed, and then the impacts and relative impact rate of precipitation (Pre), temperature (Temp), leaf area index (LAI), SWA in the previous year (Pre_SWA) and residual factors (e.g. water conservation measures and human water use activities) on SWA were determined in the combination of water detection index, linear slope, multiple linear regression and partial differential decomposition. The results show that: (1) the overall accuracy of classification of surface water bodies is 97%. The increase rate of year-long SWA in the study area from 1986 to 2019 is 49.82 km2/a, of which 83.2% was contributed by the SWA increment from the main river channel area, and the year 2001 is the turning point of SWA trend from decreasing to increasing; the seasonal SWA decreased at a rate of -79.2 km2/a, of which 61.8% was contributed by the SWA decrease in the sub-basin areas. (2) The SWA changes of all major natural lakes are relatively stable, and the only decreasing trend of SWA was observed in the Hongjiannao lake; the SWA of Xiaolangdi and Longyangxia reservoirs changed significantly with an increasing trend among the large reservoirs in the main river channel, and SWA increasing trends can be observed in the 50 sub-basins located in the middle and lower reaches. (3) Precipitation had the least effect on the increasing trend of SWA, and warming caused a decrease of SWA in the middle reaches, but led to an increase of SWA in the source area. The impacts of vegetation greening on the SWA trend in the main channel area and sub-basin areas are 10.12 km2/a and 7.26 km2/a, respectively. Residual factors had a negative reffect on the SWA trend in the sub-basin areas, where the SWA reduction induced by human water use was much greater than the SWA increment induced by small water conservancy projects. However, residual factors had a positive effect on the SWA increase due to the great regulating storage capacity of large reservoirs in the main river channel area.
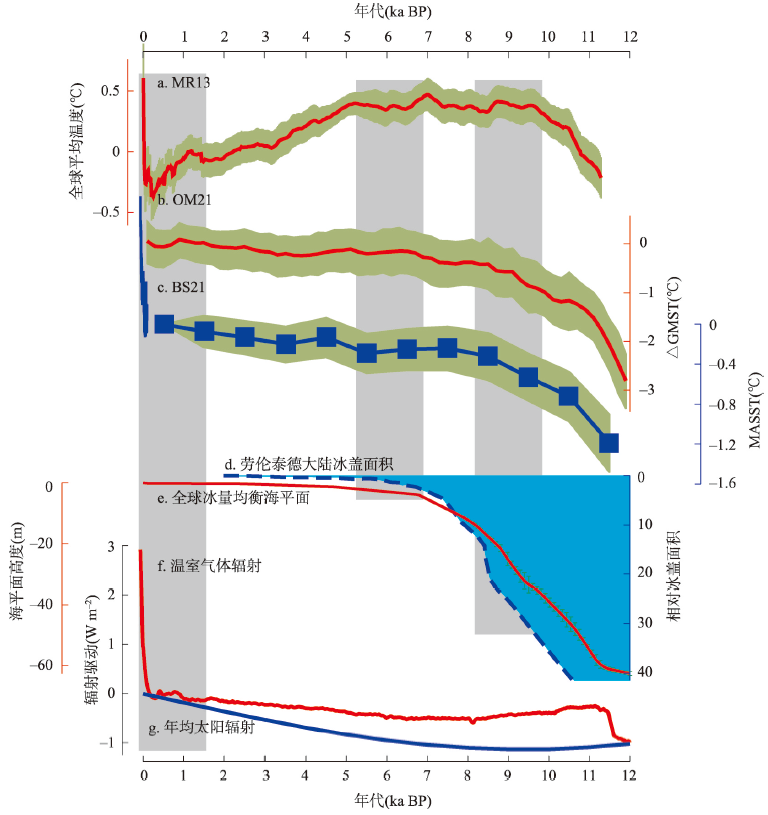
During the past few years, an increasing number of studies in both China and abroad have highlighted a long-term warming trend during the Holocene. However, this trend challenges the traditional view of a long-term Holocene cooling trend and a "mid-Holocene Megathermal". Comparison of long-term records indicating a rising global sea level, a decreasing area of terrestrial ice-sheets, and increasing radiative forcings of insolation and GHGs (greenhouse gases) leads us to conclude that a long-term Holocene warming trend is more reasonable than the cooling trend. In the original literature documenting a "mid-Holocene Megathermal" and the subsequent late Holocene cooling trend in China, the uncertainties in the supporting evidence are clearly indicated. These uncertainties have been further demonstrated by recent results that the most significant uncertainty arises from the impacts of human activities on sedimentary proxies, especially in the late Holocene when these impacts were greatly intensified. Thus, reconstructions of late Holocene temperature history based on sedimentary proxies are potentially biased by human impacts. Given that the current debate regarding temperature history of the Holocene focuses on the late Holocene, we propose that future emphasis should be placed on the temperature history of the late Holocene. We suggest that more reliable late Holocene temperature records should come from areas and/or sedimentary proxies that are weakly influenced by human activities, which is especially important to studies on the development of Chinese civilization that lasted for over several millennia. Overall, reliable late Holocene temperature records can potentially provide a reliable foundation for improving our understanding of the following themes: (1) the development of Chinese civilization under the background of long-term temperature change; (2) the evolutionary history of "human-land relationship" during the late Holocene; and (3) the climatic and environmental issues associated with global warming.
The Wutou (WT) section (21°32′8.25″N, 108°06′59.9″E), with a thickness of 393 cm storm sediments located in Jiangping, Guangxi Zhuang Autonomous Region, consists of dune sands-lagoon facies-weak pedogenic sedimentary sequences of the Late Holocene. Based on sedimentary characteristics of storm strata in the field investigation, 6 AMS-14C, OSL dating ages and the analyses of grain size and heavy minerals, the evolution history of storm surges has been reconstructed over the past thousand of years along the coast of the Beibu Gulf in Guangxi. The results show that the storm sediments are characterized as coarse mean grain size and poor sorting, with high maturity of heavy minerals and low stability, which results from quick accumulation caused by the storm surge from the land-facing side of the coastal backside dune sands. Nine storm surge peak periods recorded in the WT section over the past millennia are mainly concentrated within the Little Ice Period after 1400 AD, which are inversely correlated with the trends of SST and ENSO activities in the western Pacific. Some of storm surge peak periods recorded in the WT section and 4 "sea overflow" events from historical documents nearly synchronized with the changes of the sunspot activity. This suggests that the storm surge peak periods revealed by the WT section are probably controlled by the solar activity to a great extent, in addition to the impact of the Western Pacific Warm Pool and ENSO.

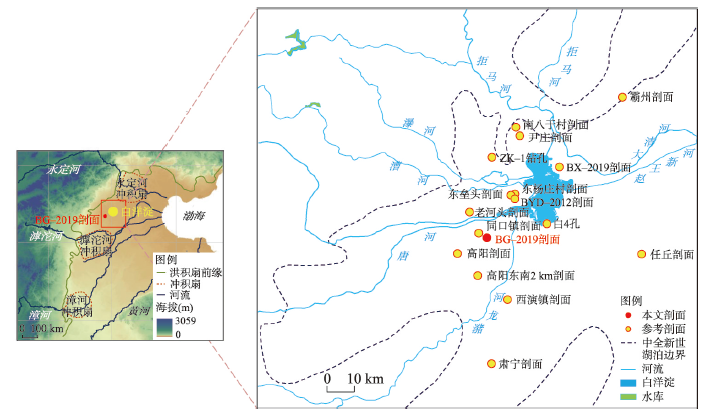
The North China Plain is a typical diluvial-alluvial plain with an unstable depositional environment and poor sedimentary continuity. However, the effects of changes in sedimentary phases or hiatuses were not considered in previous studies of the sedimentary record of the North China Plain, which limits our understanding of the environmental and climatic evolution of the region during the historical period. Baiyangdian, the largest freshwater lake in the plain, is a potentially valuable archive of regional paleoenvironmental information since the late Pleistocene. We investigated a sedimentary profile (BG-2019; 38°46'2.55"N, 115°49'0.41"E; 7 m a.s.l) in Gaoyang County, in the southwestern part of Baiyangdian Lake region; the profile is ~6 m long. The results of AMS 14C and OSL dating indicate that profile BG-2019 has two intervals of lacustrine facies, two intervals of fluvial facies, one interval of swamp facies, one interval of fluvial-lacustrine delta facies, and two intervals of non-deposition or stratigraphic lacunae. The ages of the various facies are as follows. Lacustrine facies: 10270-13710 cal a BP and 4630-5400 cal a BP; swamp facies: 3470-3700 cal a BP; fluvial-lacustrine delta facies: 7130-8000 cal a BP; fluvial facies: 3700-4630 cal a BP and 3230-3470 cal a BP;; intervals of interrupted deposition: 8000-10270 cal a BP and 5400-7130 cal a BP. Therefore, no continuous lacustrine facies exists in the Baiyangdian region since the Lateglacial. Baiyangdian was a small lake during the Lateglacial, but was more extensive during the middle Holocene, although with discontinuous lacustrine facies. During the late Holocene the lake began to shrink under the influence of climate change and human activity. No other than human activity around the modern Baiyangdian Lake was reserved. Pollen analysis shows that the vegetation landscape of the Baiyangdian Basin differed substantially between the Lateglacial and the middle Holocene. During the Lateglacial, the climate was cold and dry, and vegetation dominated by Artemisia, Chenopodioideae, Poaceae and Asteraceae developed in the plain, while the western mountains had a limited forest cover. During the middle Holocene, when the climate was warm and humid, grassland vegetation dominated by Artemisia, Chenopodioideae and Poaceae developed in the plain; Ceratopteris and aquatic plants flourished in and around the lake; and coniferous-broadleaved mixed forest dominated by Pinus and Quercus developed in the western mountains, with an increased forest cover. During the middle-late Holocene, when the climate was relatively mild and dry, grassland vegetation dominated by Artemisia, Chenopodioideae and Poaceae persisted in the plain; and coniferous-broadleaved mixed forest dominated by Pinus developed in the western mountains, with a high forest cover age.
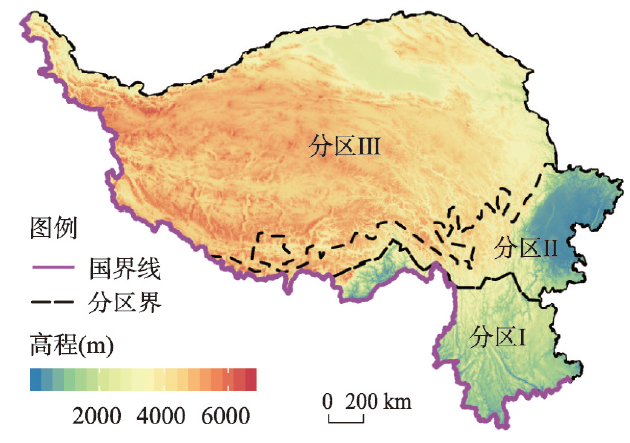
The Tibet Plateau and the Hengduan Mountains are located in the southwest of China, being featured by intricate landforms and deep valleys with large slopes. Due to the impacts of fluvial-induced erosions and intense geologic processes, frequent occurrences of geological disasters such as landslides, collapses and debris flows can be observed and are challenging regional sustainable development. Here we developed a random forest (RF) model to identify the geological disaster points within each sub-region. We found that the accuracies of RF models in sub-regions were all larger than 80% and can reach 91%, which evidenced modelling performance of the developed model in this study in identification of the locations with frequent occurrences of geological disasters. Meanwhile, the locations and/regions with frequent occurrences of geological disasters were found mainly in the southern part of the Hengduan Mountain area, and northeast and south parts of the Tibet Plateau, where 87% of all disaster events ranged from small scale to middle-scale. Specifically, from the view of sub-region, areas with frequent occurrences of geological disaster were 17.5
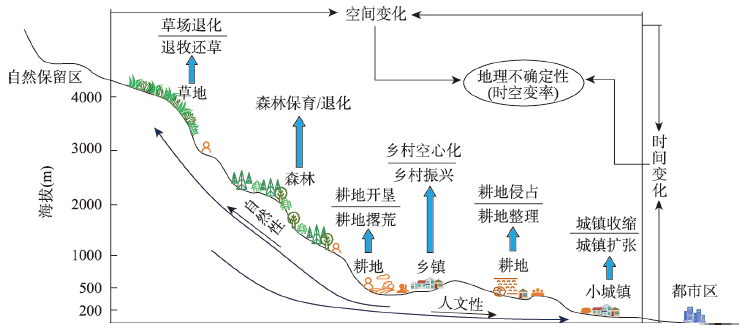
Regionalization, spatiotemporal differentiation and uncertainty are featured in the process of humanistic-natural interaction in Chinese mountain areas, making them typical mountainous transitional geospace (MTGs). Quantitative identification of MTGs types and consequent differentiation characteristics analysis can build a solid decision-making foundation for high-quality development of land space in mountainous areas under the background of rural revitalization strategy of China. This study introduced a spatiotemporal variability index based on the concept of geographic uncertainty, which was designed to work out identification, delineation and division of MTGs, and then it used the Geodetector to analyze the driving factors spectrum of the geographic spatiotemporal variability in each division of MTGs. It concludes the following points: (1) The total area of MTGs was 238.32×10⁴ km2 (about 1/4 of the land surface area of China), with MTGs variability index in a decreasing trend from the First Gradient Terrain to the Third Gradient Terrain of China. (2) MTGs in China could be divided into 12 segmentations, of which the area of the Kunlun-Qilian Mountains subzone is the largest. (3) Humanistic driving factors had the strongest analytical power on spatiotemporal variability of population density and land-use intensity. The analytical power of the basic topographic variables, such as DEM, DEM_Relief, DEM_Slope and Topography index, had significant analytical effect on the spatiotemporal variability of vegetation coverage (NDVI) and MTGs geographic uncertainty, and the analytical driving force of altitude and night lighting brightness was the strongest among all the driving factors. (4) Generally, the spatiotemporal dynamics of human factors, such as the time variations and the spatial heterogeneities of humanistic geographical features, had a significant shaping effect on MTGs in the southeastern China, whereas in the northwestern China MTGs was mainly driven by the temporal variations of natural geographical features and the spatial heterogeneities of humanistic geographical features. This research provides an insight for quantitative analysis of geographical uncertainty and diversity in MTGs of China, and reveals the regionality of the human-nature interaction.
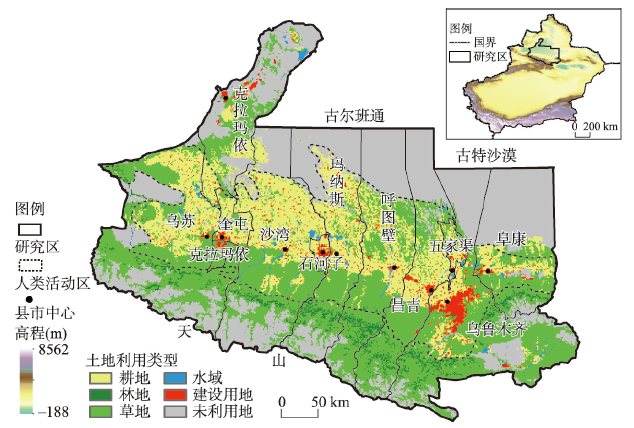
Research on the spatiotemporal correlation between the intensity of human activities and the temperature of earth surfaces is of great significance in many aspects, including fully understanding the causes and mechanisms of climate change, actively adapting to climate change, pursuing rational development, and protecting the ecological environment. The north slope of Tianshan Mountains, located in the arid area of northwestern China, is a typical area that is extremely sensitive to climate change. This paper takes the area as an example to retrieve the surface temperature of the mountain based on MODIS data, characterized by the effect of the intensity of human activities on the night light, population distribution and land use. The evolution characteristics of human activity intensity and surface temperature in the study area from 2000 to 2018 were analyzed, and the spatiotemporal correlation between them was further explored. It is found that: (1) The average human activity intensity (0.11) has kept relatively low since the beginning of the 21st century, and it has been slowly rising in a stepwise manner (0.0024 a-1); in addition, the increase in human activity intensity has lagged behind that in construction land and population by 1-2 years. (2) The annual average surface temperature in the area is 7.18 ℃ with an obvious growth. The rate of change (0.02 ℃·a-1) is about 2.33 times that of the world. The striking boost in spring (0.068 ℃·a-1) contributes the most to the overall warming trend. Spatially, the surface temperature is low in the south and high in the north, due to the prominent influence of the underlying surface characteristics, such as elevation and vegetation coverage. (3) The intensity of human activity and the surface temperature are remarkably positively correlated in the areas with intense human activity, showing a strong distribution pattern in the east section and a weak one in the west section. The expression of its spatial differentiation and correlation is comprehensively affected by such factors as scopes of human activities, manifestations, and land-use changes. Vegetation-related human interventions, such as farming and forestry planting, urban greening, and afforestation, can effectively mitigate the surface warming caused by human activities. This study not only puts forward new ideas to finely portray the intensity of human activities, but also offers a scientific reference for regional human-land coordination and overall development.
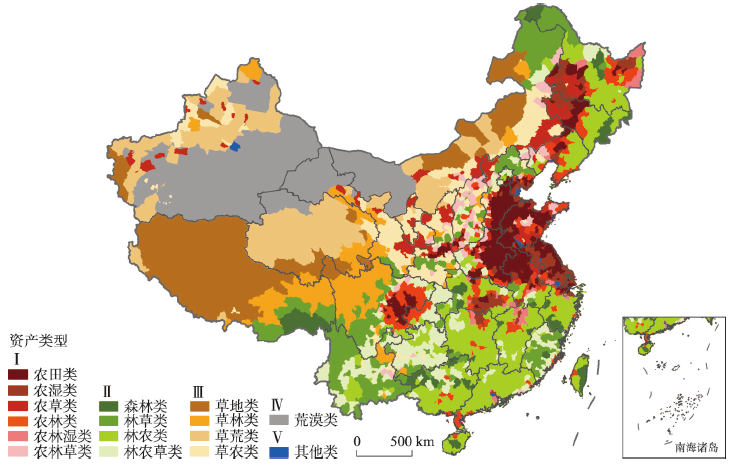
The capitalization of ecological resources and ecological asset is an important way to realize the transformation to "Lucid Waters and Lush Mountains are Invaluable Assets". The accounting of ecological asset and its gains and losses is conducive to the effective protection, scientific management and sustainable utilization of the ecosystem. Based on relevant domestic and foreign research on ecological asset, this paper developed a technical accounting system of ecological asset and its gains and losses at the county level, analyzed the spatial and temporal variations of ecological asset in China from 1990 to 2018, and then identified the influencing factors which caused the gains and losses of ecological asset. The optimization and promotion paths were finally proposed for counties with different types of ecological resources, gain and loss status and varied driving factors. The results showed that about 45% and 37% of counties were dominated by farmland and forest ecological resources, respectively. From 1990 to 2018, the quality of county-level ecological stock asset showed an increasing trend with fluctuation, while the change trend of ecological flow asset was significantly different, showing decreased water conservation volume in nearly 70% of the counties. The number of counties with the gains and losses of ecological flow asset accounted for approximately 44% and 37%, respectively. The spatial distribution of the gains and losses of ecological flow asset showed the same segmentation characteristics as "Hu Line", that is, the counties in the vastness of northwest China experienced significant gains, while decreases were widespread in eastern and southern China. Over the study period, the change of ecological asset in more than 70% of the counties in China was driven by climate change and human activities. The average impact degree of human activities affecting the gains of ecological asset in counties was about 80%, while that of climate change affecting the losses of ecological asset in counties was about 60%. Through comprehensive analyses, counties in China can be classified into five types, which consist of climate change mitigation, climate change adaptation, ecological resources restoration, ecological resources protection, and ecological resources management. And differentiated optimization and promotion paths can be adopted to achieve the gains of ecological asset.
Key ecological functional zones provide continuous ecosystem services and play an indispensable role in ensuring national ecological security and social sustainable development. From the perspective of ecosystem service trade-off and synergy, this paper discusses and analyzes the protection characteristics of key ecological functional areas. The data includes multi-source datasets such as ecosystem types, meteorological data, elevation data and soil data from 2000 to 2019. Methods of the dynamic degree of ecological spatial change, ecosystem service model and partial correlation coefficient were used for evaluation and analysis. This research selects the Qinling-Daba (Qinba) Mountains region with high similarity of natural and geographical conditions as the reference unit, takes ecosystem supply services and regulation services as the core content, and analyzes the trade-off and synergy relationship of ecosystem services based on the quantitative analysis of the characteristics of ecological spatial changes from 2000 to 2019. The results showed that the ecological status of the study area gradually improved, and the ecosystem tended to be stable after the delimitation of key ecological functional zones. The service capacity of key ecological functional zones is gradually increasing, and the average net primary productivity, total soil conservation and total water conservation are higher than those outside the key ecological functional zones by 25.95 gC/m2, 5.81×10⁸ t and 24.95×10⁸ m3, respectively. The synergy between soil conservation services and ecosystem supply services was positively correlated with the improvement of ecological status. Due to the impact of precipitation, the synergistic relationship between water conservation services and ecosystem supply services after 2010 became worse. Overall, the designation of key ecological functional areas in the Qinba Mountains has driven the "quantitative growth" of regional ecological space and the "qualitative improvement" of ecosystem services. However, the "synergy" of the relationship between ecosystem services is not obvious, and even changed to "trade-off", which requires the country to make more targeted ecosystem protection and management decisions in the future, and improve the overall benefits of ecosystem and support the sustainable supply of regional ecosystem services.
