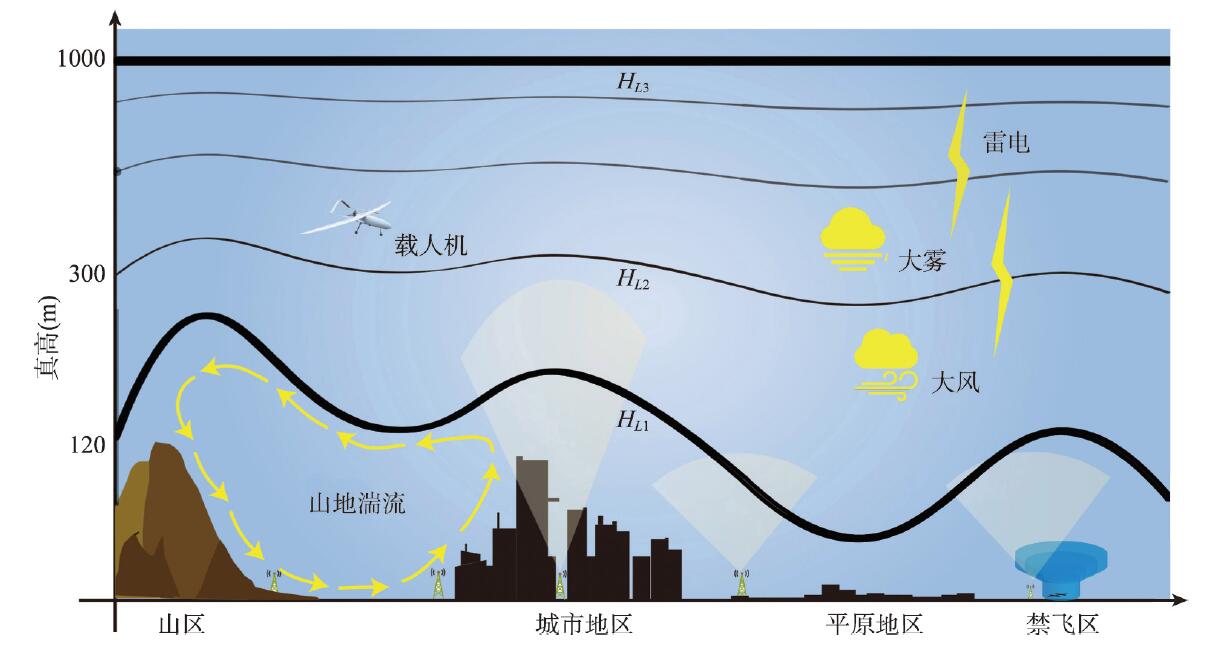
With the development of hardware techniques and the decrease in equipment costs, unmanned aerial vehicle (UAV) has been widely applied in various socio-economic fields. However, there have been relatively few studies on low-altitude airspace resources as the operational carrier of UAVs. In this study, from the perspective of geography, the key issues related to the research of low-altitude airspace resources for UAV applications are discussed. Firstly, it is theoretically defined that low-altitude airspace is an important kind of natural resources with natural, social, and economic attributes, which should be included in the national natural resource development and utilization system; Secondly, we review the latest UAV applications based on the low-altitude airspace resources, categorize their constraints to utilize resources from natural and social aspects, and point out that the intervention of geography will speed up the development and utilization process of low-altitude airspace resources. Finally, this paper constructs the low-altitude airspace resource measurement index composed of three categories and nine sub-categories, and proposes four basic principles of low-altitude airspace resource measurement of "non-conflict utilization of resources, safety guarantee, benefit priority, and fairness", and thus forming a theoretical model of low-altitude airspace resource measurement with the three basic elements of national scope (S), true height (H) and time (t). This paper explores and discusses the low-altitude airspace resources from the perspective of geography, which will promote the interdisciplinarity of geography and aviation to some extent and the sustainable utilization of low-altitude airspace resources.
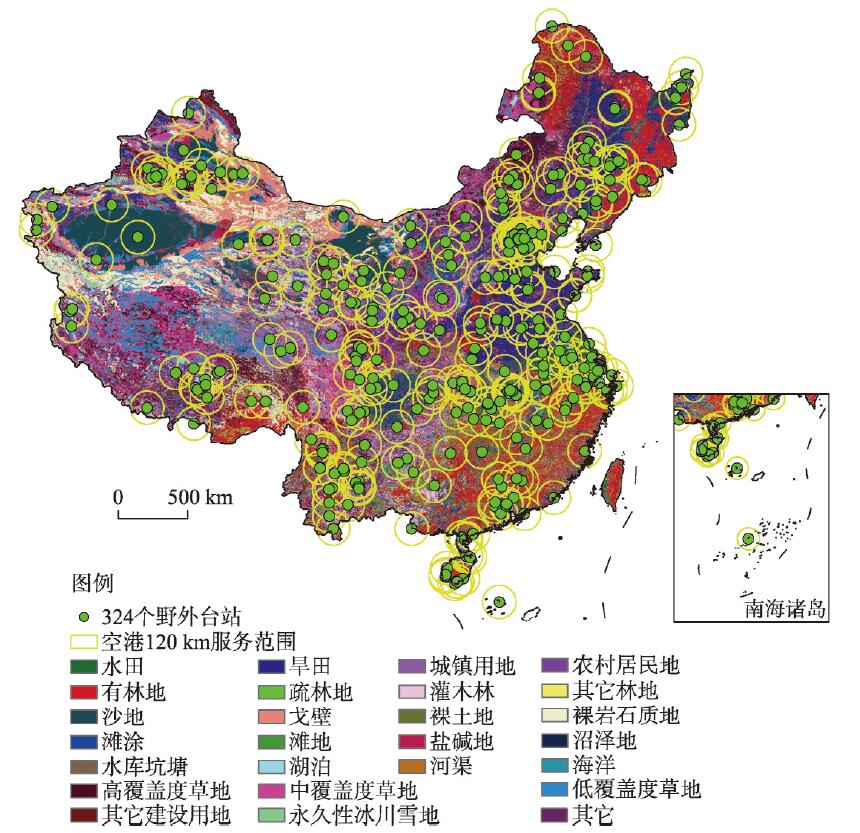
Aiming at the requirement to use unmanned aerial vehicle (UAV) data to verify common products from China High-resolution Earth Observation System (CHEOS), this research examines the distribution of UAV airports using the existing ecological observation stations. Firstly, to comprehensively consider the factors affecting the satellite products, a physical model of the geographical background coverage was proposed. Secondly, a maximal geographic background model is designed based on the improved the coverage model with geographic backgrounds, and the number of UAV airports was determined using the sample size determination method of random sampling. Then, the maximal geographic background covering model and a maximal area covering model were used to study the distribution of UAV airports. Finally, the results of the airport layout under the two models were compared, and MODIS EVI (Enhanced Vegetation Index) data products were used to verify the results. The results showed that for a limited number of airports (n = 60), the geographical background coverage of the service areas of the airports selected by the maximal area coverage model was 26.66%, which represents 70.37% of China's land area. The geographical background coverage of the service areas of the airports selected by the maximal geographical background covering model was 38.32%, which represents 73.36% of China's land area. The layout of the UAV airports selected by the maximal geographic covering model is better than that selected by the maximal area covering model. The results can lay a foundation for the design of an unmanned aerial vehicle observation network for the verification of common products from CHEOS.
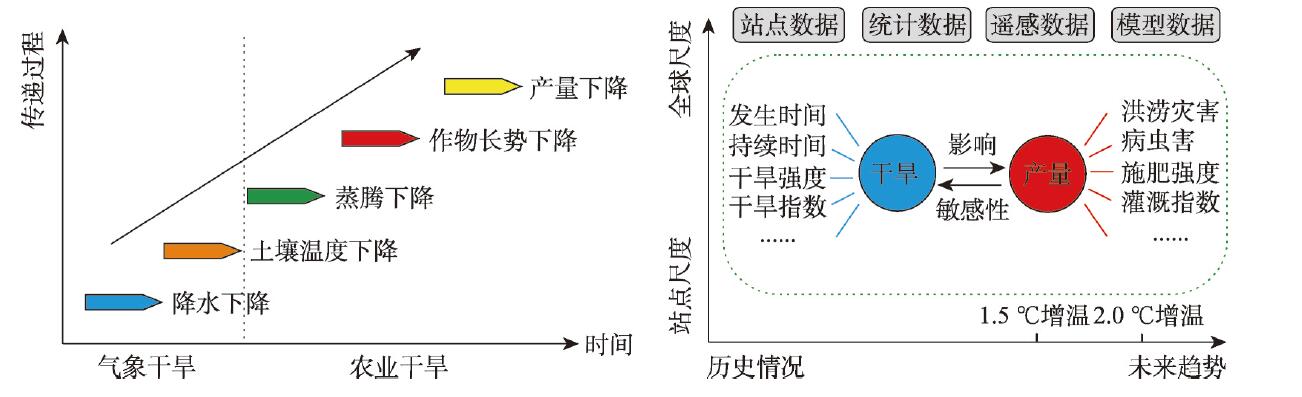
Food security, one of key components of national security, is a top priority for human survival and social development. In this study, we first sought to determine the influencing factors of crop yields and the process of drought impacts on crop yields. We then systematically reviewed the effects of droughts on major global crop yields from four aspects: field control experiments, statistical models, crop growth models, and remote sensing inversion models. Recent progress in crop yield impact assessment reveals that the current research has changed from single-hazard to multi-hazard, from single target to multiple targets, and from statistical models to a comprehensive model. A bibliometric analysis shows that the volume of research on drought impacts on crop yields has increased exponentially, and the related research theme has undergone a transformation from traditional research on crop water stress to comprehensive research on crop drought impacts and adaptation, reflecting the continuous deepening and integration of research perspectives. Agriculture, plant sciences, and environmental sciences are the three main disciplines in research on drought impacts on crop yields. We need to strengthen the application of geographical thinking, that is, systematic thinking concerning multiple factors and multiple scales to study the coupling of crop yields and water resources in the future. Finally, we suggest the following four priority areas for future research in consideration of the problems and challenges of the existing research: establishing a multi-source database of drought impact on crop yield, revealing the key process and mechanism of drought impacts on crop yields, developing a coupled macro and micro process crop growth model, and establishing a comprehensive monitoring platform system for crop yields and food security. This will help ensure sustainable agricultural development and global food security by improving monitoring, early warning, and scientific management of the impacts of droughts on crop yields.
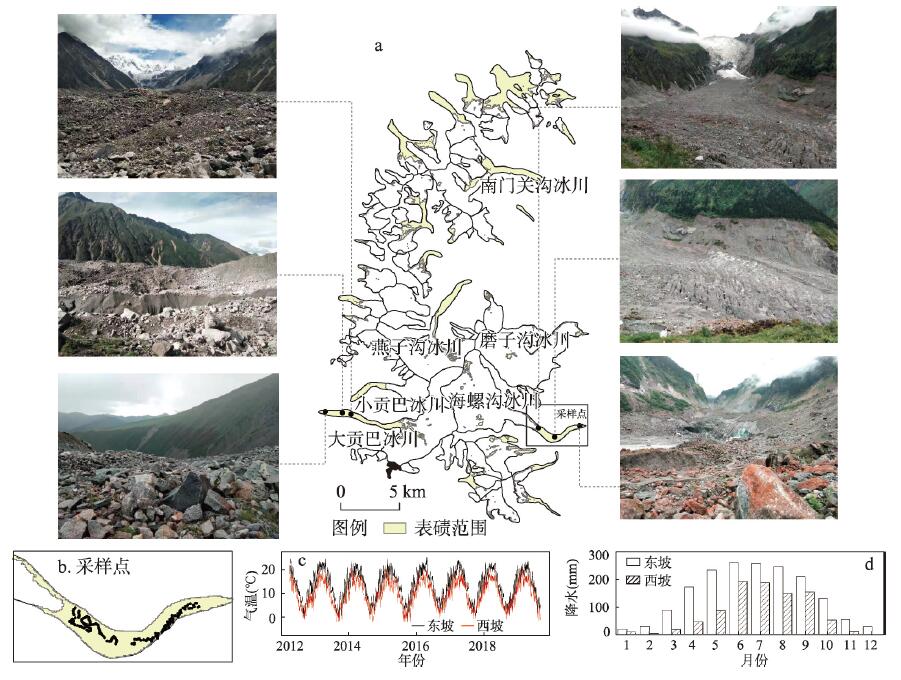
Debris-covered glaciers are widely distributed in western China. Supraglacial debris lying at the atmosphere-glacier interface plays an important role in the air-ice energy flux and thus influences the underneath ice melt rate. Varying glacier debris thickness will have influence on the mass balance gradient of the debris-covered glacier, the development of ice cliff, ponds and drainage systems, as well as on the downstream runoff process. Using Landsat TM/TIRS images between 1990 and 2019, this study extracted the debris coverage and estimated the thickness changes of the debris-covered glaciers in the Mount Gongga by using a physically-based thermal conductivity method. We found that: (1) The debris coverage of glaciers in the study area totally expanded by 43.824 km2, among which the Hailuogou Glacier expanded 2.606 km2, Mozigou Glacier 1.959 km2, Yanzigou Glacier 1.243 km2, Dagongba Glacier 0.896 km2, Xiaogongba Glacier 0.509 km2 and Nanmenguangou Glacier 2.264 km2. Annual expansion rates of their debris covered area are 3.2%, 11.1%, 1.5%, 0.9%, 1.0% and 6.5%, respectively. (2) In addition to debris cover area expansion, we found thickening debris layers, with glacier wide average debris thickness increasing by 5.2 cm, 3.1 cm, 3.7 cm, 6.8 cm, 7.3 cm and 13.1 cm for the above six mentioned glaciers, respectively. (3) Compared with glaciers on the east slope, debris-covered glaciers on the west slope of the Mount Gongga generally have higher debris cover rate but experienced lower debris cover expansion and lower terminal retreat rate during the past decades.
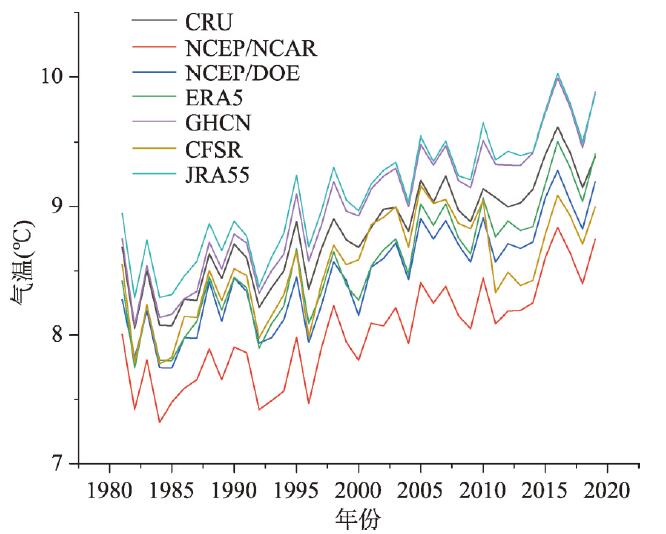
The determination of temperature changes in major countries since the 1980s is a key scientific method to reveal the spatial difference of global temperature change and to achieve a common global climate change. Based on seven sets of reanalysis data, this paper analyzed the spatio-temporal characteristics of global temperature change and the temperature change of major countries from 1981 to 2019 by using climate tendency rate and spatial interpolation. The results revealed that the global land air temperature in the stydy period varied at a rate of 0.320 °C/10a, exhibiting a significant increasing trend, with a cumulative increase of 0.835 °C. The mean annual land air temperature in the northern and southern hemispheres varied respectively at rates of 0.362 °C/10a and 0.147 °C/10a, displaying significant increasing trends, with cumulative increases of 0.828 °C and 0.874 °C,respectively. The global land surface air temperature displayed an increasing trend, with more than 80% of the land surfaces showing a significant temperature increase. Across the globe, the change rates of annual mean air temperature were higher at high latitudes than at middle and low latitudes, with the highest change rates in regions at latitudes of 80°N-90°N, followed by the second-highest rates in regions from 70°N-80°N, and the third-highest rates from 60°N-70°N. Greenland, Ukraine, and Russia had the highest increase rates of annual mean air temperature, especially Greenland, which experienced a temperature tendency rate of 0.654 °C/10a. The regions with the lowest increase rates of annual mean air temperature were mainly in New Zealand and areas on or near the equator including South America, Southeast Asia and Southern Africa, where the temperature tendency rates were < 0.15 °C/10a. Among the 146 countries surveyed in this paper, 136 countries (93%) showed a significant warming trend, 10 (6.849%) had no significant change in temperature, and only 3 countries showed a downward trend. Among them, since the 1980s, there are 4, 34, and 68 countries with global warming above 2.0 ℃, 1.5 ℃, and 1.0 ℃, respectively, accounting for 2.740%, 23.288% and 46.575% of the countries concerned in this study. This paper held that there had been no global warming hiatus since 1998.
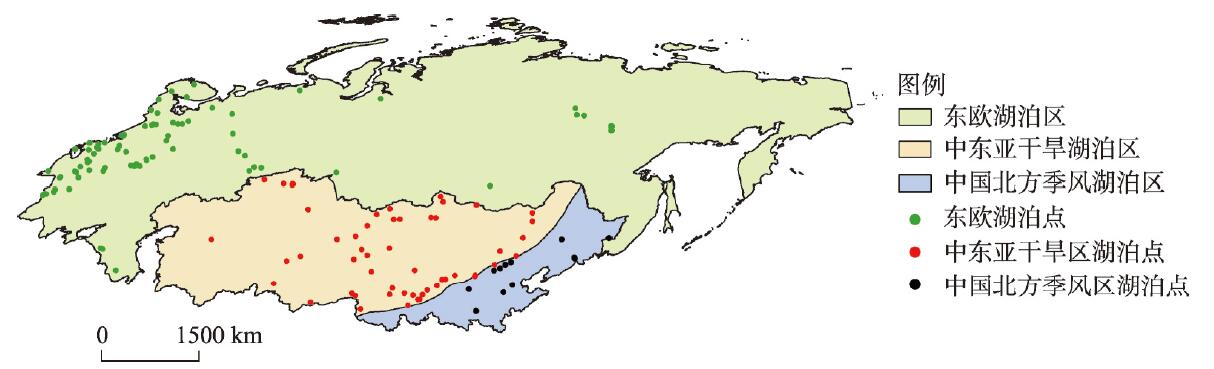
Fluctuations of lake level are good indicators of broad-scale wetness and thus can reflect the changes in the moisture balance (precipitation minus evaporation), which has been an important index in reconstructing the paleoclimate of late Quaternary. Spatial and temporal patterns of humidity changes since Last Glacial Maximum (LGM, 18 cal. ka BP) have been reconstructed for central and northern Eurasia based on the compilation of 149 lake records from the database documentation of the Soviet Union and Mongolia as well as China. The study areas were divided into three regions according to the climate differences, geographic locations and existing research results, that are, the Eastern Europe lake region, the arid Central Asian lake region and the East Asian monsoon lake region of northern China. A three-category scheme (collapsed coding) was used here to reclassify different lake statuses in order to standardize the lake level data over the past 18000 years. Then we used five-scheme status anomaly within each 1000-yr interval and the present to map and analyze the spatial patterns of five levels, namely, much drier, drier, no change, wetter and much wetter than today. The results demonstrated that moisture conditions have experienced diverse changes since LGM in different lake regions. There were relatively few lake records in Eastern Europe before late glacial period and the records increased substantially since the Holocene. Arid climate prevailed during the early Holocene in Eastern Europe, and relatively wet conditions dominated the middle and late Holocene. The arid Central Asian lake region as a whole experienced a wet climate from the LGM to the middle Holocene and turned dry during the late Holocene. But the patterns of climate change differed from lake to lake. In the East Asian monsoon region of northern China, the wet period was mainly observed in the early and middle Holocene and then the climate became drier in the late Holocene. The comparative analysis revealed that the eastern part of Eastern Europe lake region presented a wet trend with the retreat of the Scandinavian ice sheet during the early Holocene and the humidity reached a maximum in the mid-Holocene associated with cyclone activity on the downstream limb of the summer anticyclone. However, the western part of Eastern Europe experienced drier conditions in the early Holocene due to the development of a strong thermal high-pressure cell over central and western Siberia, and then returned to wetter conditions in the mid-Holocene as the result of the penetration of the Asian monsoon. The relatively wet condition in the arid Central Asian lake region during the glacial period was mainly produced by the precipitation brought by the westerlies and the significant decrease in evaporation, while the wet mid-Holocene was probably related to the strengthening of summer monsoon precipitation. The regional climate may have been mainly controlled by East Asian monsoon in the monsoon region of northern China.
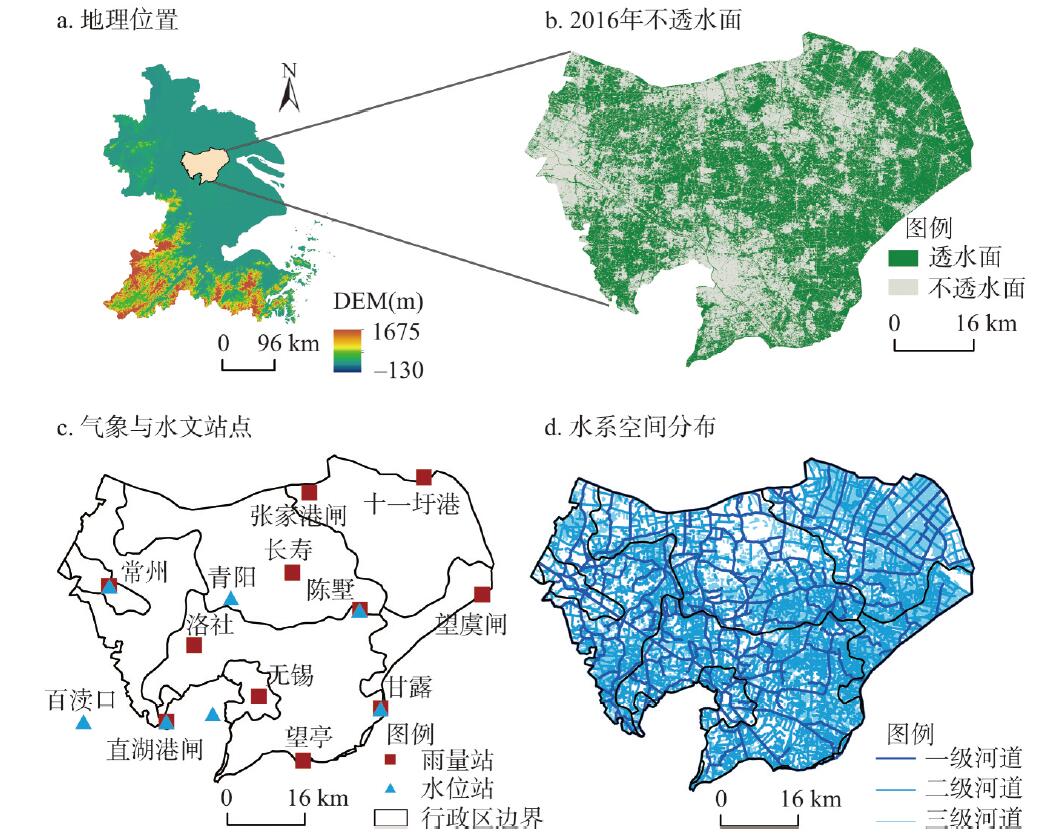
Variations of hydrological connectivity are regulated by sluices in a plain river network, which increases the difficulty of studying the variations of hydrological connectivity. To this end, a reasonable indicator (Sluice Longitudinal Connectivity Index, SLCI), composed of sluice passage probability, passage efficiency, and cumulative effects of sluices, is proposed to detect the changes in the longitudinal connectivity in flood and non-flood seasons. The indicator considers different scheduling rules of sluices and its calculation unit is grid. The results in a grid scale could reveal the hydrological connectivity at the micro scale, which can present a more detailed spatial heterogeneity of the connectivity relative to the units of river basin or water conservancy region. Based on this, the Wu-Cheng-Xi-Yu region (WCXY) in China was taken as a study region. And the spatial heterogeneity of the hydrological connectivity was detected by the Getis-Ord Gi* method. In the WCXY region, the average SLCI for the non-flood season is 0.66, while the average SLCI for the flood season is 0.50. The spatial agglomeration of connectivity in the non-flood season has a 5% spatial range larger than that in the flood season. Specifically, the values of high connectivity agglomeration during non-flood and flood seasons are 0.93 and 0.87, respectively; and the values of low connectivity agglomeration during non-flood and flood seasons are 0.25 and 0.16, respectively. Our method would provide a theoretical support for relevant departments to take measures of the river system construction in the Yangtze River Delta and a new idea for the assessment of hydrological connectivity in the plain river network region.
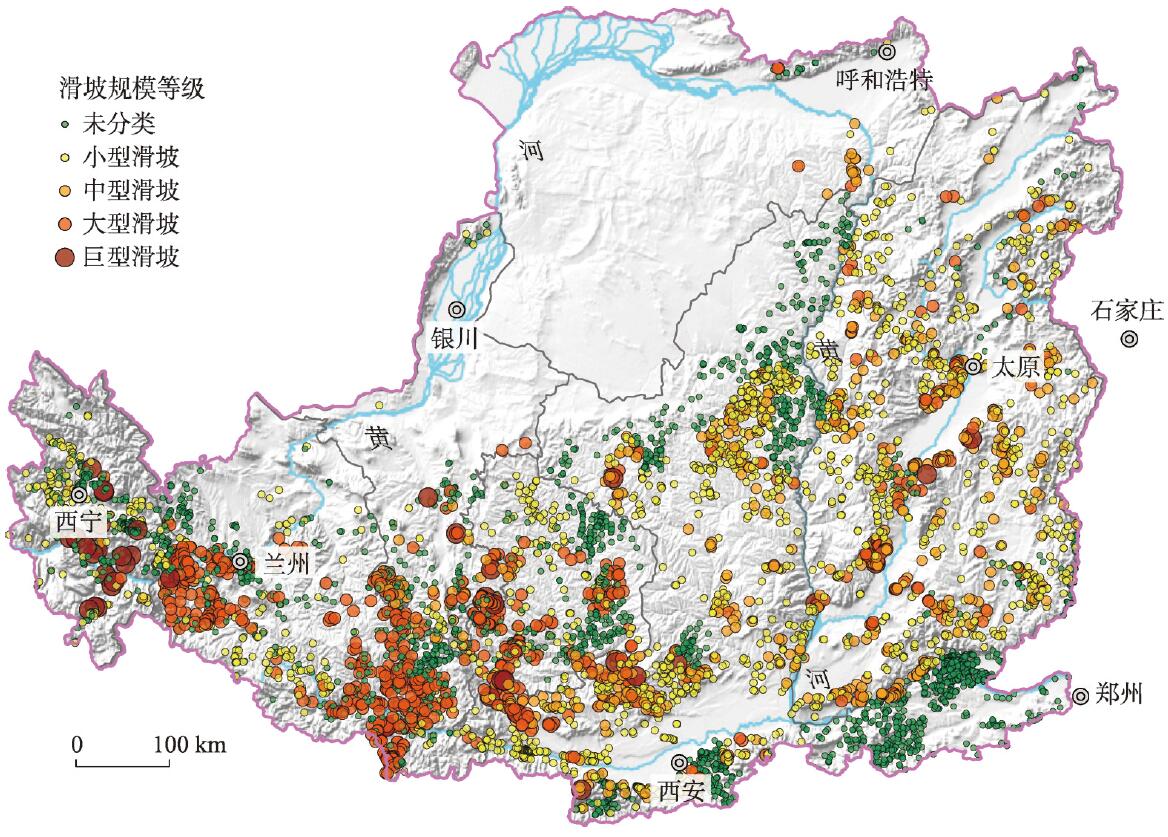
The lack of high-resolution terrain and image data has become a major bottleneck for geoscientists to study surface phenomena, features and processes. In recent years, the development of low-cost UAV equipment and photogrammetric technology makes it possible to obtain high-resolution data in the field of geoscience, which has greatly improved the accuracy and efficiency of geological disaster field survey and disaster cataloging. In this study, a database including 307 loess landslides was constructed through field investigation of UAV and remote sensing image interpretation. On this basis, through digital terrain analysis (DTA) and mathematical statistics, we summarize the distribution rule of loess landslides sample data, discuss the influence of terrain on the distribution of loess landslides is discussed, describe the influence of the relative height difference of terrain on the longest sliding distance, landslide perimeter, and landslide area, and propose formulas for quickly estimating landslide scale based on traditional empirical formula fitting. The results show that: (1) There are obvious regularities in the scale-frequency distribution of landslides. The frequency of loess landslides with different maximum lengths, maximum widths and perimeters shows a positive skew distribution, while the frequency distribution of landslides with different areas presents a power function pattern. (2) Terrain plays a significant role in controlling the development of loess landslides. The quantity of landslides on slope units with different height differences, average slopes, slope forms varies greatly. (3) The fitting curves of the relative height difference and the longest slipping distance, or landslide's perimeter, or landslide's area follow the power law distribution well. However, the fitting effects of different terrain areas are different. The loess hilly area has the best fitting effect, followed by the whole Loess Plateau, and the loess tableland area is the worst. (4) The rapid prediction models of loess landslide scale established in this study provide empirical formula support for landslide investigation.
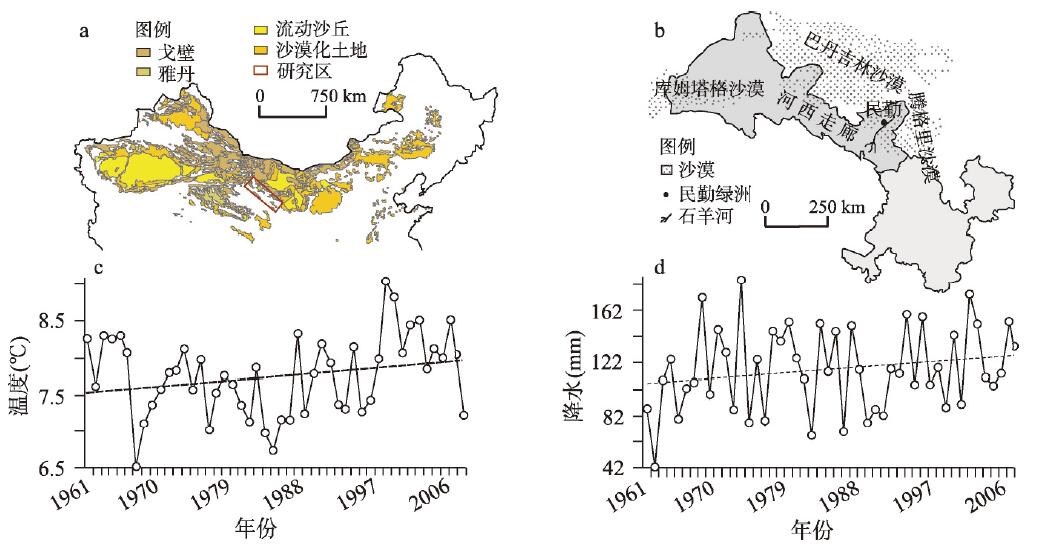
The history of dune landform changes and dust activity at mid-latitudes is a good archive for exploring environmental changes and related landscape response. In this study, the dynamic changes, material sources, dust activity history and the influencing factors of typical sand dunes in the Hexi Corridor were comprehensively analyzed from the aspects of aeolian geomorphology, grain-size sedimentology, geochemistry and climatology. The results show that in the past half century, the typical crescent-shaped dunes and chains of crescent-shaped dunes in the study area have moved or swayed greatly, with an average speed ranging from 0.8 m/a (Dunhuang) to 6.2 m/a (Minqin). The dynamic changes of sand dunes are mainly affected by annual precipitation, annual average wind speed and annual gale days, which indicates that climate is the primary influencing factor of dune landform changes. The three-stage grain-size curve model of dune sands is obviously different from that of gobi sediments (two-stage), revealing the "immaturity" of the latter in sedimentology, while the former has experienced efficiently aeolian differentiation and non-local origin. The comprehensive evidences of paleogeography, sedimentology and geochemistry reveal that the source materials of sand dunes are mainly alluvial/proluvial and palaeo-fluvial sediments, including clastic sediments in the denudation/erosion zones of the north and south piedmonts. Indicators such as the proportion of surface fine particles, the coverage of surface salt crusts, and the content of erodible sandy materials indicate that the western gobi areas are not the main source areas of wind-blown dust in the central and eastern parts of the Hexi Corridor. The spatial distribution of the movement direction of sand dunes is similar to that of the regional dominant wind direction, which indicates that the difference in the dynamic evolution of dune landforms between the east and west of the Hexi Corridor should be controlled by the regional-scale wind system, that is, controlled by the dynamic mechanism rather than the difference in material sources. The warming and humidification of the Hexi climate is a synchronous response to the global warming and the strengthening of the Asian Summer Monsoon. It is also the main reason for the reduction of dust storms in the study area, which means that a potential inverse desertification process exists in the Hexi Corridor during the same period and it is also controlled by climate change. However, the process of desertification in the oasis areas during the period is caused by groundwater fluctuation affected by human activities.
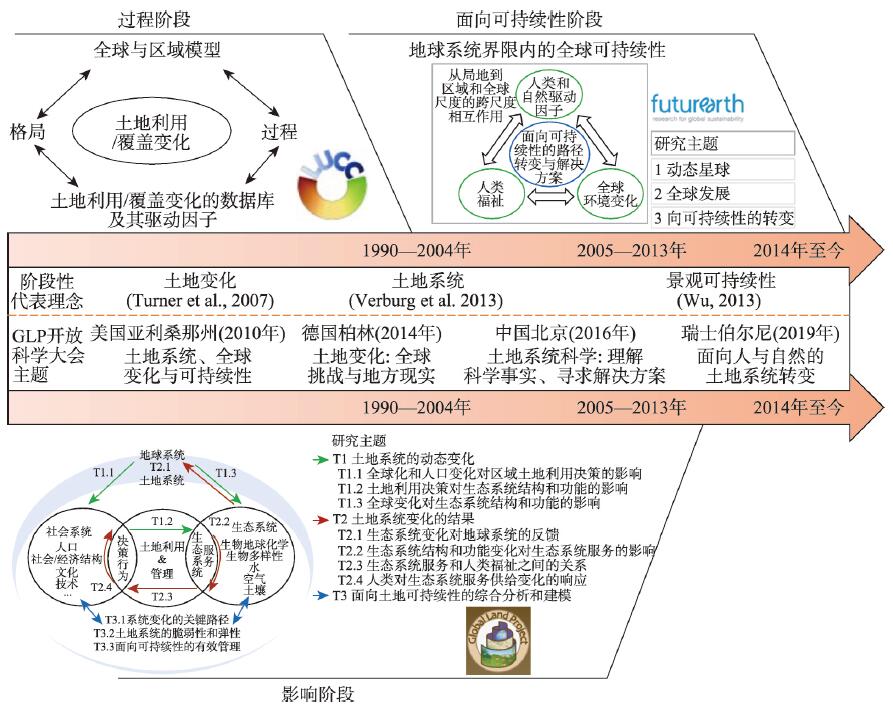
Land use/cover change (LUCC) is the foundation and frontier for integrating multiple??land surface processes. This paper aims to systematically review LUCC research from 1990 to 2018. Based on qualitative and quantitative analyses, we delineated the history of LUCC research and summarized their characteristics and major progress at different stages. We also identified main challenges and proposed future directions for LUCC research. We found that the number of publications on LUCC research and their total citations grew exponentially. The research foci shifted from the process of LUCC during 1990-2004 to the impact of LUCC during 2005-2013, and then to the sustainability of LUCC from 2014 onwards. Currently, LUCC research is facing theoretical, methodological and practical challenges ranging from integrating the framework of sustainability science, adopting emerging technologies to supporting territorial spatial planning. To move forward, LUCC research should be closely integrated with landscape sustainability science and geodesign, and take the leading role in territorial spatial planning to achieve the related Sustainable Development Goals.
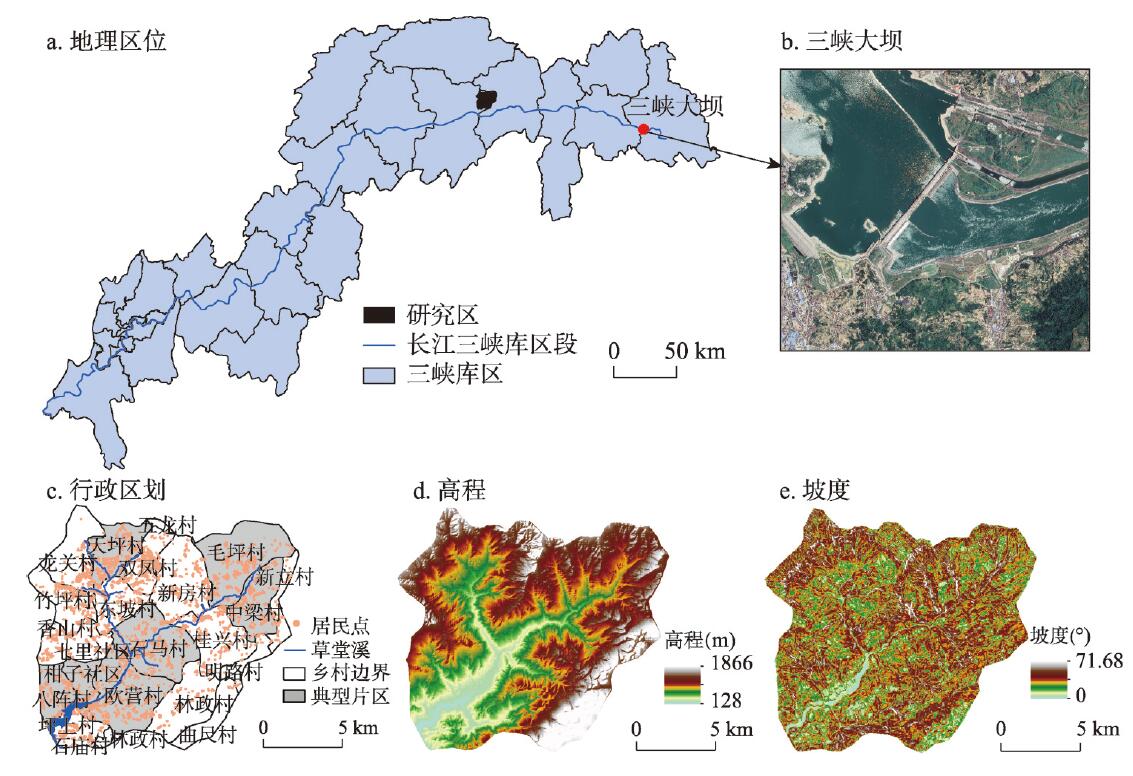
Analyzing the agricultural landscape pattern in mountainous areas is conducive to clarify the dynamic change and development direction of the agricultural landscape, and is of great significance to rational planning and management of agricultural land. This paper proposes a theoretical framework for agricultural landscape pattern transformation in mountainous areas, and conducts an empirical study in the Caotangxi watershed, Three Gorges Reservoir Area (TGRA). Transformation characteristics of agricultural landscape pattern during 2000-2018 represented by sloping farmland, abandoned land, and orchard are analyzed from a holistic-local perspective. The research findings show that the orchard expanded along river valleys, and the abandoned land expanded at high elevations in the case study, leading to a reduction in sloping farmland. Therefore, there are differences in the regional landscape at the holistic and local levels. In other words, this phenomenon enhances the region's holistic landscape diversity but causes the fragmentation and aggregation of landscape patches in local areas. Meanwhile, the agricultural landscape pattern transformation within the farmers’ farming range in the study area is mainly manifested in four modes, including sloping farmland-orchard conversion, comprehensive conversion, partial abandonment and complete abandonment. Different transformation modes reveal different development stages of the mountainous agricultural landscape pattern. Generally, driven by socioeconomic factors in mountainous areas of TGRA, the agricultural landscape pattern transformation is bidirectional. The attribute is expressed as the transformation from the traditional grain-planting landscape with even distribution to the ecological-economic win-win orchard in valleys and the transformation from sloping farmland to abandoned land in high-elevation areas. Overall, the results reveal the uniqueness of agricultural landscape pattern evolution in China's mountainous areas in recent decades, which has enlightenment for the in-depth understanding of rural land use and agricultural ecosystems in mountainous areas of the reservoir area, and the improvement of rural development and ecological environment.
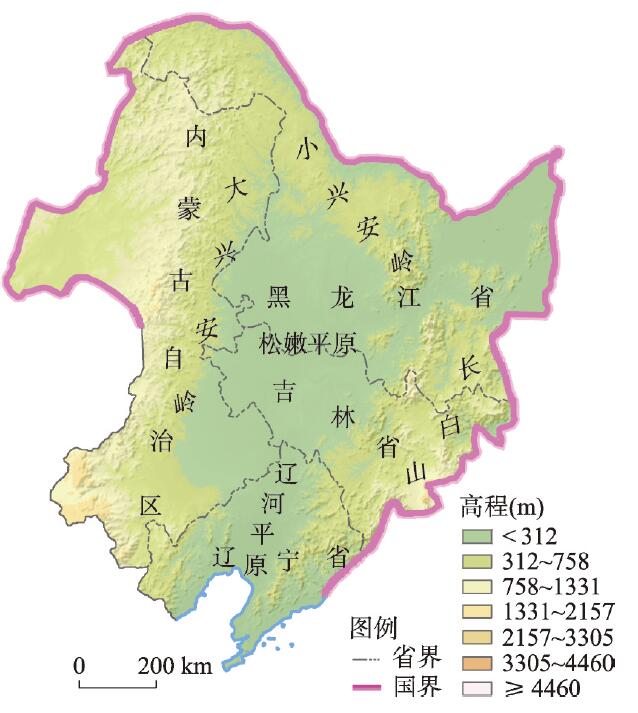
The soil freeze-thaw cycle plays an important role in land surface processes. Repeated freeze-thaw cycles can have profound effects on land-atmosphere energy exchange, surface runoff, plant growth, ecosystems and soil carbon & nitrogen cycles. Using spatial analysis functions of geographical information system and python programming language, this paper analyzed the spatial distributions and temporal variations of soil freeze-thaw state in Northeast China based on the ERA5-LAND hourly soil temperature dataset for the period 1981-2019. The results suggest that the start dates of the four soil freeze-thaw periods for the near-surface layer are mainly determined by latitude and topography. The start dates of freeze-thaw transition period in spring (SFTTP) and complete thawing period (CTP) show a southeast-northwest gradient with later starts in the northwest part, while the start dates of freeze-thaw transition period in autumn (AFTTP) and complete freezing period (CFP) exhibit a latitudinal pattern with earlier starts in the north. For most parts of the study area, the average annual number of days for SFTTP is less than 30, with higher values in the south and west compared to the north and east. The number of days for AFTTP, however, is below 10 per year for most parts of the region, with just a slight difference in the study area. The CTP is the longest compared to the other three periods, varying from 150 days in the northwest to 240 days in the southeast. The CFP, which comes next, ranges from 90 to 180 days per year, presenting a dustpan-shaped spatial pattern with higher values in the north and lower values in the south. Trend analysis shows that with the advance of start date for SFTTP and the delay of start date for AFTTP, the number of days for CTP has increased with a rate of 0.2 d/a. The number of days for SFTTP in the Liaohe Plain, the western part of the Da Hinggan Mountains and the northern part of Hulun Buir Plateau shows a decreasing trend, while in other regions an increasing trend is observed. In the western part of the Da Hinggan Mountains and the northern part of the Hulun Buir Plateau, the CTP starts earlier. The start date of AFTTP is significantly delayed in the Songnen Plain and Changbai Mountains, and the trend for the number of days varies substantially with an increase in the north and a decrease in the south. The start date for CFP occurs later in the vast area of the Northeast China Plain and occurs earlier in the Da Hinggan Mountains, Xiao Hinggan Mountains, Changbai Mountains, Eastern Liaoning Peninsula and Western Liaoning Hills. The number of days for CFP shows a declining trend throughout the study area, especially in the seasonally frozen area located in the central part with an annual decreasing rate of more than 0.2 d/a.
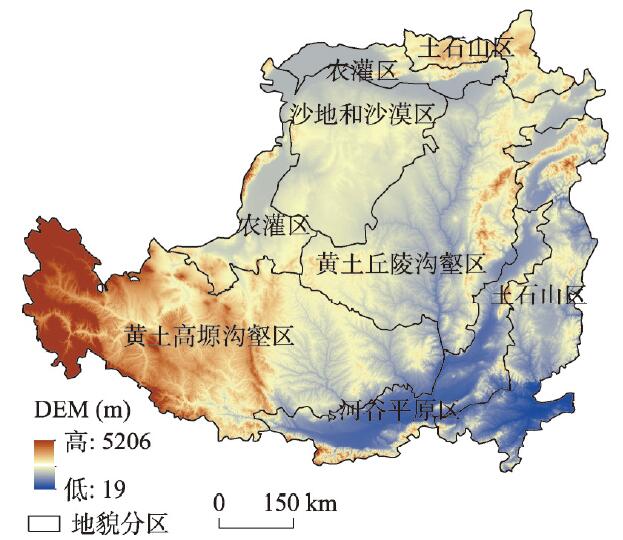
Clarifying the match of the supply and demand of ecosystem services is crucial for promoting regional ecological security and sustainable socio-economic development. This paper takes the Loess Plateau as an example, and applies InVEST model, ArcGIS, GeoDA to analyze the spatiotemporal changes of the supply, demand and their match, which involves crop supply, water conservation, carbon sequestration and soil conservation, aiming to provide a decision-making basis for optimizing the territorial spatial pattern in the Loess Plateau. The results show that: (1) except the supply of water conservation, the supply and demands in other fields are on the rise. The supply of ecosystem services and the demand of soil conservation present the distribution pattern of "high in the southeast, but low in the northwest", while the demands of crop supply, water conservation and carbon sequestration have the distribution pattern of "high in the surroundings, while low in the middle". (2) The supply-demand ratio of various ecosystem services shows a general downward trend. In terms of spatial distribution, the demands of crop supply and carbon sequestration outstrips the supply in densely populated areas, and the supply exceeds the demands in other areas; in the northwest of the study area, the demand of water conservation outstrips the supply, while the supply exceeds the demand in the southeast; the soil conservation service in short supply areas are mainly found in the Ordos Plateau and Haibei prefecture. (3) The supply and demands of various ecosystem services are mainly low-low spatial matching. (4) The spatial distribution of the supply-demand ratio of crop supply, water conservation and carbon sequestration is mainly high-high agglomeration, while the soil conservation is mainly low-low and high-high agglomeration. Except for the enhancement of the spatial agglomeration of the supply-demand ratio of soil conservation service, the others tend to weaken.
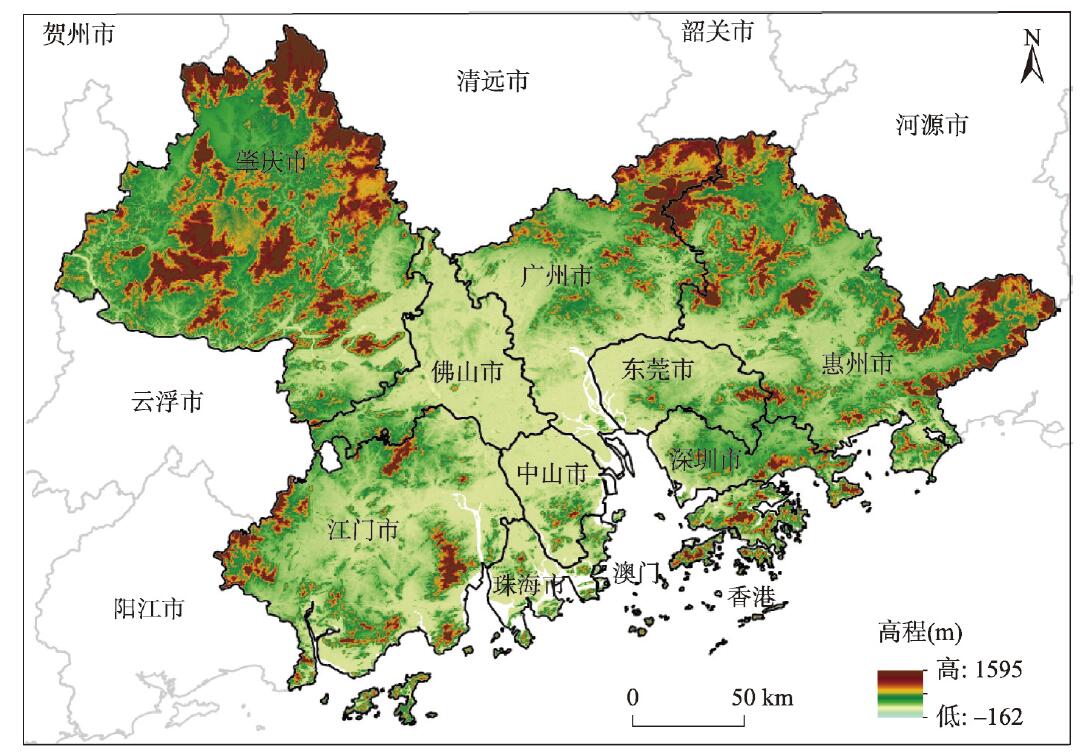
Ecosystem services are the media and channels through which ecological elements, structures, functions and products benefit human society. Regulating the utilization intensity and protection methods of the human society on the ecosystem according to the ecosystem service value (ESV) and its influencing mechanism is of great significance for achieving the sustainable development goals of harmony between man and land. This paper takes the Guangdong-Hong Kong-Macao Greater Bay Area (GBA) as the research object and revises the ESV accounting results based on remote sensing data to more accurately reveal the spatiotemporal evolution characteristics of ESV in the GBA from 2000 to 2015. And, panel quantile regression is implemented to deeply probe the segmentation effects of the factors affecting ecosystem services and to increase the understanding of the influencing mechanism of ecosystem services. The main results are as follows: (1) In the GBA, the value of regulation services accounts for the highest proportion among the four ecosystem sub-services. From 2000 to 2015, the total ESV declined with a decreasing rate, and the values of leading ecosystem service and hydrologic regulation service had the similar variation trend. The decline areas were mainly distributed in the central part of the GBA and areas along the Pearl River Estuary. (2) Elastic index, indicating response of ESV to land use change, reached the peak (1.08) between 2010 and 2015. Changes in land use types per unit area induced greater ESV declines. The spatial distribution of elastic index showed that land use changes brought about more intense ESV variations at the junction of cities from 2000 to 2015. (3) In areas with different ESV levels, influencing factors have different effects. Land use integrity can only promote ecosystem service capabilities in low-ESV areas. The positive effect of temperature on ecosystem service capacity increase with the increase of ESV, which is self-reinforcement of ecosystem. Moreover, the negative effect of economic density on ecosystem service capacity decreases with the increase of ESV, which is self-protection of ecosystem. Combination of the self-reinforcement and self-protection will lead to the ESV gap between the high- and low-ESV areas, and induce the "natural Matthew effect".
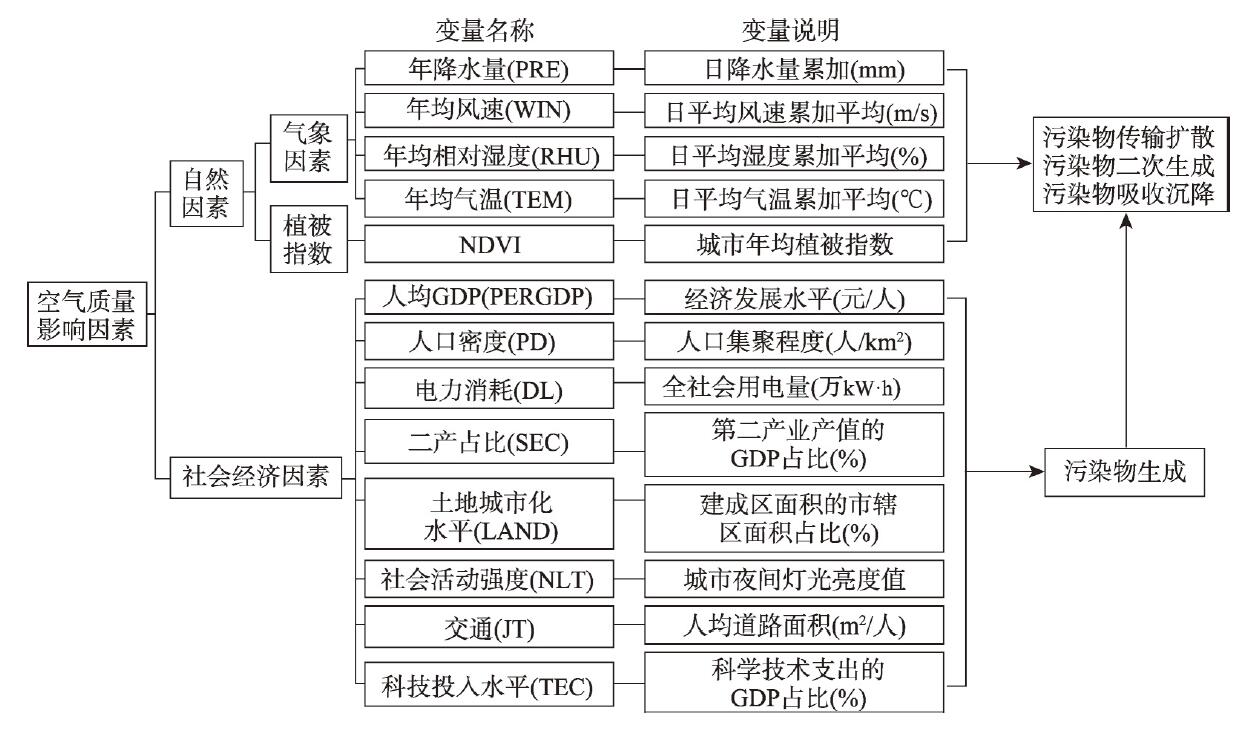
:Research on the spatiotemporal evolution of urban air pollution and its driving forces has great theoretical and practical significance because it helps to deeply understand the mutual feedback mechanism between urban environment and socio-economic system and improve the efficiency of environmental governance. This paper illustrated the regional evolution characteristics of six urban ambient air pollutants, namely, CO, NO2, O3_8h, PM10, PM2.5, and SO2, in 286 sample cities at the prefecture level in China from 2014 to 2019, starting from the year when the "Air Pollution Prevention and Control Action Plan" was fully implemented in China. The interactions between the concentrations of each pollutant were then analyzed on the basis of panel regression models. Furthermore, random forest model was employed to explore the correlations between concentrations of these six pollutants and thirteen natural and socio-economic impact factors so as to sort out crucial ones. The results are shown in three aspects. First, the average annual concentration of O3_8h increased while that of the other urban ambient air pollutants decreased year by year, among which SO2 concentration decreased the most. Although the typical heavy pollution areas had shrunk, cities in the Beijing-Tianjin-Hebei region, Shandong Peninsula region, Shanxi Province, and Henan Province still have witnessed relatively high concentrations of air pollutants. Second, there was a significant interaction between concentrations of these six pollutants, indicating that comprehensive measures for urban air pollution prevention are necessary. Third, the impact of natural factors and socio-economic factors on urban air quality varied greatly towards different air pollutants, together with a nonlinear response relationship with the pollutant concentrations. Within the selected five natural factors of temperature, precipitation, wind speed, humidity and NDVI, the urban annual average temperature had the strongest correlation with air pollutant concentrations, followed by NDVI. Among the eight selected socio-economic factors, the level of land urbanization and the proportion of secondary production were the two leading drivers of the urban air pollution, followed by the total power consumption and traffic factors. Besides, partial dependence model was used to further analyze the response threshold of different pollutant concentrations to the dominant influencing factors. In consideration of the limited ability of human to control the physical environment and meteorological conditions, it is recommended that urban air quality should be further effectively improved by means of the optimization of urban density, the control of man-made emission sources, and the implementation of strict air pollution prevention and control measures.
Rapid urbanization in the Anthropocene has altered the interaction between human and natural systems in coastal areas of China. High frequency of disturbances caused by human activities poses great threats to coastal ecosystems, which in turn leads to coastal fragmentation and biodiversity loss. Landscape connectivity in interlinking adjacent national nature reserves is one of the key approaches to eliminate the increasing threats from human disturbances. Traditional simulation of landscape connectivity focuses on the cumulative negative resistance of landscape matrix along species migration, but ignores the positive impacts of ecosystem on migration. In this study, we proposed an innovative evaluation index system to assess landscape connectivity by integrating suitability and ecological capacity based on species distribution in China's coastal areas. We combined the advantage of traditional landscape connectivity model and species distribution to develop a method for integrating both ecological factor and human activity data. We found that human activities in coastal areas resulted in an edge effect on landscape connectivity near the boundary of nature reserves during 1995-2015. Human disturbance caused a loss of 720.25 km2 for the nature reserves, while the edge of the nature reserves undertook higher risks from human activities (46.46%). High level of human disturbance altered the starting and terminal locations of corridors while connecting adjacent nature reserves. Our results showed that the connectivity suitability of 95 corridors decreased due to the increase of human disturbance, while the ecological capacity of 78 corridors was significantly improved in terms of biodiversity distribution. This two-dimensional assessment based on the resistance and ecological capacity of landscape matrix can be provided a comprehensive simulation to estimate the dynamics of spatial and temporal patterns in connectivity and biodiversity conservation.
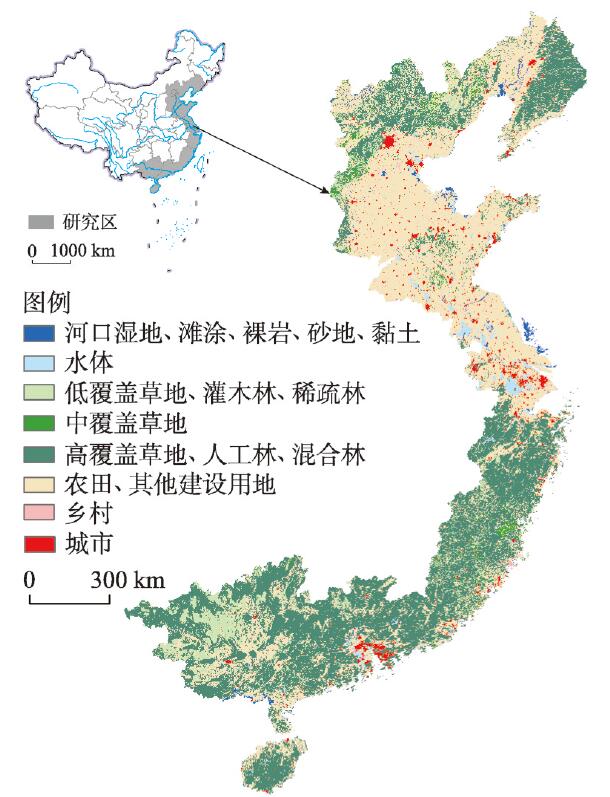
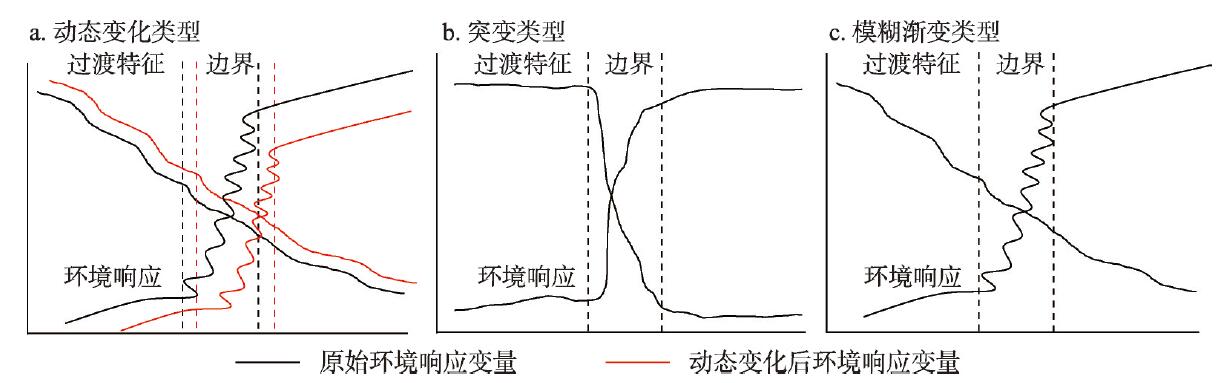
The scientific delineation of geographical boundary, which is the basic scientific issue of geography, reflects the cognitive level of the spatial variation of geographic objects from scientific abstraction and systematic analysis. From the perspective of earth system science, this paper first explicates the core issues of the basic concepts, scientific content and basic properties of geographical boundary. Based on the principles of scientificity and systematicness, the paper classifies geographical boundaries systematically according to the intrinsic mechanisms, extrinsic appearance and scientific attributes of geographical systems. This paper focuses on the analysis of the mathematical connotation and expression of geographical boundaries. In addition, it compares the characteristics and differences of traditional and modern methods for geographical boundary delineation. Finally, we construct the research framework of "geographical boundary model", which integrates the characteristics of qualitative, quantitative and positioning methods of geographical boundary. The research is expected to enrich the theory and method in geographical information science with the analysis of concept and method of geographical boundaries.
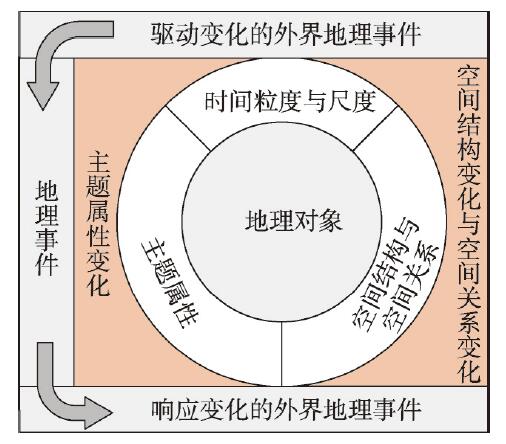
Geographic events, as a basic construct in geographic process description, have become a core content of geographic information system (GIS). Due to the limitation of acquiring human activity data, GIS modeling and analysis of geographic events has long been focused on the event-induced changes of geospatial objects and the interaction between the objects. However, in recent years, with the explosive growth of location-based service data and the rapid development of quantitative depiction of human activities, the impact of geographic events on human activities and online social participation in geographic events have aroused wide concern in many fields, which poses great challenges to the space-time cognition, modeling methods and analysis framework of geographic events. In this regard, this study discussed the conceptualization and categorization of geographic events in the context of big data, and then introduced the space-time semantics and graph-based data model for geographic events. The "node-edge" graph data structure is used to establish event ontology, the secondary or cascading events, the evolution process, and the "cause-effect" interaction. The spatiotemporal data mining approaches for geographical events were also summarized, which are limited to conventional event detection in "physical space". Integrating "virtual space" event discovery and propagation simulation ideas into data mining approaches is essential for recognizing multi-scale spatiotemporal responses and understanding regional difference of human activities under diverse geographic events. Finally, the study used urban rainstorm events as an example to examine the conceptualization and modeling method of geographic events. Social responses to urban rainstorms and regional differences were examined at inter-urban and intra-urban scales. The case study proved the concept and verified the feasibility and practicability of the proposed framework.