The field of geography has three unique characteristics, namely, regionality, integration, and complexity. Among them, complexity has become increasingly crucial to geography in the current era. Entropy is a key concept and an indicator of the complexity of a system; thus, the research and application of entropy play a fundamental role in the development of geography. During recent years, Boltzmann entropy (i.e., thermodynamic entropy) has emerged as a research hotspot in the entropy for geography. Proposed as early as the year 1872, it is the core of the well-known Second Law of Thermodynamics. However, its application in geography had remained at a conceptual level for lack of computational methods with spatial data. Fortunately, much progress has been made globally towards computing and applying spatial Boltzmann entropy (i.e., the Boltzmann entropy of spatial data). This paper aims to perform a comprehensive review of such progress, in terms of the thermodynamic origination of Boltzmann entropy, the difficulties in applying it to geography, computational models and algorithms of spatial Boltzmann entropy, and all the applications up to now. Four major conclusions can be drawn as follows: (1) The current focus of research is placed on the Boltzmann entropy of spatial raster data. Models have been developed for computing Boltzmann entropy with both qualitative and quantitative raster data. (2) Many algorithms have been developed and can be classified into three categories, namely total edge-based, Wasserstein distance-based, and multiscale hierarchy-based. (3) It has witnessed two groups of applications of spatial Boltzmann entropy to geography, namely landscape ecology and remote sensing image processing. (4) Future research is recommended to develop algorithms for more types of spatial data, validating previous conclusions drawn using Shannon entropy, and extending the applications of spatial Boltzmann entropy.
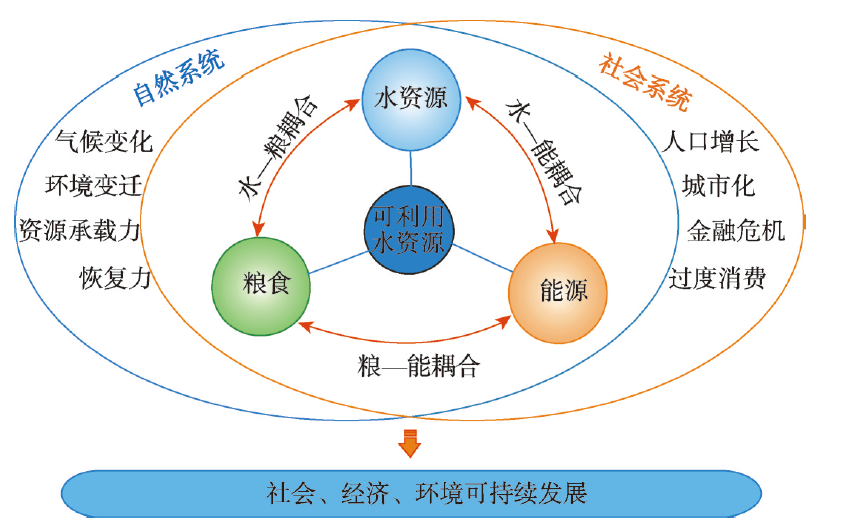
The water-food-energy nexus (WFE) plays a key role in achieving sustainable development. In this study, we systematically analyzed the concept of the WFE nexus and review its recent progress. We found that the academic communities have not reached a unanimous understanding of the concept of the WFE nexus and research framework. The evaluation methodology of the WFE nexus presents a transition from the traditional sectoral research paradigm to the human-environment system paradigm that considers the intersection of natural science and social science. These methods can also be grouped into three categories: an evaluation based on a critical process, an evaluation based on the whole system, and a comprehensive evaluation that involves coupling the internal and external elements of the WFE nexus. A bibliometric analysis shows that the number of research papers concerning the WFE nexus increased exponentially during 2000 to 2019, and the increase was particularly significant after 2015. Environmental science, food science, and nutrition science are the three main disciplines in WFE nexus research. More important, we need to strengthen the application of geography thinking, that is, comprehensive and systematic thinking, to study the WFE nexus in the future. Based on the literature review, we found that existing research lacked a quantitative understanding of the mutual feedback among the WFE nexus and its evolution. Therefore, we suggest the following five priority areas for future research: establishing a multi-source database of the WFE nexus, revealing the mutual feedback mechanism of the WFE nexus, developing a coupling model of the WFE nexus, establishing a decision-making platform for the WFE nexus, and promoting the collaboration of multiple sectors related to the WFE nexus. This will help to achieve a synergetic sustainable development of the WFE nexus through system governance and scientific management.
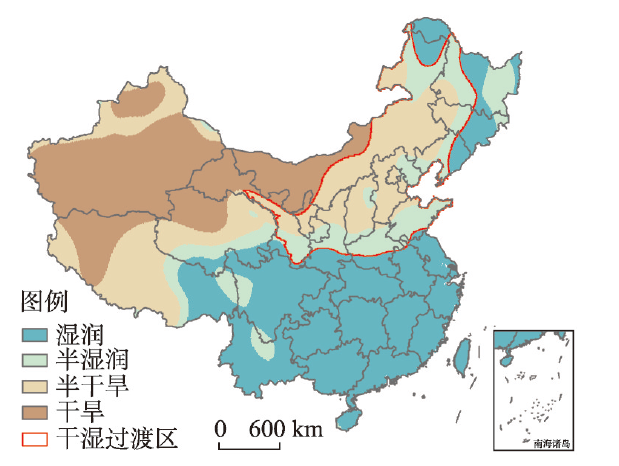
Climate change risk has been a challenge for the development of society. As the ecosystems in the arid/humid transition zone (AHTZ) in northern China are characterized by sensitive and complex response to climatic fluctuations, assessing the climate change risk for ecosystems in the AHTZ is of scientific significance to regional climate governance and risk management. This study utilized the net primary productivity (NPP) as the indice for risk assessment. Based on the climate data of five global climate models (GCMs) participating in the Coupled Model Intercomparison Project Phase 5 (CMIP5) and four Representative Concentration Pathways (RCPs), the NPP was simulated using an improved LPJ (Lund-Potsdam-Jena). A climate change risk assessment method was built to identify the climate change risk levels and their spatio-temporal distributions in the AHTZ at different periods in the future. Results show that NPP loss would gradually extend and aggravate the risk in the AHTZ from mid-term period to long-term period of the 21st century. The risk under the high-emission scenario would be more serious, mainly manifested as a negative anomaly and a downward trend of NPP. In particular, under RCP8.5, 81.85% of the area may face climate change risk, and 54.71% will reach a high risk. During 2071-2099, under RCP8.5, the NPP anomaly in the high-risk area will reach (-96.00±46.95) gC m-2 a-1, and the changing rate of NPP will reach (-3.56±3.40) gC m-2 a-1. The eastern plain of AHTZ and the eastern grasslands of Inner Mongolia are expected to become the main risk concentration areas. The future vegetation growth in these areas may be adversely affected by climate change. Increasing warming and intensifying drying may be important causes for future climate change risks.
Climate change plays a significant role in the evolution of human civilization. The West Liaohe Basin of northeast (NE) China, an area sensitive to monsoon climate change, has a prolonged history of agriculture-based civilizations, making it an ideal place to study human-landscape interactions in the Holocene. Here, analyses of multi-proxies were applied to a sediment profile (XLW) obtained near the Xinglongwa archaeological site, with a reliable chronology that covered mainly the past 5000 years. The result showed that from 5.0 to 3.7 cal. ka BP, the climate turned cooler/drier as indicated by the low magnetic susceptibility and loss on ignition (LOI), coeval with the decline of the East Asian summer monsoon (EASM). This change in climate condition coincided with the demise of agriculture-based Hongshan Culture, which was later replaced by the Xiaoheyan Culture featured by fishing and gathering livelihood. During this period, the number of Neolithic sites in NE China decreased, with a significant southward migration, possibly related to climate deterioration. After 3.7 cal. ka BP, high values of magnetic susceptibility and LOI indicated enhanced terrestrial input, which may result from the strengthening of EASM under a warming climate condition. This could have promoted the recovery of agriculture and boosted the development of the Lower Xiajiadian Culture, during which a demographic expansion was indicated by a significant increase in site numbers. After 2.8 cal. ka BP, a decreasing trend in magnetic susceptibility and LOI hinted the deterioration of EASM with a cool/dry setting, which might have caused a southward shift of settlements in the Upper Xiajiadian Culture when farming was partially replaced by pastoralism.
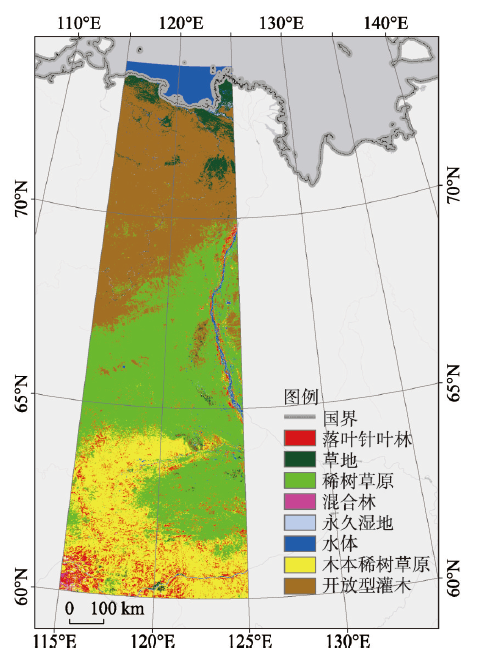
Phenology is an important indicator of climate change. Studying spatiotemporal variations in remote sensing phenology of vegetation can provide a basis for further analysis of global climate change. Based on time series data of MODIS-NDVI from 2000 to 2017, we extracted and analyzed four remote sensing phenological parameters of vegetation, including the Start of Season (SOS), the End of Season (EOS), the Middle of Season (MOS) and the Length of Season (LOS), in tundra-taiga transitional zone in the East Siberia, using asymmetric Gaussian function and dynamic threshold methods. Meanwhile, we analyzed the responses of the four phenological parameters to the temperature change based on the temperature change data from Climate Research Unit (CRU). The results show that: in regions south of 64°N, with the rise of temperature in April and May, the SOS in the corresponding area was 5-15 days ahead of schedule; in the area between 64°N and 72°N, with the rise of temperature in May and June, the SOS in the corresponding area was 10-25 days ahead of schedule; in the northernmost of the study area on the coast of the Arctic Ocean, with the drop of temperature in May and June, the SOS in the corresponding area was 15-25 days behind schedule; in the northwest of the study area in August and the southwest in September, with the drop of temperature, the EOS in the corresponding areas was 15-30 days ahead of schedule; in regions south of 67°N, with the rise of temperature in September and October, the EOS in the corresponding area was 5-30 days behind schedule; the change of the EOS in autumn was more sensitive to the change of the SOS in spring, because the smaller temperature fluctuation can cause the larger change of the EOS; the growth season of vegetation in the study area was generally moving forward, and the LOS in the northwest was shortened, while the LOS in the middle and south of the study area was prolonged.
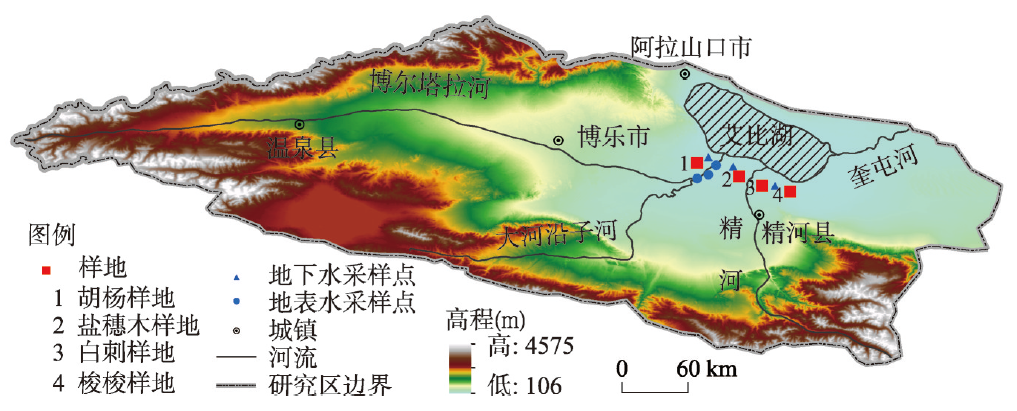
In arid and semi-arid environments, desert vegetation plays an important role in preventing soil erosion by wind and maintaining the stability of the desert and oasis ecosystem. Four types of typical desert vegetation, namely, Populus euphratica, Haloxylon ammodendron, Nitraria sibirica and Halostachs caspica, in different habitats (i.e., banks, sand dunes, desert, and salt marshes) were chosen as the model vegetation in this research. The δ2H and δ18O of rain water, soil water and plant water were applied to identify the water sources and quantify the proportions of water used during the whole growth period (from March to October). The results showed that the precipitation δ2H and δ18O in the Ebinur Lake basin varied from -142.5‰ to -0.6‰ and from -20.16‰ to 1.20‰, respectively. The largest values of δ2H and δ18O were found in summer and the smallest ones in winter. The soil water δ2H and δ18O of the four habitats decreased gradually with the increase of the depth. The δ2H and δ18O values of water extracted from the four plant stems had similar variation trend, i.e., the maximum was observed in spring, and the minimum was in summer. Among the four plants, Halostachs caspica had the highest stable isotopic values in the stem water, followed by Nitraria sibirica, Haloxylon ammodendron and Populus euphratica. The water sources and utilization ratios of desert vegetation varied in different growth stages. In the whole growing period, Haloxylon ammodendron mainly used groundwater. The proportion of water used by Nitraria sibirica varied greatly throughout the growing season. In spring, plants mainly relied on surface soil water, with a contribution rate of 80%-94%; in summer, the proportion of deep soil water use was 31%-36%; and in autumn, the proportion of middle soil water use was 33%-36%. Halostachs caspica mainly relied on topsoil water in spring and autumn, and the proportion of soil water in the middle layer slightly increased in summer, which was 20%-36%. Populus euphratica mainly used the intermediate soil water in spring, with a utilization rate of 53%-54%; in summer, groundwater was the main source, with a utilization rate of 72%-88%, and only 2%-5% from river water; in autumn, the utilization rate of river water rose to 11%-21%. The results indicated that there were significant differences in water use sources during the growing season of desert vegetation in arid areas. This research provides a theoretical basis for understanding the water use mechanism, water adaptation strategies, and vegetation restoration and management of desert vegetation in arid areas.
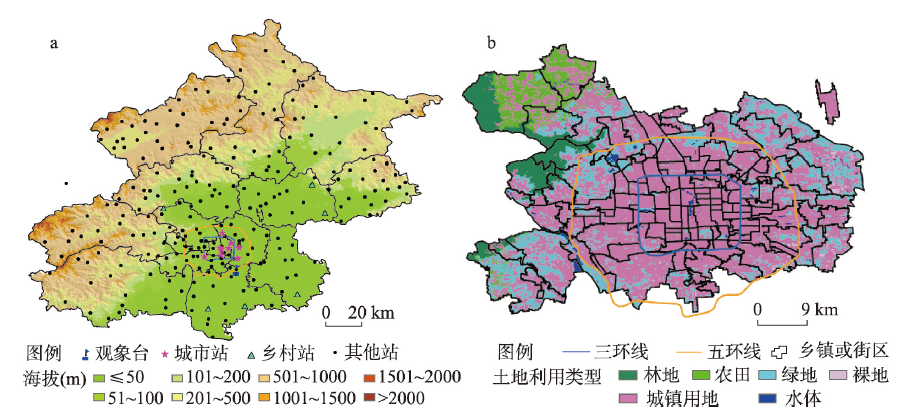
Exploring the influence of urban spatial morphology layout on the urban heat island (UHI) at the urban scale is of great significance for the improvement of ventilation environment and the ecological and livable urban planning. Taking Beijing, China as an example, this study analyzed the UHI spatial characteristics using the hourly temperature data of high-density automatic weather stations in 2009-2018 and the 2018 NPP/VIRRS night-light satellite data. Using 1:2000 basic geographic information data and Landsat8 satellite remote sensing data in 2017, based on remote sensing and GIS technology and morphological models, we extracted eight morphological parameters in the main urban area of Beijing, namely, building height (BH), building density (BD), building standard deviation (BSD), floor area ratio (FAR), frontal area index (FAI), roughness length (RL), sky view factor (SVF), fractal dimension (FD) and three land surface parameters consisting of vegetation coverage (VC), impervious cover (IC), albedo (AB). The relationship between these morphological parameters and UHI was further examined at the urban scale using the spatial statistical method. Results show that the downtown area of central Beijing has presented a relatively fixed distribution pattern of UHI at annual scale, four seasons, and 02:00 at nighttime in the past 10 years. The UHI of the annual, spring, summer, autumn, winter, 14:00, and 02:00 are 1.81℃, 1.50℃, 1.43℃, 2.16℃, 2.17℃, 0.48℃, and 2.77℃, respectively. The eight spatial morphological parameters have obvious spatial correlations with UHIs for most of the year, and the correlations are stronger in winter than in other seasons, and stronger at 02:00 am than at 14:00 pm. The top three parameters are SVF, FAR, and BD. There are spatiotemporal changes in the impact of different spatial morphological parameters and land surface parameters on UHI. Spatial morphological parameters have become important drivers of UHI change and the individual contributions of the eleven parameters to UHI changes are 13.7% to 62.2%. The spatial morphological parameters that contribute the most in summer, winter, and the whole year are BD (43.7%), SVF (62.2%), and SVF (43.0%), respectively; and the corresponding largest land surface parameters are VC (42.6%), AB (57.1%), and VC (45.4%), respectively. The comprehensive contribution of multiple parameters to UHI changes in summer, winter, and the whole year are 51.4%, 69.1%, and 55.3%, respectively; and the dominant influencing factors are BD, SVF, and BD.
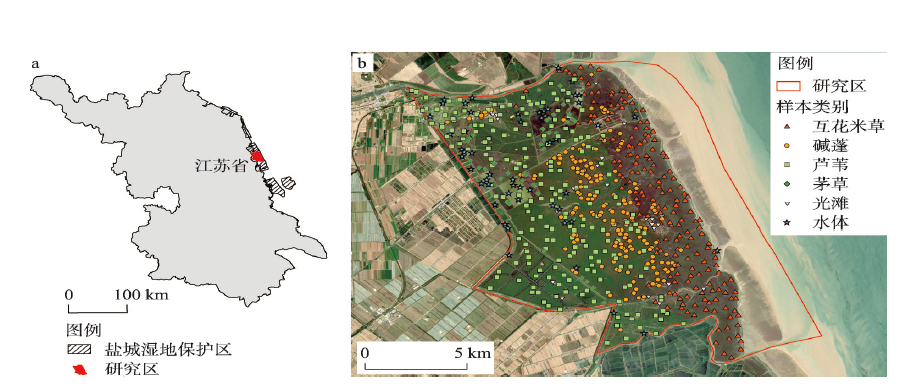
Coastal wetlands are special land-sea transitional ecosystems with important functions. It is of great significance to obtain the spatiotemporal distribution data of coastal wetland vegetation accurately. Previous wetland mapping studies focusing mainly on high spatial and spectral resolution images often have difficulties such as high data acquisition costs and limited coverage, so these methods are only suitable for small regions. Sentinel-2A/B satellite images with high spatial and temporal resolution and free sharing, make it possible for us to dynamically monitor large-area coastal wetlands. Based on Sentinel-2 images in 2018, this study proposed the pixel-level SAVI time series and double logistic vegetation phenological feature fitting reconstruction model, used a random forest algorithm to classify Yancheng coastal wetland vegetation in Jiangsu, East China, and then discussed the applicability of vegetation phenological characteristics (VPC) classification method. The results show that the overall accuracy of mapping based on VPC was 87.61%, which was 19.57% higher than that of the conventional single image classification, and the results were consistent with the actual distribution of wetlands. The vegetation discriminant phenological parameters can provide the basis for differentiating various types of vegetation, which can be applied to coastal wetland classification in the case of missing or insufficient image data. The phenological parameters have improved the method based on VPC, which can be applied to the rapid and accurate extraction of coastal vegetation and also provides new ideas to solve the problem of insufficient data in coastal wetland classification research. The method based on VPC in the pixel-level time series can achieve the accurate classification of the mixed zone of vegetation communities and the effective differentiation of "the same spectrum with different objects", which is applicable to the coastal wetland classification in large regions and improves the mapping accuracy of coastal wetland vegetation effectively.
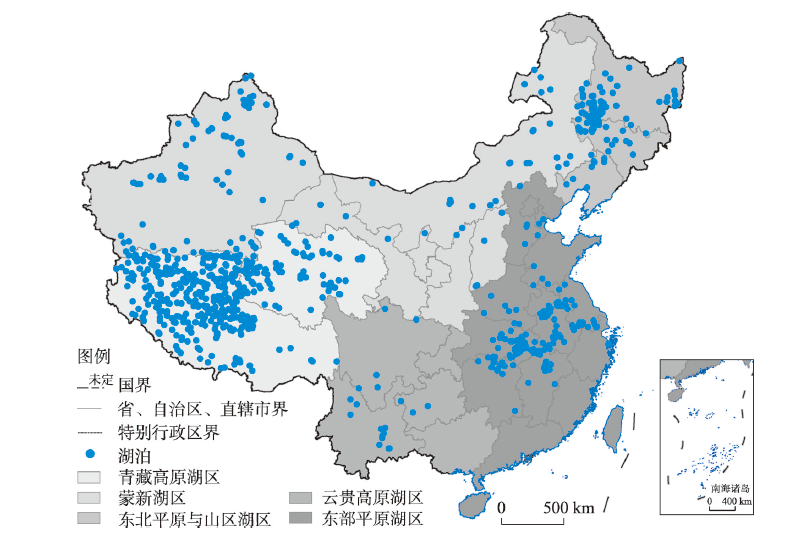
With the impact of global warming and socio-economic development, eutrophication has been observed frequently in Chinese lakes. Therefore, there is an urgent need to monitor the phytoplankton biomass of the lakes. In this paper, 756 lakes with an area more than 10 km2 were selected as research objects. With the help of Google Earth Engine platform, we retrieved the chlorophyll-a (chl-a) concentration from 2003 to 2018, revealed the seasonal and annual nutritional status, and examined the spatio-temporal changes of the lakes. The relationship between spatio-temporal characteristics of lake trophic status and meteorological phenomena, socio-economy and lake features wers analyzed. The main conclusions are as follows: (1) The change of lake trophic states in China has obvious seasonality and regionality. About 90% of lakes were mesotrophic within 15 years of the study. In spring, most lakes in the plain areas of eastern China, the Northeast China Plain and mountain regions were oligotrophic, while in summer, many lakes turned into eutrophication. In comparison, most lakes on the Qinghai-Tibet Plateau and the Yunnan-Guizhou Plateau were eutrophic in spring. The interannual variations in chl-a concentration show that 82% of lakes in China had slight changes in chl-a concentration (the absolute annual rate is <0.5), and the rest showed dramatic variations. (2) The lake surface temperature and precipitation had strong influences on chl-a concentration. For more than 70% of the lakes, the concentration of chl-a had a positive correlation with the lake surface temperature and precipitation, most of which are located in the eastern and northern China. The population in buffer zone, altitude, and geographical location of the lakes also exert influence on the biomass of the phytoplankton.
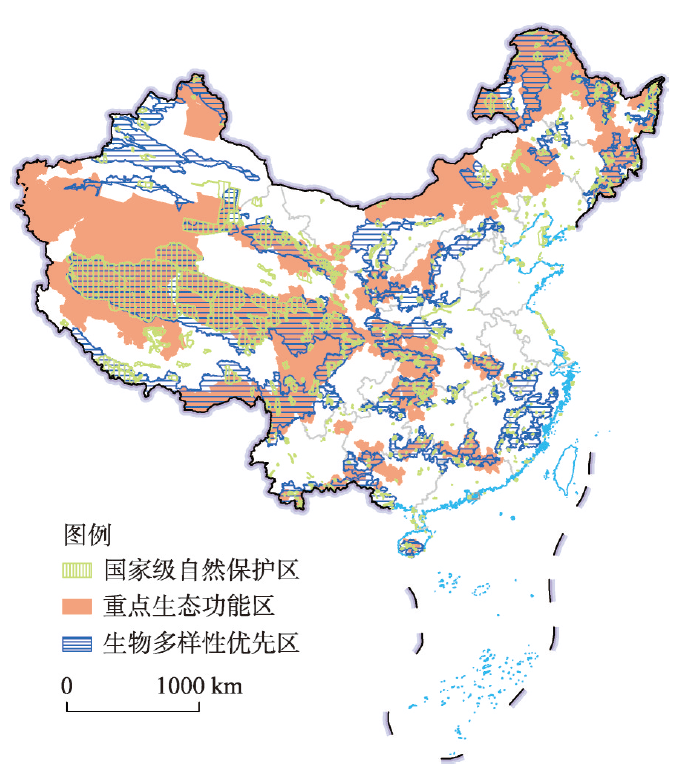
It is important to quantitatively analyze the effects of protecting important ecological spaces in China to ensure national ecological security. By considering changes in the ecological land, this study examines the effects of protecting three types of important natural ecological spaces in China. The results show that: (1) In 2018, the ratio of ecological land to important natural ecological spaces accounted for 92.64%. This land had a good ecological background that reflects the developmental orientation of important ecological spaces. (2) From 1980 to 2018, the area of ecological land in important ecological spaces shrank but the rate of reduction was lower than the national average, which shows the positive effect of regulating construction in natural ecological spaces. The restorative effects of ecological projects to convert farmland into forests and grasslands have been prominent. The expanded ecological land is mainly distributed in areas where such projects have been implemented, and the reduced area is concentrated in grain-producing regions of the Northeast China Plain and agricultural oases of Xinjiang. In the future, the government should focus on strengthening the management and control of these areas. (3) The area ratio of ecological land was the highest in national nature reserves. The rate of reduction in its area was the lowest and the trend of reduction was the smallest in national nature reserves, which reflects differences in the status of ecological protection among different spaces. (4) The ratio of ecological land to important ecological spaces was higher than that in the surrounding external space, and the rate of reduction in it was lower. Thus, the effects of internal and external protection had clear differences in terms of gradient.
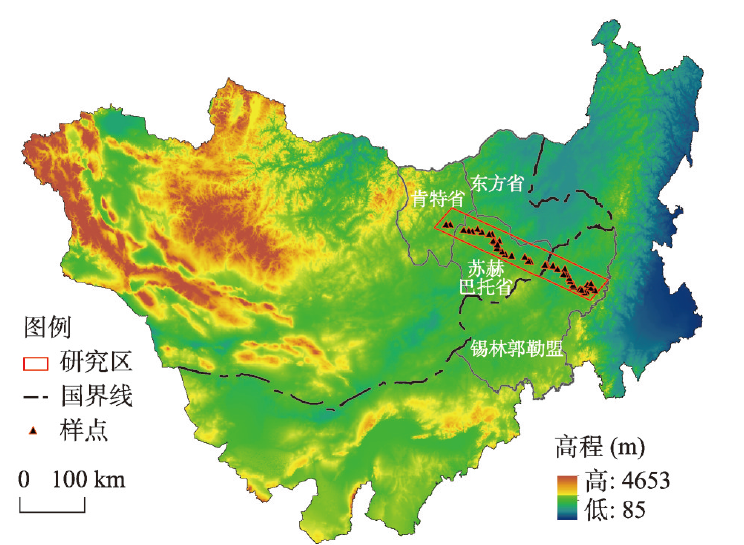
Located in the southern part of the Mongolian Plateau, the Inner Mongolia grassland is an important ecological barrier in northern China. The ecological restoration is a tough task and poses a great pressure on the grassland. In this paper, we focus on the Ujumqin-Undurhan transect, a typical grassland of the Mongolian Plateau. We used Landsat TM data from 1988 to 2016 which was divided into five periods (of seven years), to reveal the characteristics of grassland utilization in the transect, a transboundary between Mongolia and Inner Mongolia autonomous region of China. In addition, we determined the main disturbance factors of grassland and explored effective restoration mitigation and an international experience for reference. Based on land-use type as of 2016, we found that grassland accounted for 95.05% of the transect, which was evenly distributed across the entire transect. Other land use types accounted for a small proportion, and were relatively concentrated in the localized areas. Among them, cultivated land was concentrated in the Mongolian section in the northwest of the transect, while mining and its industrial area, sandy land, and saline-alkali land were mainly located in the Inner Mongolian section in the southeast of the transect. In the past 30 years, the arable land in the transect decreased the most (35.71%), which was concentrated in the Mongolian section. The area of grassland and water mass suffered a continuous decline with a similar trend both on Chinese and Mongolian sides. However, the decrease in the area of grassland in Inner Mongolia, China was greater than that in Mongolia, and most of them were converted to unused land. The largest increase was found in mining and its industrial area in the transect, nearly 367 times of the initial period, which was concentrated in the Inner Mongolian section. The area of saline-alkali land and sandy land underwent a continuous increase and the changes within the two countries were comparable. Finally, we found the grassland was the predominant land use type on the plateau, which was mainly used for grazing. Mining was the chief disturbance factor of grassland in China, followed by grazing. Meanwhile, the reclamation was the main disturbance factor in Mongolia. The extent of grassland disturbance in Inner Mongolia, China was much greater than that in Mongolia. Overall, grassland degradation and drought were the main ecological and environmental challenges faced by the Mongolian Plateau, especially in Inner Mongolia.
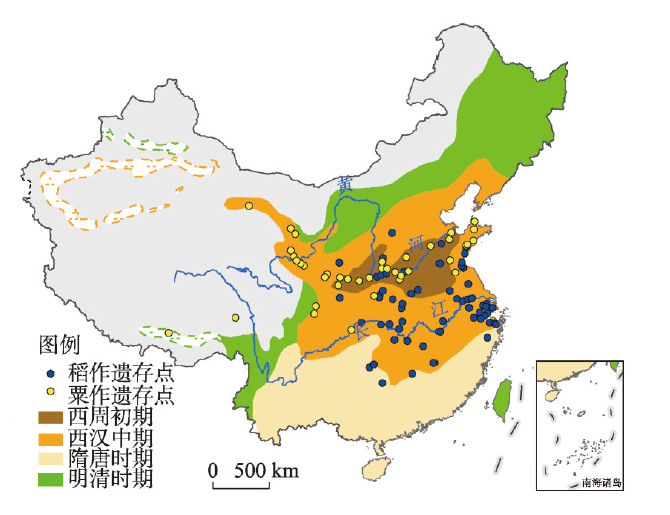
By synthesizing the results from recent peer-reviewed publications on the agricultural history and the historical cropland cover reconstruction in China, we summarized the general characteristics of the agricultural area and fractional cropland cover changes in China for the past 2000 years. The conclusions are drawn as follows: (1) In the western Han Dynasty, the main agricultural areas expanded from the middle and lower reaches of the Yellow River to the northern China. During the Tang and Song dynasties, the expansion of the agricultural areas that mainly occurred in southern China featured from the plain to hill and to high-land. From the middle of Qing Dynasty, the expansion of the agricultural areas mainly occurred in the border areas including Northeast China, Southwest China, and Northwest China, as well as remote regions mountains. (2) In the past 2000 years, the total cropland area in China has been increased in general although there were fluctuations. The cropland area reached about 500, 600 and 800 million mu around beginning of the 1st century, the early 8th century and the late 11th century, respectively. It exceeded 1, 1.2, 1.6 and 2 billion mu around the late 16th century, the early 19th century, 1953 AD and 1980 AD, respectively. (3) In China, the pattern of cropland was formed in the 11th century. Around 1080 AD, the cropland cover fraction accounted for more than 30% in the Huang-Huai-Hai Plain and the Guanzhong Plain and about 30% in the Yangtze River Delta, the Jianghan-Dongting Plain, the Poyang Lake Basin and the Sichuan Basin. Around 1850 AD, the cropland cover fraction took up more than 30% in the North China Plain, the Weihe and Fenhe river basins and some parts of eastern Gansu Province, the Sichuan Basin, the Jianghan-Dongting Plain, the Poyang Lake Basin and the Yangtze River Delta. Around 2000 AD, in the agricultural areas including the Northeast China Plain, the North China Plain, the Weihe and Fenhe river basins and some parts of eastern Gansu, the Sichuan Basin and the middle and lower reaches of the Yangtze River, more than two-thirds of which had a cropland cover fraction of more than 50%. The cropland cover fraction was more than 15% in the Western Liaoning hills, the Bashang Plateau, the Loess Plateau, as well as the hilly and mountainous areas of southern China. The highest cropland cover fraction also exceeded 50% in some oasis agricultural areas and the valley agricultural areas on the Qinghai-Tibet Plateau.
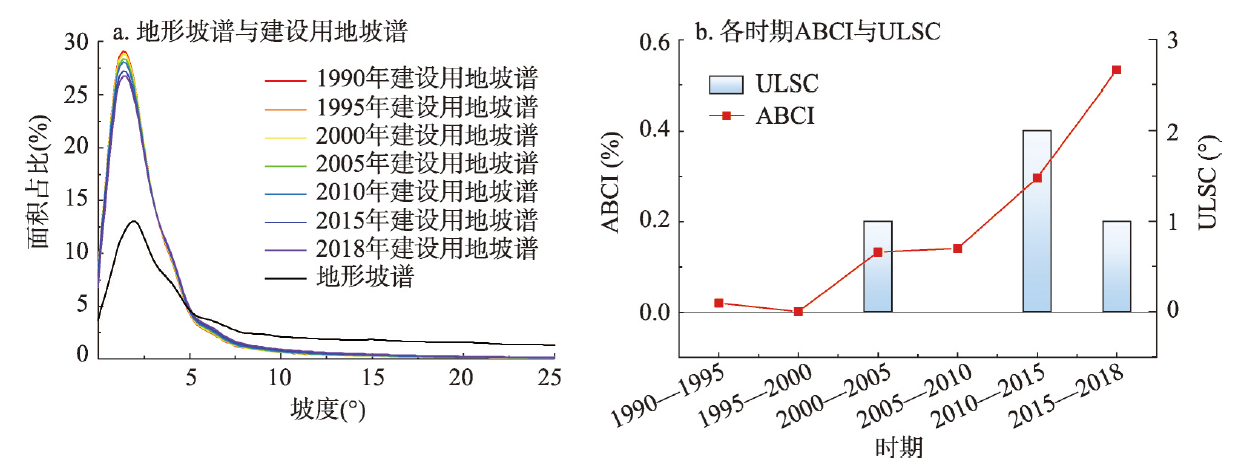
The changes in the scale and structure of built-up land is the basis for spatial development and planning of the national territory. Previous studies mainly focused on the characteristics and patterns of the horizontal expansion of built-up land, but little attention has been given to the "three-dimensional" gradient characteristics and effects of built-up land (such as slope-climbing). Therefore, based on Google Earth Engine, this study, for the first time as far as we know, uses DEM and land use data to draw built-up land slope spectrums and calculates the average built-up land climbing index (ABCI). The gradient characteristics and laws of the slope climbing of China's built-up land from 1990 to 2018 at the national, regional, provincial, and urban scales are systematically analyzed and the various spatial effects are explored. The results show that: (1) From 1990 to 2018, the area of built-up land with slope angle above 5° in China increased by 1.43 times, and the proportion of the total built-up land area rose from 10.25% to 14.81%. Particularly, the 2010-2015 period witnessed the fastest and largest slope-climbing development of built-up land in China. Moreover, the slope-climbing intensities in the central and western regions are higher than that in other regions. (2) According to the average built-up land climbing index (ABCI) and the upper limited slope angle change (ULSC), the 34 provinces (autonomous regions and municipalities) in China can be divided into three types: high-climbing, low-climbing, and horizontally expanding. Among them, the number of high-climbing provinces accounts for more than 50% of the total. And seven horizontally-expanding provinces present the distribution characteristics of "southeast-northwest" in space. (3) Before 2010, the cities with slope-climbing phenomenon were mainly mountainous cities. However, ethnic minority settlements and low-hill and gentle slope development pilot cities became the main force for the slope-climbing of built-up land after 2010. (4) The slope-climbing of built-up land can reduce the occupation of plain arable land and ecological land by built-up land expansion to a certain extent, and thus alleviate the contradiction between supply and demand of build-up land. However, it is worth noting that development and construction without reasonable plans and bulldozing mountains to build cities driven by real estate can also lead to increased geological disasters and ecological risks.
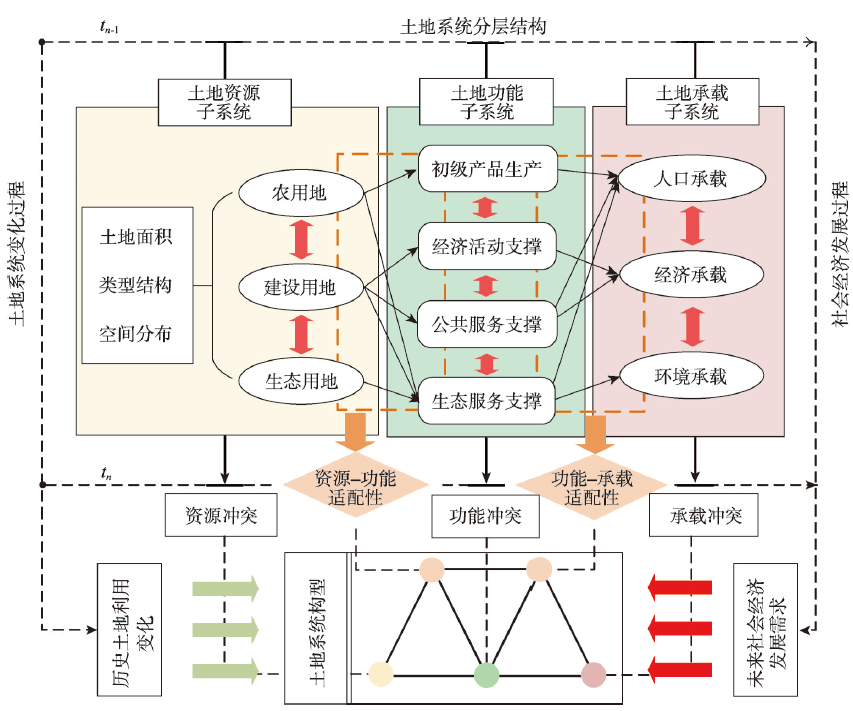
Land use sustainability evaluation is vital in the cross-disciplinary study of land system science and sustainable development, which is of great significance to the identification of regional land-use problems and the decision making in sustainable land management. With the connotation analysis of land use sustainability (LUS), this study proposes a new framework for LUS evaluation based on the perspective of land system conflict and adaptation, which is suitable for different regions and periods. Taking the Yangtze River Delta (YRD) region from 2000 to 2015 as an example, the following conclusions are obtained: (1) Based on the external development pressure and the internal support of land system, the "M"-shaped land system structure consisting of "resource subsystem conflict", "function subsystem conflict", "capacity subsystem conflict", "resource-function adaptation" and "function-capacity adaptation" can be constructed. Further, land use sustainability is obtained by calculating the structural support and balance based on the static balance equation. (2) Among the land conflict-adaptation indicators in the study region, the improvement degree of FC is the highest and the degree of F-C is the lowest. All indicators have significant spatial differentiation characteristics of urban-rural areas, latitude, and land-sea. (3) The YRD region contains 17 types of land system configuration, showing the characteristics of the stable and unstable polarization and the small number of intermediate structures. The LUS results in the YRD region range from 0.20 to 1.58, among which the LUS of Zhejiang > Anhui > average of the whole region > Jiangsu > Shanghai. The LUS in areas implementing green development strategies like Zhuji City and Anji County in Zhejiang Province is significantly higher than that in areas implementing traditional economy-led development strategies such as Lianyungang City and Rudong County in Jiangsu Province. This study can provide a reference for analyzing the sustainability of the regional land system, setting the land sustainable development planning goal, and exploring the direction of land system transformation.
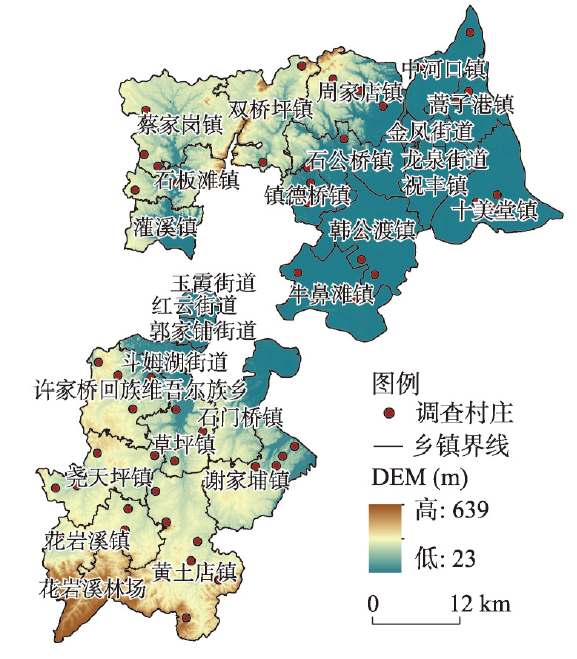
Under the background of global climate change, drought has become more serious than before. Therefore strengthening drought risk governance is of great significance to the sustainable development of regional agriculture. The consensus of different stakeholders will affect drought risk governance, so quantifying consensus will help to deepen the understanding of cooperation and drought relief mechanism of multi-stakeholders. Starting from the "cognitive-emotional” dimension and considering the emotional positivity, this article constructed a consensus indicator system and a model based on "distance" to quantify the consensus of Dingcheng district government, township governments, village committees, households and agricultural enterprises in Hunan Province. The main conclusions are as follows: (1) In the "cognition" consensus, the average value of each group presents a trend of emergency understanding > preparedness understanding > recovery understanding. Cognition differences among households, village committees, and governments in preparedness and recovery measures are more obvious. (2) In the "emotion" consensus, the average of each group presents a trend of fairness perception < tolerance perception < constraint perception < sense of belonging. The attitudes of stakeholders towards fairness, consideration for others, and acceptance for resource constraints are not positive. The government, village committees, and enterprises have obvious differences. (3) In the integrated consensus, the average values of households with township governments, village committees with district government, township governments with district government are greater than 0.65, while those of the enterprises with other stakeholders do not exceed 0.6. The results reveal the differences in the perceptions, and open up a new quantifiable idea for the multi-stakeholders' "consilience" research on the integrated risk governance of drought, which provides references for further consideration of different stages, requirements of different stakeholders and resource allocation in the risk governance.
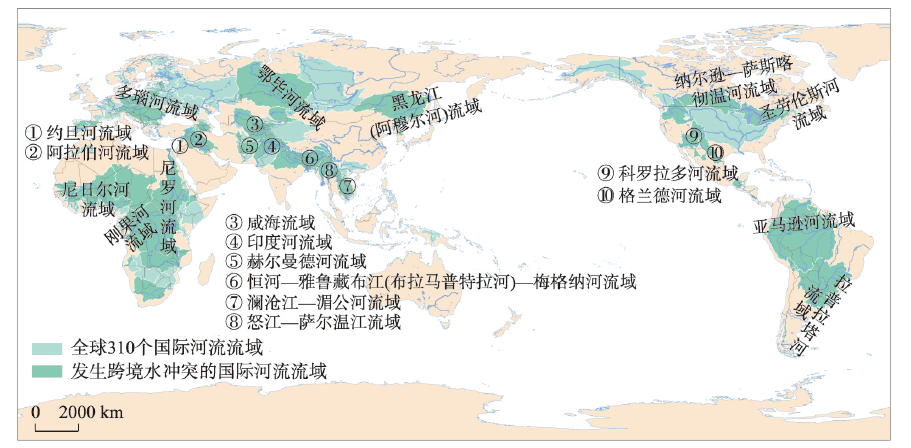
With global climate change and the rapid development of human society and economy, the contradiction between water supply and demand has become increasingly prominent in recent years, and the freshwater conflicts in international river basins have intensified, which has aroused widespread concern in academia. Here we analyzed the spatio-temporal dynamics of global freshwater conflicts (GFCs) over the last 70 years from the "event-relations" perspective, and establish a spatio-temporal database of GFCs from 1948 to 2018 based on data mining method and spatial analysis. The results show that: (1) The evolution of GFCs is a non-monotonic dynamic process with multi-dimensional characteristics of trend, mutation and volatility. The GFCs showed a general trend of fluctuating growth, with an obvious sudden change around 1987. (2) The GFCs are mainly composed of low-intensity conflicts, and the hydrological intervention and contention for resource ownership are the focus of conflicts. The number of conflicts caused by the construction of dams and other water conservancy projects increases significantly. South Asia, West Asia and East Africa are the leading forces driving the evolution of GFCs. (3) The pattern of GFCs has changed from single-center to multi-center, and there is a clear trend of spatial spread. However, the overall distribution pattern with more conflicts in the northern and eastern hemispheres and the pattern with less conflicts in the southern and western hemispheres is relatively stable. Along 30-degree north latitude, a dense zone of freshwater conflicts covering high water stress basins in South Asia, Central Asia, West Asia, and East Africa has formed. (4) International freshwater conflict has gradually become more ubiquitous, complicated and networked, and the basin communities of freshwater conflict network have increased significantly. But the "Matthew effect" of freshwater conflicts among countries are obvious, and its polarized distribution pattern is relatively stable. A "path-locking" effect has been formed among the major conflictive countries. There is a certain spatial mismatch between the quantity relationship and intensity relationship of GFCs.