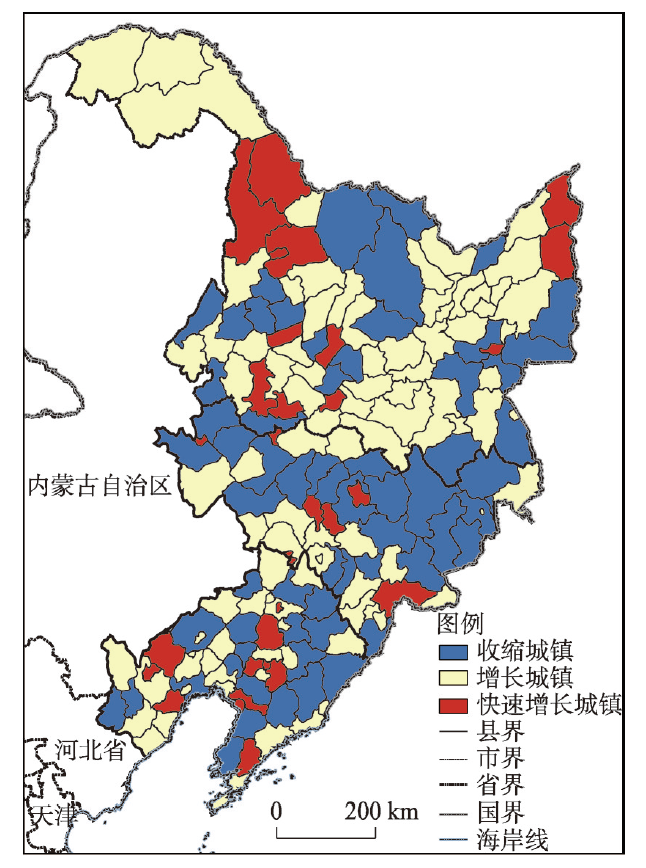
Understanding the population loss and economic decline in the three provinces of Northeast China from a perspective of urban shrinkage is of great significance to deepening the transformation theory of China's old industrial bases. The main results can be summarized as follows. Since 2000, obvious differences in urban growth and shrinkage have occurred in Northeast China. Some 42.85% of cities showed an urban shrinkage. The manufacturing and service industries in cities of urban growth (growing cities) are increasingly advanced, while the development of new pattern industries and industrial structure upgrading are slow in cities of urban shrinkage (shrinking cities) and the economic competitiveness of these shrinking cities is weakening. There is a close spatial correlation between growing and shrinking cities. On the one hand, growing cities continuously absorb the production factors such as population and capital of shrinking cities through the agglomeration effect, and on the other hand, they increase the pressure of economic transformation of shrinking cities through the spatial transfer of traditional industries. The shrinkage degree varies from high to low from north to south, and shows a trend of 'first strengthening, then weakening' from east to west. The processing cities have the highest shrinkage degree, followed by industrial and mining cities, and the tourism and port cities have a relatively low shrinkage degree. The factors influencing urban shrinkage include the development lag of public service facilities, the misalignment of industrial development and market demand, the low correlation degree of industrial structure, the aging of population structure, and the agglomeration effect of regional central places, their intensity of action enhancing in turn. According to the economic long wave theory and local circumstances, Northeast China will experience a long-term urban shrinkage in the future. It should be a strategic choice to develop this region to actively adapt to the shrinkage, and optimize and reorganize population and economic factors through smart urban shrinkage.
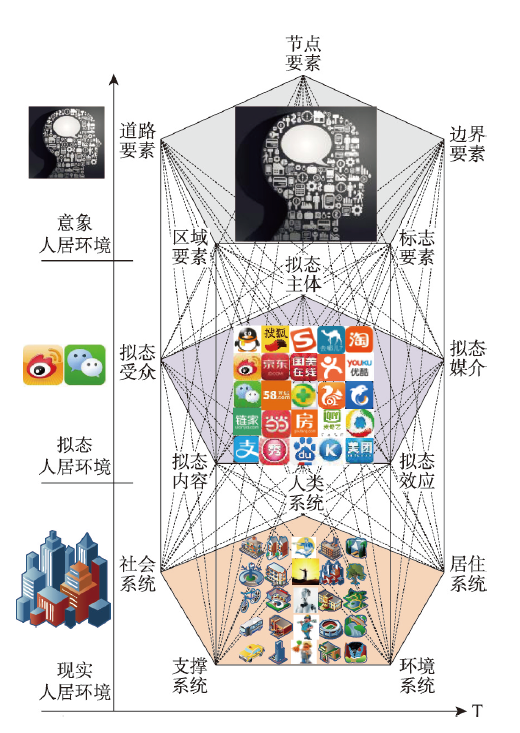
The study of a single form of the reality human settlements cannot reasonably explain the ever-changing human settlements phenomenon under the human-land relationship regional system. At present, the theoretical basis, practical exploration, and scientific decision-making of the interaction between different forms (reality, pseudo, and imagery) of human settlements are not clear. To construct the theoretical framework of the coupling coordination of urban pseudo and reality human settlements, this paper uses the coupling coordination model, spatial trend analysis, geographical detector and other empirical analysis methods to analyze the space-time law of coupling coordination in the three provinces of Northeast China from 2011 to 2017, and discusses its influencing factors and driving mechanism. The results show that: (1) the coupling shows a rising trend, with relatively obvious stage characteristics; a dual-core and single-center coexistence pattern is formed in space, and the spatial pattern evolves from scattered clusters to "T"-shaped clusters and bands; (2) Overall coordination is on the verge of imbalance, coordination and interaction have steadily evolved to a high level, intermediate coordination has occupied a certain position, and high-level coordination has begun to emerge; The core polarization spatial pattern of the degree of coordination is obvious, the four major cities dominate the overall level of coordination and interaction in the three provinces; At the same time, the spatial pattern of regional differences, nemely, "coexistence of polarization and balance" within the province, "lower in the north and higher in the south" across the study area, and "center-periphery-low lands" for the whole region, will be formed; The overall coordination shows the spatial trend characteristics of "high in the middle and low at both ends" in the east-west direction and "higher in the south and lower in the north" in the north-south direction; (3) the coupling and coordinated development of pseudo and reality human settlements is the result of comprehensive factors, among which social and economic development is the dominant driver, "human" is the background driver, entertainment system is the emerging driver, and social system is the important media driver.
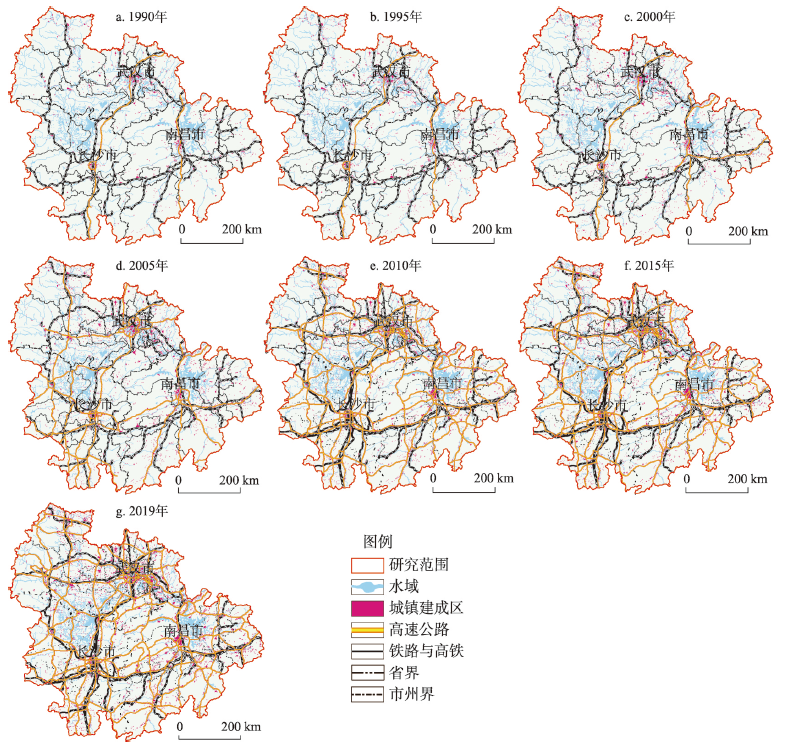
The spatial structure reflects the hierarchical structure, functional structure, and community form between cities in the urban agglomeration, representing the expansion model and development characteristics of the urban agglomeration within a certain time range. In this study, the urban agglomeration in the middle reaches of the Yangtze River (UAMRYR), which is the first approved national urban agglomeration in China, is selected as the research object. The land use / land cover datasets, Landsat images, and urban population data were used in this study to analyze the evolution process and characteristics of the UAMRYR during 1990-2019 at the macro and micro levels. The research methodology includes the development of the spatial database, construction of the grid system, calculation of the urban expansion degree, and building of the expansion rose map. Based on the characteristics and the rules of historical development, a scenario analysis is processed on the development situation for 2020 and 2030. The main conclusions are as follows: (1) From 1990 to 2019, the spatial structure of the UAMRYR has transitioned from "three centers" into "single core, double centers, and multi- clusters", and then into "double cores, multi-centers, and multi-clusters". The "double cores" of the Wuhan metropolitan area and the Changsha-Zhuzhou-Xiangtan urban agglomeration has developed into giant cores and will continue to expand during 2020-2030, becoming superlarge cores with built-up areas of about 2000 km2 and 1500 km2, respectively. Nanchang is relatively small and would remain as the regional development center radiating the Jiangxi Province. Seven development sub-centers have been formed, namely Xiangyang, Yichang, Jingzhou, Changde, Hengyang, Jiujiang, and Shangrao, and are expected to increase further in the future. (2) In the development process, four main axes of the Yangtze River, Wuhan to Changsha, Wuhan to Nanchang, Nanchang to Changsha, and several secondary axes have been formed. However, due to the lack of strong border hub and bridgehead city, the driving force of the axes on the urban agglomeration needs to be further improved. (3) There are several development problems in the area. The polarization effects of cores in the Wuhan metropolitan area and the Changsha-Zhuzhou-Xiangtan urban agglomeration are extremely strong and continue to present a development trend. Jiangxi Province lacks a strong core, thus various environmental problems emerged due to the over-concentration of urban built-up areas. These places are urgently adjusted in order to control the speed of expansion, cultivate new regional centers, and strengthen the axis function.
In recent years, increased attention has been given to the role of city networks in promoting economic performance. Nevertheless, the empirical evidence concerning urban network externalities and its transmission mechanisms is at best patchy. This study sets out to gain a better understanding of network externalities through the lens of corporate networks in China. Information on the headquarter and branch locations of China's top 500 public companies in 2017 are subjected to ownership linkage model to construct the urban network, resulting in a panel data with 265 cities in 2006 and 2016. Then the impacts of network linking strength and economic performance of partners on urban economic growth are quantitatively measured, and the dynamic mechanisms of network links that affect urban economic growth under the production fragmentation environment are discussed. Two conclusions are drawn. First, the transmission mechanisms of network embeddedness influencing urban economic growth in China have different effects. The analysis results of all samples show that the strength of network links has a profound impact on the quality of urban economic growth, but the impact of economic performance of partners is not obvious. This means that, in general, the transmission mechanisms of network embeddedness are to highlight the comparative advantages and economies of scale of cities, rather than to promote knowledge spillovers and technical progress. Second, the impact of network embeddedness on urban economic growth is heterogeneous in many dimensions. Cities in the eastern region, core position or with a large population size benefit more from the network competitive advantage and the knowledge flow system of "local buzz and global pipelines", while cities in the central and western regions, peripheral position or with a small population, bounded by lack of network competitiveness and "knowledge gatekeeper", increase the risks of low-end lock of industrial economy. In the future, the policy and governance of urbanization in China need to be adjusted accordingly. The Chinese government should promote network cooperation among cities on a larger spatial scale, and attach great importance to the multi-dimensional development gap between cities under the network environment.

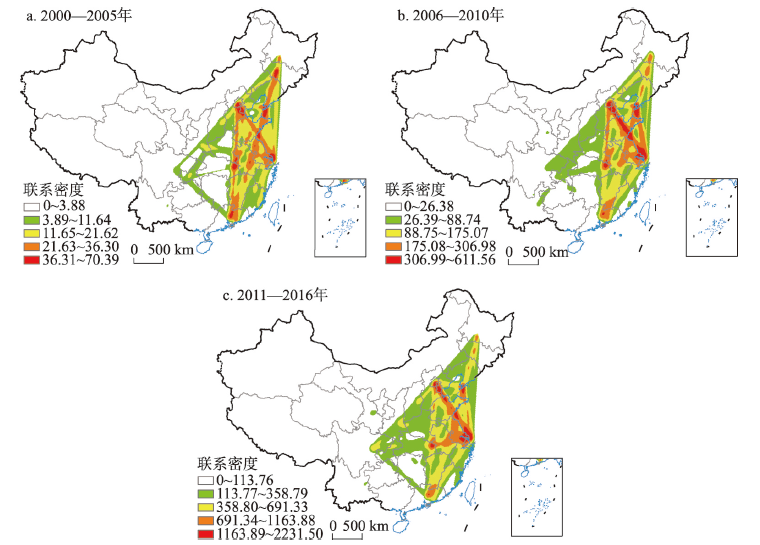
Improving the connectivity of multi-sector enterprises at a cross-regional level can enhance knowledge and technology transfer and stimulate innovation and synergies among cities. Therefore, the study of city networks, which comprise a large number of multi-sector enterprises, can provide an important knowledge base for innovation and development at the regional and national levels. Based on an evaluation of innovative enterprises in China by authoritative institutions, data were collected on 1778 multi-sector enterprises, which included details on the headquarters, the branches (a total of 30,625) and the locations. A city-based network for the country was established, using the data for the multi-sector linkages and a model for the headquarters-branches, to explore the network connectivity characteristics via social network analysis, the GIS method and the spatial interactive model. The results showed that (1) although the network covered 353 cities across China, the spatial distribution of the network was extremely uneven. For instance, a diamond-shaped connectivity pattern emerged gradually as the network hierarchy decreased. The Beijing-Tianjin-Hebei region, the Yangtze River Delta and the Pearl River Delta were found to be the three key hubs of the network. (2) The intercity linkages between innovative enterprise sectors (innovative enterprise flows), had a clear administrative center and a provincial boundary effect. Moreover, the innovative enterprises were strongly attracted to the municipalities and provincial capitals. Beijing was at the heart of the network, followed by Shanghai and Shenzhen. (3) Differences existed in regional connectivity. There was a striking difference between the eastern region and the central-western region. The former had a high connectivity with respect to both the internal and the external networks, while the latter had lower connectivity for the internal network but a higher connectivity at the external level. At the same time, although the network structures for all the three eastern megalopolises showed strong cohesion, their connectivity characteristics were quite different. (4) The input and output of innovative enterprise flows were to varying degrees influenced by the indicator attributes for each city, and these in turn were related to the administrative hierarchy, the economic strength and the innovative environment of the region, as well as proximity indicators, which were related to geographical, technological and institutional factors. Foreign capital was not conducive to innovative enterprise flows and to the formation of innovative intercity company-based networks in China.
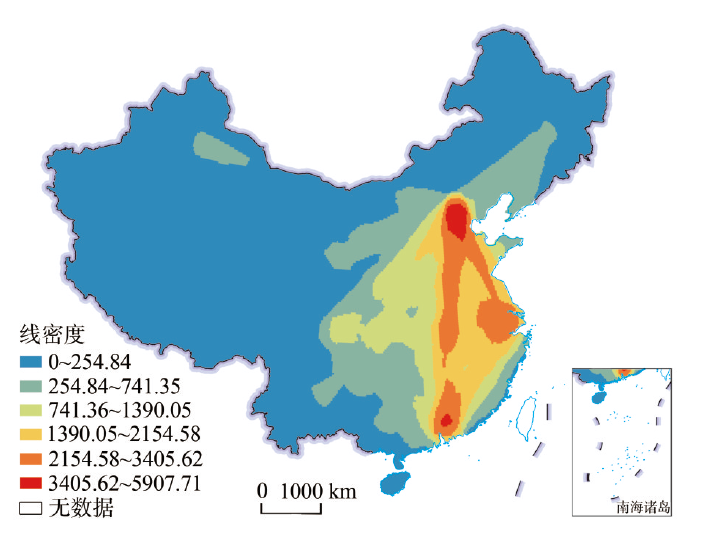
With the rapid development of economic globalization and regional integration, the connection between cities is increasingly close. The mobility and interdependence of elements have promoted the formation of city network and become a new regional organization model and spatial structure. Based on Tencent's migration data, this paper constructs a 372×372 relational data matrix, and systematically depicts the city network pattern in China from different modes of transportation. The results show that cities with high network correlation degree are mainly concentrated in the area east of the Hu Huanyong Line, especially in the Yangtze River Delta, Pearl River Delta, Beijing-Tianjin-Hebei region, Chengdu-Chongqing region and other urban agglomeration areas, which have the highest concentration and become the main control power of China's city network pattern; and the cities in the northwest half are at a disadvantage status. According to the amount of migration, the Chinese city network is divided into national, large regional, regional, local and pedestal networks. The city network structure changes with the mode of transportation. When the network level moves down, the number of node cities tends to increase and the network density increases, but the network range tends to shrink. There is a close correlation between the network level and the migration path. National-level network related to air transportation, regional network related to railway transportation, and local network are relevant to automobile transportation. The economic space-time distance of different transportation modes determines the network structure, which is the basic factor that causes the network to differentiate with different paths.

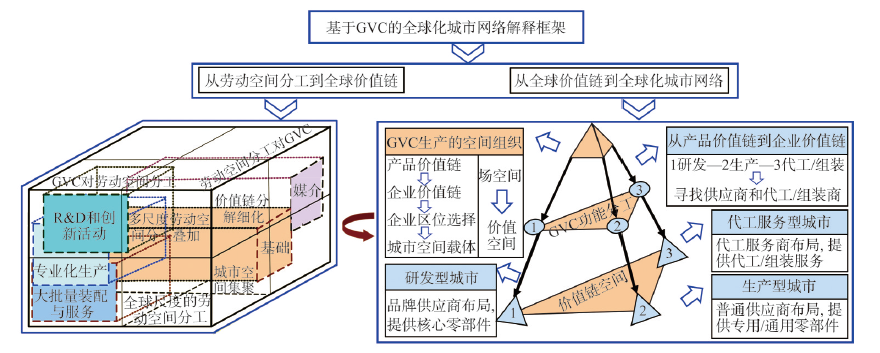
Based on the data of 197 suppliers of iPhone components and parts in 2019, this paper builds multidimensional world city networks from the perspective of global value chains, integrating specialized cities with global functions and the high-class world cities into the same analytical framework, which enriches the research perspective of world city networks in the era of globalization to a certain extent. The purpose of this paper is to expand the research and investigation scope of the existing field of world city networks. By means of social network analysis (i.e. the analysis of centrality, connectedness and network cohesion), rank-size rule and community detection, we study the power and prestige, the overall topological structure, the community structure and influence mechanism of the city networks of R&D-oriented, production-oriented and OEM service-oriented types. The results show that: (1) All the world city networks are characterized by polycentricity and diversification, differentiation of nodes' status and dependence on external connections. The "star" nodes in the network coexist with high power and high prestige, and the power is generally higher than the prestige. (2) The network cohesion and rank of R&D-oriented cities are the highest, and the network tends to show a primate city distribution, and the growth of small group structure and the phenomenon of R&D clusters are obvious. The production-oriented network has the highest connectedness, and it tends to present a rank-size distribution and an equilibrium structure. Its network scale is large, but the ties of many nodes are sparse and decentralized; OEM service-oriented network has the highest relative centrality, and power and information are concentrated in a few city nodes. (3) The cluster characteristics of R&D-oriented city communities are most noticeable. Moreover, the network has significant long-distance knowledge spillover and cooperation behavior. Enterprises form specialized clusters in R&D-type cities through non-tradable interdependence, and obtain the benefits of localization economies and spatial integrated effects. The cluster tendency of production-oriented city communities are relatively obvious. Geographical proximity and spatial dependence are the main factors incubating community structure. Enterprises form generalized clusters through tradable interdependence to obtain the benefits of urbanization economies and distance attenuation effect. No obvious cluster network has been incubated in OEM serviced-oriented city communities. Polarization phenomenon of the inter-community is extremely significant, that is to say, the core city community in Taiwan, China, radiates to other low-level equilibrium communities, forming a radial community structure. Contract manufacturers seek the cities with low labor costs around the world to carry out standardized production, and realize full competition through scale economies, therefore, a scatter-type city network layout structure is formed.
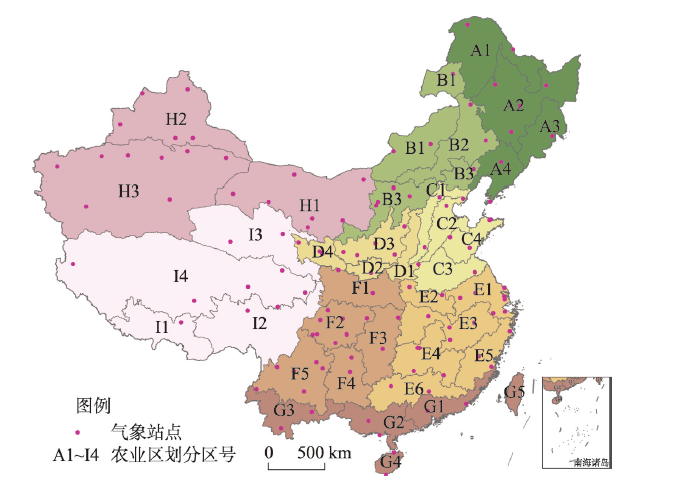
?ngstr?m-Prescott equation is the recommended algorithm for calculating the radiation coefficients for the Penman-Monteith formula, which is the standard method for reference crop evapotranspiration recommended by the Food and Agriculture Organization (FAO) of the United Nations. The calibration and optimization of as and bs coefficients in the equation is the key to accurately calculate the surface solar radiation. This study aims at obtaining the ?ngstr?m-Prescott equation coefficients as and bs, which are optimized for China's comprehensive agricultural areas. The monthly average solar radiation (Rs) (from Dataset of Monthly Values of Radiation Data from Chinese Surface Stations) and srelative sunshine duration data (from Dataset of Monthly Values of Climate Data from Chinese Surface Stations) at 121 stations during 1957-2016 were collected. Using the data from 1957 to 2010, we calculated the monthly as and bs coefficients for each area through the least squares regression. Then, taking the observation values of Rs from 2011 to 2016 as the true values, we estimated and compared the relative accuracy of Rs calculated by regression values of coefficients as and bs and that calculated by FAO suggested coefficients as and bs. The results showed that the monthly average coefficients as and bs of each area are significantly different from the FAO recommended coefficients both temporally and spatially. There are some differences between regions and within regions, and the relative value of as and bs shows the opposite state. The relative error range (0-54%) of solar radiation calculated by the regression as and bs coefficients is small, while the relative error range (0-77%) of solar radiation calculated by the FAO recommended value is large. So, overall, the relative accuracy of Rs calculated by regression values of as and bs coefficients is better than that calculated by the FAO suggested coefficients. The relative error was reduced by 1% to 6%, and the relative error decreases more in winter and spring than in summer and autumn. However, regression values of as and bs coefficients perform worse in some months and some agricultural areas for verification in application. It is said that the regression values of as and bs are not entirely reliable. For each month and each agricultural area, the best scheme is to combine the regression values of as and bs coefficients with the FAO recommended values. Therefore, we chose the as and bs coefficients with the minimum Rs estimation error as the final coefficients and made a coefficient recommendation table for 38 agricultural production and management areas in the Chinese mainland. This study further illustrates the necessity of localization modification of ?ngstr?m-Prescott equation coefficients in application, and enriches the case study of coefficient calibration of ?ngstr?m-Prescott equation in China, which is helpful for improving the accuracy of calculation of surface solar radiation and reference crop evapotranspiration based on existing data.
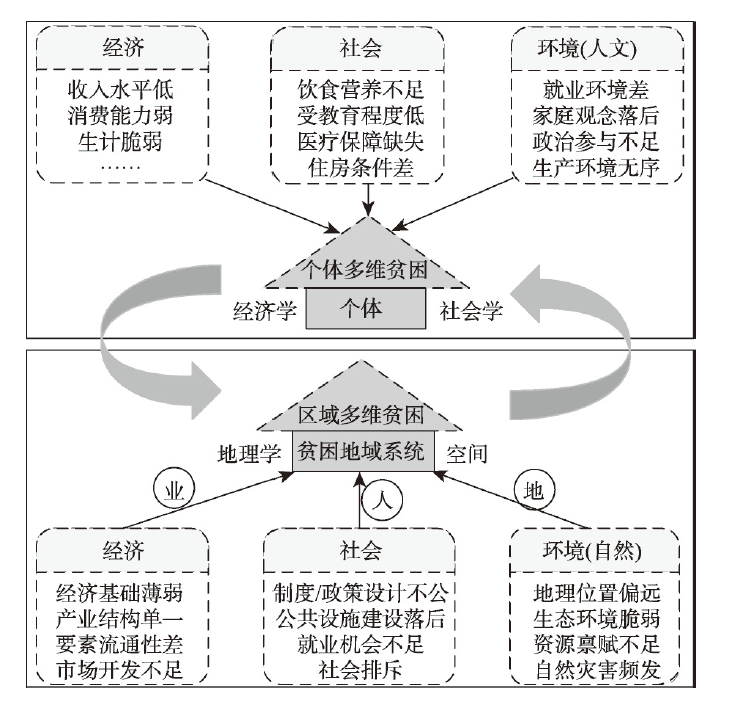
Poverty eradication is a worldwide concern. Regional impoverishment has been considered to be closely related to the geographical environment. Therefore, the relationship between poverty and geographical environment has become the core content of poverty geography. Based on the theoretical basis of regional multidimensional poverty and impoverished areal system, this study constructed a "poverty-environment-economy-society" analytical framework to examine the nexus between poverty and geo-environment. On this basis, taking 124000 poverty-stricken villages as the research object, this study used the methods of spatial autocorrelation, kernel density analysis and geographical detector to depict the spatial geographical pattern of China's poverty-stricken villages in the new era, quantitatively detect the leading factors of the regional differentiation of poverty-stricken villages, and reveal the interaction mechanism between the village impoverishment and the geographical environment. The main conclusions can be drawn in the following three aspects. First of all, poverty and the geo-environment interact with each other, and the paths and manifestations of the interaction between the two are complex and diverse. In general, factors leading to village poverty can be detected from the two categories of nature and humanities and the three dimensions of environment, economy, and society. Environmental factors play a fundamental role in the evolution of poverty, economic factors are the most direct and important contributor to impoverishment, and social factors have a magnifying effect on poverty. Secondly, the distribution of poor villages in China has obvious spatial agglomeration characteristics. The spatial distribution pattern of poverty-stricken villages across the country is consistent with the basic geographic pattern depicted by the Hu Huanyong Line and the three-level topography, with obvious vertical and slope differentiation characteristics. The poor villages in China are spatially distributed with one first-level core area, five second-level core areas and seven third-level core areas. Last but not least, the spatial distribution pattern of poor villages in China is the result of the interaction of multiple factors. Topography, natural resources endowment, labors, transportation and public services were identified as the main contributors to spatial differentiation of poor villages in China. Interaction detection results indicated that the driving force between two-factor interaction is stronger than that of a single factor, and the interaction types are non-linear enhancement except for topographic factors and location. Facing the 2030 UN Sustainable Development Goals, China needs to establish the long-term mechanism to effectively link up poverty reduction, rural revitalization, ecological civilization construction, territorial space optimization and urban-rural integrated development, so as to stimulate the endogenous development momentum of poverty-stricken areas and promote regional sustainable development.
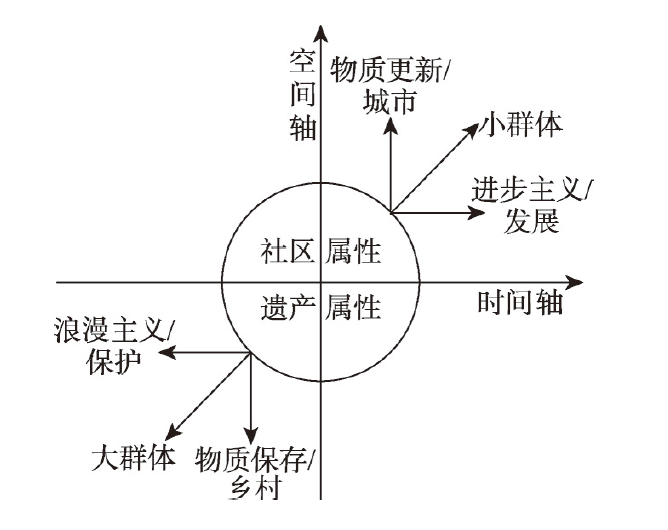
As important carriers of Chinese civilization, traditional villages are endowed with rich and diversified values. Although the government and academia have implemented lots of programmes on protections and researches, the sustainable development still has a long way to go. Therefore, it is of profound significance to establish an evaluation system for the sustainable development of Chinese traditional villages and to evaluate the sustainable development level of Chinese traditional villages. Through long-term field survey of traditional villages, this study proposes that understanding the two basic attributes of community and heritage is the key to cognizing the sustainable development of traditional villages. Then it uses the analytic hierarchy process and Delphi method to construct the index system of community development subsystem and heritage protection subsystem, and applies an expert judgment matrix and the Delphi method to determine the index weights of the subsystems at all levels, and constructs the systems of data collection, assignment, and standardization for each secondary index. The comprehensive evaluation index is used to evaluate the development level of traditional villages, and determine the criteria for ranking. In order to better evaluate the sustainable development level of traditional Chinese villages, a coupling coordination model is further introduced to construct an evaluation system. Finally, through the evaluation of 10 traditional Lingnan villages in Guangzhou, Foshan and Zhongshan cities of Guangdong province, the validity of the index system is verified and further revised. This index system can not only promote the research paradigm of traditional villages, coupling degree and sustainable development assessment, but also widely guide and apply to the protection practices of traditional villages in China.
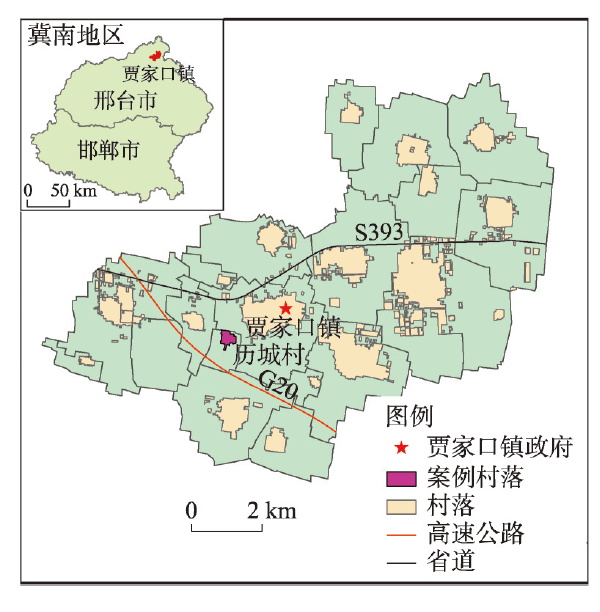
The scientific understanding of the transformation process and rules of agricultural settlement since the reform and opening-up after 1978 is very important to revitalizing and improving the agricultural economy and living condition. In this paper, we take a small village, Licheng, Ningjin County of Hebei Province as an example to explore the transformation process and development mechanism of agricultural settlement from settlement space, economic situation and social life since the reform and opening-up. In this case, some conclusions can be drawn as follows. (1) The total space of construction area increased significantly, with the gradual enlargement of residential space and the expansion of industrial land along the edge of the old village. Three stages have been identified, namely, slow development, rapid expansion, and high speed reconstruction. (2) With the continuous improvement of agricultural mechanization and farm products commercialization, the proportion of non-agricultural income increased gradually, indicating more and more commercial production and consumption in farmers' daily life. The transformation of village economic situation also has gone through three stages: agricultural livelihood stage, part-time agricultural and part-time non-agricultural livelihood stage, non-agricultural and part-time agricultural livelihood stage. (3) Due to the enlargement and reconstruction of social relation between villagers, the transformation of villagers' social life went through three stages: traditional rural life stage, separation of occupation and residence stage, and partly empty-nest elderly and partly empty-nest stage. (4) Natural endowment, behavior representatives (village committees, peasant households, and enterprises), urban-rural interaction, and policy environment respectively play roles of basic binding force, internal pushing force, external pulling force, and space-economy-society regulating force in the transformation of agricultural villages, which interact and jointly promote the transformation and development of agricultural settlements. A new concept of town and village co-community was proposed. It will provide a theoretical reference for implementing the strategy of rural revitalization and solving the dilemma of agricultural settlement transformation in China.
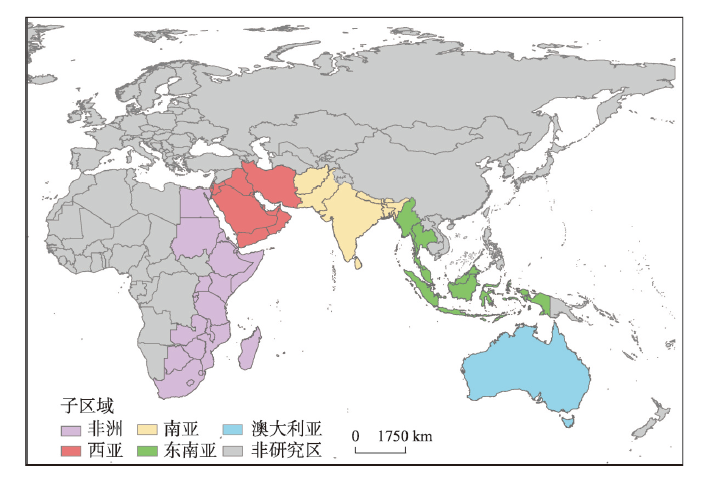
The Indian Ocean Region (IOR) has become a crucial area for China, because it not only notably affects the country's international trade and energy security (especially oil), but also encompasses many countries under the Belt and Road Initiative. With advances of the Belt and Road regional cooperation, an important aspect is to strengthen trade and investment with a number of countries in the IOR. To facilitate China's development of better trade relations with the countries in the IOR, quantitatively investigating the trade links between the IOR and the globe and subsequently providing a better understanding of the trade competition patterns of the five major powers (i.e., the United States, Japan, China, India, and Australia) in this region are crucial. This study aimed to investigate the evolutions of the IOR's position in the global economy, spatial structures of its regional trade, and geo-economic competition patterns of the five major powers in this region from 1992 to 2017. To better identify the characteristics of these evolutions in the IOR, a sequential clustering method was employed to divide the period of 1992-2017 into four phases with the proportion data of merchandise trade volume of each country in the IOR as the basis. The results are summarized as follows. (1) The IOR's position in the global economy generally exhibited an increasing trend from 1992 to 2017, as indicated by the upward trends in the IOR's global shares of its regional trade volume, its regional eigenvector centrality, and its regional GDP. Furthermore, the spatial structures of the IOR's countries varied from "dual-core" (comprising Singapore and Malaysia) to "multi-core" (including India, the United Arab Emirates, Singapore, Malaysia, Australia, and Thailand). This was indicated by the clustering patterns of the countries based on each country's trade volume and eigenvector centrality. (2) The extent of the intra-regional trade integration of the IOR remained at a relatively low level despite that it generally showed a rising trend from 1992 to 2017. (3) The geo-economic influence of both the United States and Japan in the IOR declined from 1992 to 2017, as indicated by the downward trends in the trade dependence of the 47 countries (excluding India and Australia) in the IOR on the two countries. However, China's geo-economic influence in this region gradually increased and exceeded those of the United States and Japan in the third phase. India's geo-economic influence also showed an upward trend, but it was inferior to those of China, the United States, and Japan. Further, Australia's geo-economic influence remained the weakest in the entire period. This study quantitatively reveals the variations in the geo-economic patterns of the IOR from three aspects, i.e., its global trade position, extent of its intra-regional trade integration, and geo-economic competition patterns of the five major powers in the IOR. Moreover, the research framework and methods used in this study can also be used to investigate the geo-economic patterns of other regions (e.g., the Belt and Road region and the free trade zone of Regional Comprehensive Economic Partnership).
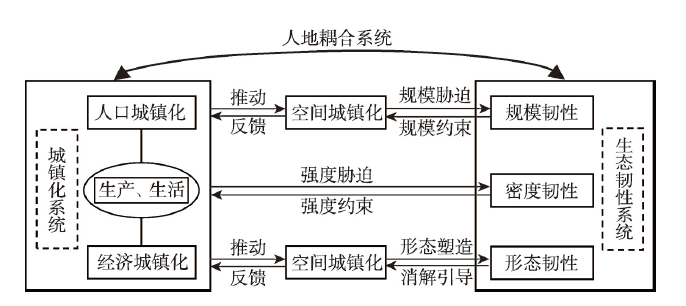
Urban resilience is an emerging research topic of urban studies, and its essence is the ability of cities to resist, recover and adapt to uncertain disturbances. This paper first constructs a "Size-Density-Morphology" urban ecological resilience evaluation system, and then uses the coupling coordination degree model to measure the degree of coupling coordination between urbanization and ecological resilience in the Pearl River Delta from 2000 to 2015, and conducts an in-depth discussion on its temporal and spatial characteristics. The results show that: (1) From 2000 to 2015, the urbanization level of cities in the study area generally increased while the level of ecological resilience declined. The coupling coordination degree between the two systems decreased from basic coordination to basic imbalance. (2) In terms of spatial distribution, the coupling coordination degree between ecological resilience and urbanization of cities presented a circle pattern that centered on the cities at the mouth of the Pearl River and increased toward the periphery. (3) Ecological resilience subsystems played different roles in the coupling coordination between urbanization and ecological resilience. Specifically, size resilience mainly played a reverse blocking role; the influence of morphological resilience was mainly positive and continued to increase over time; the effect of density resilience was positive and continued to decline and further became negative after falling below zero. Leading the coordinated development of regions with new urbanization, and improving ecological resilience by strictly observing the three areas and three lines, adapting to ecological carrying capacity, and rationally arranging urban green spaces, are the main path for achieving coordinated and sustainable development of urbanization and ecological resilience in the Pearl River Delta in the future.
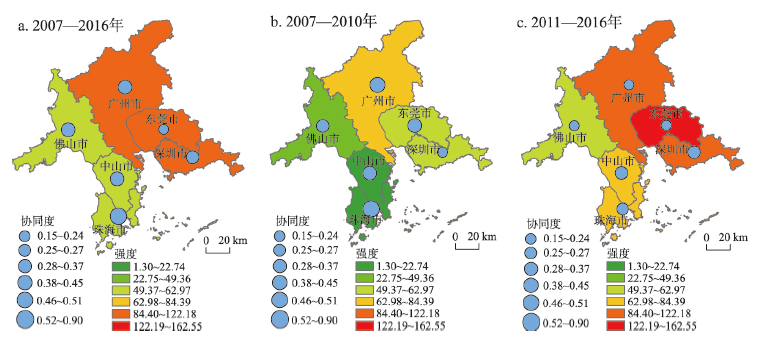
Foreign Direct Investment (FDI) is divided into analytical, synthetic, and symbolic types according to the knowledge base type. The innovation policy in the core area of the Pearl River Delta in 2007-2016 has been textually analyzed and quantitatively assessed from the policy tools perspective to understand the situation of the innovation policy environment. Based on this, the polynomial logistic regression model was used to investigate the impact of the study area's innovation policy environment on the location choice of FDI with different knowledge-based types. By doing this, results are obtained as follows: (1) The time and space differentiation of the innovation policy environment is obvious. The turning point is found in 2010. After that, the innovation policy intensity significantly increased, while the degree of synergy decreased. The intensity of innovation policy does not match with the degree of synergy, both of which show a wedge-shaped spatial structure, but the spatial heterogeneity of them is obvious. (2) The intensity of the synergy of innovation policy environment has significant positive effects on FDI location selection, while the degree of its impact on the heterogeneous knowledge base of FDI varies. The regional innovation policy environment optimization makes it more likely to be the target of analytic and synthetic FDI location selection. (3) Enterprise entry mode, government attitude and layout area have a significant impact on FDI location selection. The impact of business service levels on FDI location selection is significantly positive, while the impact of urban population density and agglomeration economic level is significantly negative. These bring important inspiration to local governments to implement more localized innovation policies and to attract differentiated knowledge base of FDI to build regional competitive advantage.
Economic geographers have long argued about the location of emerging industry. Under the background of Sino-US trade war, exploring the location laws of emerging industries is not only a critical theoretical issue, but also has an important guiding significance for the country to cultivate emerging industry. Starting from the debate between "Regional Branching" and "Windows of Locational Opportunity", this paper identifies that knowledge flow is the key to affecting the location of emerging industry. According to the discussion of the relationship between variety and technological innovation in the related variety hypothesis, we use patent citation data to define related and unrelated variety. Then we use panel spatial autoregressive model to measure the specific impact of each factor in this paper. Finally, we can draw the following conclusions: (1) Beijing, Shanghai and Dalian are the three major knowledge flow centers of China's fuel cell industry. The strong connection between these "growth pole" cities is the basis of the current spatial pattern of knowledge flow, while the role of geographical proximity is not significant. (2) The related technology knowledge base has a stable and significant positive effect on knowledge absorption capacity, and most of the control variables are significantly positive except labor cost. The unrelated technology knowledge base has a significant negative impact in the early stage (the regression coefficient in the first stage was -0.038). Because of the different roles of different knowledge bases and control variables in the early stage (more positive effects and less negative effects), the overall spatial pattern is not only concentrated in the developed cities, but also has some freedom. The research results show that the anchoring effect of knowledge base on innovation is obvious, so "Regional Branching" is more likely to appear in the era of knowledge economy. (3) The impact of unrelated variety has gradually changed from negative in the early stage (-0.038) to positive in the final stage (0.079), which shows that the role of unrelated variety may change with the technological development of emerging industry. We should re-examine the role of unrelated variety from an evolutionary perspective.
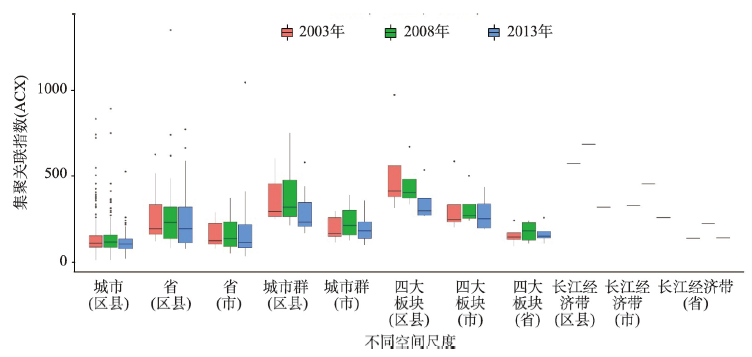
In order to promote the formation of a regional economic location with complementary advantages and high-quality development, it is necessary to examine the spatial pattern of Chinese industry from the perspective of industrial relatedness. Agglomeration is a common spatial pattern of industry. We construct two indices by combining coagglomeration and input-output linkages to analyze spatial relatedness. The first index is used to measure relatedness of agglomerated industries (hereafter ACX index). The second index is used to measure agglomeration of related industries (hereafter CXI index). Then, we use two-digit data from Chinese industrial enterprises database and measure the proposed indices to answer the following 2 questions: (1) whether the spatial relatedness is different at different spatial scales, and (2) what makes the difference in spatial relatedness. We find that more coagglomerations in a region do not mean that the ACX index is large. The ACX index of Chinese industry presents an inverted U-shaped distribution from 2003 to 2013. Comparing different spatial scales, we find that there is a positive correlation between the ACX index and size of the researched space, however, there is a negative correlation between ACX index and size of the basic unit. Comparing similar spatial scales, we find the ACX index is larger in city clusters and the Yangtze Economic Belt. These differences are mainly due to the existing regional governance system, the industrial composition of the region and external shocks. Different regions and industrial composition will evolve into different industrial spatial patterns. Therefore, it is necessary to create networks of cities and towns based on city clusters and the Yangtze River Economic Belt, so as to enhance industrial division and urban cooperation. In this way, the optimal regional economic location and coordinated regional development would be achieved.
To scientifically assess the effects of major public health emergencies on economic system, regulate its negative effect and improve the resilience of the economic system is an important national strategic requirement. Currently, the novel coronavirus disease (COVID-19) epidemic has been effectively contained in China, while exogenous and regional risks remain. Systematical identification of influence path and strength of COVID-19 epidemic on economic system has guiding significance for economic system recovery. Based on the improved multi-regional computable general equilibrium model for China, this research measures the output changes in economic system and major industries in China under different COVID-19 epidemic prevention and control scenarios with different changes in factors supply and products demand. The results show that the provincial economic growth in China falls by 0.4%-0.8% compared with the normal situation in 2020, and residential consumption and employment falls by about 2% and 0.7% respectively, while commodity prices rise by about 0.9% in the short term. From the perspective of industrial economy, consumption-oriented and labor-intensive industries are the most adversely affected in the short term. For example, the output value of the service sector will decrease by 6.3% compared with normal levels. Besides, regarding the regional differences of the effects of COVID-19 epidemic on the economic system and industrial economy, Hubei province, as one of the regions with first-level epidemic prevention and control risk, faces the greatest challenge. The effects of COVID-19 epidemic present a spatial spreading pattern with Hubei province as the center. The major industries that suffer from the impacts of COVID-19 epidemic vary in different regions. In addition, this research assesses the intensity of the regional economic recovery under the resumption of work and production scenario and the proactive fiscal policy scenario respectively. The results show that compared with the resumption of work and production, the effect of increasing fiscal stimulus has more potential for economic system recovery, up by 0.3% in GDP and by 1.8% in commodity price, while resumption of work and production has a wider range of spatial pulling effects on industries.