Poverty among older people in urban areas is growing along with population ageing and urbanization in China, but the absence of proper indices and method to measure urban elderly poverty brings difficulty to the understanding of the spatial pattern of elderly poverty in cities and policy making in poverty reduction. It is necessary to consider the association of elderly poverty with education, health, family relationship and social support levels of older people and set poverty cutoff more appropriately. With a factor analysis method, we develop a resource-based poverty index to identify poor older residents on the basis of survey data in eight typical residential communities in Beijing. Then, the elderly poverty rates for different residential communities are estimated and the spatial patterns of urban elderly poverty are investigated. It is found that, (1) resource, health, independence and age factors interpret the variation of older residents, among which the score of resource factor constitutes an appropriate indicator of urban elderly poverty. (2) Elderly poverty rate differs significantly for different types of residential communities. With the spatial distribution data of various communities being considered, the poverty rate of elderly population in Beijing is estimated to be 9.55%. (3) The elderly poverty rate of town centers away from the central city is the highest and the poverty rate drops down from the outer to inner areas of the central city gradually. The density of the elderly in poverty, on the other hand, goes to the highest in town centers and the inner city areas, followed by outer central city and the fringe of the central city. These results provide evidences for the formulation of urban policies against elderly poverty in the city.
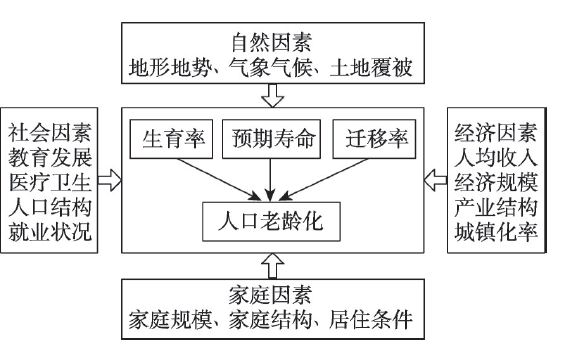
Since the 1970s, great progress has been made in research on the spatio-temporal pattern of population ageing at multiple spatial scales by both domestic and foreign scholars. However, the analysis of the process mechanism of regional ageing is still insufficient. Based on the county-scale data in 2000 and 2010 censuses, the spatio-temporal pattern of population ageing is statistically analyzed. Moreover, the Structural Equation Model (or SEM) is developed to explore the path relationship between various variables. Consequently, the influencing mechanism of regional ageing process is thoroughly revealed. The main results are as follows. Firstly, the line from Baotou City of Inner Mongolia autonomous region to Tengchong County of Yunnan province (or BT Line) is a geographical demarcation of regional ageing disparities in China. Southeast of the BT Line witnesses contiguous areas of higher ageing counties which interspersed with lower ageing counties, whereas northwest of the BT Line is a continuous area of lower ageing counties with just one middle-level ageing belt located in the north margin. Secondly, the fitting results of SEM interpret the influencing mechanism of regional ageing disparities in China. Thirdly, life expectancy, fertility and migration are three endogenous factors of regional ageing process. Thereinto, life expectancy has significantly positive effect, while fertility and migration have significantly negative effects on regional ageing. Lastly, geographical environment has significant direct and indirect effects on regional ageing in China. In general, the income increase, social progress, and the improvement of living conditions and natural environmental quality would enhance regional ageing level, otherwise the improvement of urbanization level would decrease regional ageing level.
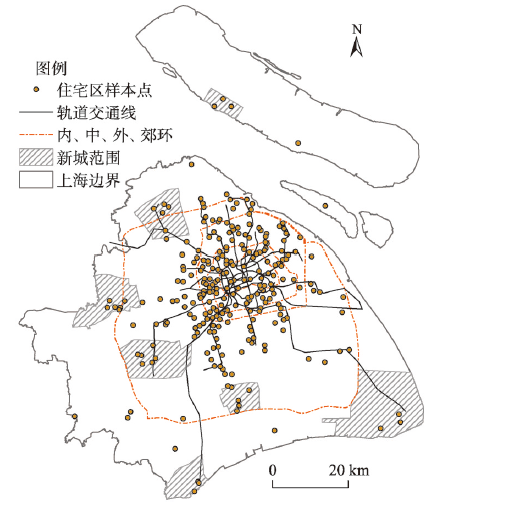
The employment space of a residential quarter is widely affected by factors including housing properties and the neighboring supply of transportation and employments, which forms numerous spatial diagrams. Investigating and understanding the exemplar patterns of the employment space are thus crucial before we make targeted planning policies. Taking Shanghai as a case study and using mobile signaling data, this paper endeavors to extract typical patterns and distinguish the key factors. After the users' home and work locations are inferred, the employment space of 253 residential quarters is characterized in combination of the kernel densities estimation and the probability density analysis of commuting distance. We extracted five spatial patterns, namely, single-nucleated, ribbon-shaped, dual-nucleated, multi-nucleated, and decentralized, and highlighted several transitional patterns between them. Moreover, several factors are considered significant: the accessibility of employment centers and subway stations is a dominant factor that determines the global distribution of the patterns, while housing type is the secondary factor which leads to local variations and transitions. Finally, an integrated portrait covering the whole city area is summarized in terms of how different factors can be combined to explain the employment space of any quarters. We believe that our findings can help make planning policies regarding spatial structure optimization, industrial spatial adjustment, and housing development.
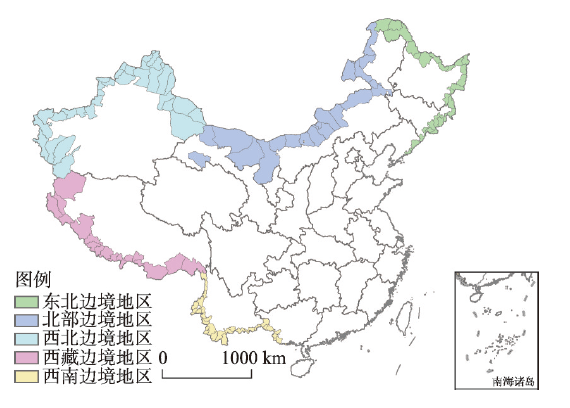
Border area is not only an important gateway for inland opening-up, but also an critical part in the building of a moderately prosperous society and optimizing national urban spatial pattern in China. Due to the location, natural resources endowment, and traffic accessibility, the urbanization development is relatively slow in border areas. Therefore, border area is a special area that should be given close attention, especially under the background of the Belt and Road Initiative and China's regional coordinated development program. Based on the county-level data from 2000 to 2015, this paper tries to analyze the spatio-temporal pattern of urbanization in 134 border counties, and applies the geographical detector method to study the driving forces of urbanization in border areas. Conclusions are as follows: (1) From 2000 to 2015, urbanization rate in border areas was lower than the national average, and the gap was widening. Some border counties in southern Xinjiang, Tibet, northeast of Inner Mongolia, and Yunnan, are even facing the problem of population loss. (2) In the same period, urbanization rate in the northwestern and southwestern borders is low, but it grows relatively fast compared with other border counties; urbanization rate in Tibetan border area is the lowest and grows relatively slowly; urbanization rate in the northeastern and northern border areas is slightly higher, but it grows slowly or even stagnates. (3) Transportation and industry are the important driving forces of urbanization in border areas, while the driving forces of market is relatively weak. And there are obvious mutual reinforcements among the driving forces, while the effort of resource force increases obviously after interaction. (4) Urbanization rate in the northwestern and southwestern border areas grows relatively fast, with industrial power and transportation power, market power and administrative power as the main driving forces. Tibetan border area has the lowest urbanization rate and growth rate, as the driving force of urbanization with strong contribution has not yet formed in Tibet. In the northeastern and northern border areas, the contribution of transportation power to urbanization is greater than that of other forces, and its interaction with market and industry has obvious effects on urbanization.
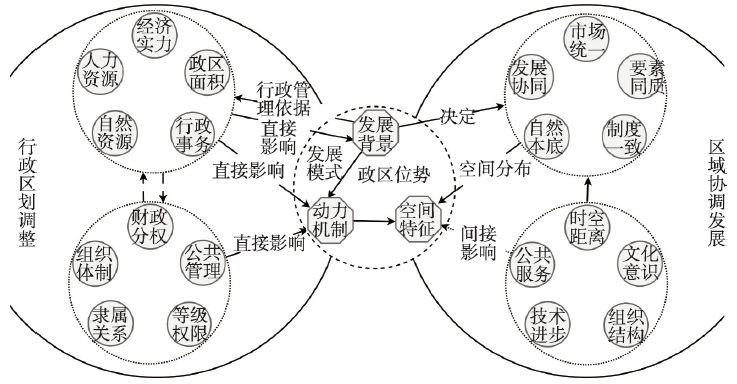
Administrative divisions are the important foundation of national governance and social development, and the adjustment of administrative divisions is a critical way to promote regional coordinated development. Under the background of globalization and regionalization, timely adjustment of administrative divisions is a major step to reconstruct the regional development pattern and change the administrative rank potential energy of relevant regional governments. In the perspective of regional coordinated development, this paper constructs a regional administrative rank potential energy model based on the theory of regional interaction, spatial field energy model and power exponential function. Taking Hefei-Wuhu region as an example, this paper examines the change of administrative rank potential energy and its effect on regional coordinated development after the dismantling of the former Chaohu prefecture-level city. The results show that: (1) administrative rank potential energy is closely related to the administrative jurisdiction, administrative resources and the potential of regional coordinated development. (2) During 2005-2015, the growth rate of the overall administrative rank potential energy and coordinated development potential of the study area increased from 61.79% and 0.21% before the withdrawal of prefecture-level Chaohu city to 116.51% and 3.05% respectively. After the adjustment of administrative divisions, the growth rate of administrative rank potential energy is much higher than that of economic development and population increase. (3) The model of administrative rank potential energy can measure and express the adjustment of administrative divisions spatially. The result of the model is different from the complex influence brought by factors such as social development, which accords with the real status of social and economic development. The adjustment of administrative divisions focuses on both individual development and regional integration. It can not only significantly improve the administrative rank potential energy of the study area, promote social and economic development, but also help to break down spatial barriers and administrative barriers, and promote regional coordination and sustainable development.
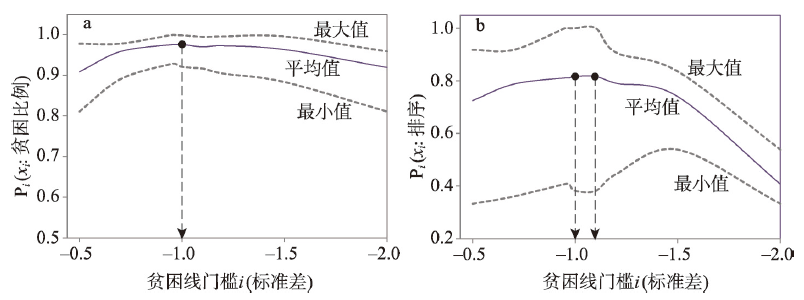
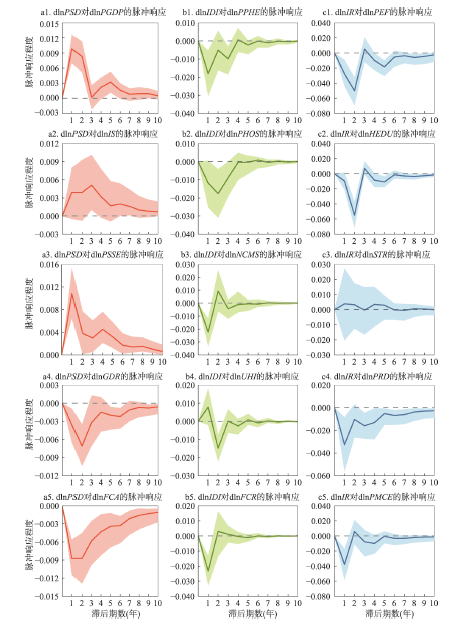
Exploring the poverty supervision evaluation indicator system and the dynamic characteristics of spatio-temporal interaction of poverty among regions are of great significance to the current research on sustainable poverty reduction in China. From the perspective of development geography, this paper introduces panel vector autoregressive (PVAR) model and identifies poverty-causing and poverty-reducing factors in China in combination with human development approach and global indicator framework for the SDGs, so as to measure multidimensional poverty index. Then it uses exploratory spatio-temporal data analysis (ESTDA) method to reveal the spatio-temporal interaction characteristics of multidimensional poverty. The results show that: (1) The poverty-causing factors of China's current poverty monitoring and evaluation include the crop-to-disaster ratio and social gross dependency ratio, the poverty-reducing factors include per capita GDP, per capita social security expenditure, per capita public health expenditure, number of hospitals per 10,000 persons, participation rate of new rural cooperative medical scheme, vegetation coverage, per capita education expenditure, number of universities, per capita scientific research and experimental development (R&D) expenditure, and per capita funding for cultural undertakings. (2) From 2007 to 2017, provincial income poverty, health poverty, cultural poverty and the multidimensional poverty have been significantly improved, with the national comprehensive poverty level declining by an average of 5.67% annually, and the poverty of different dimensions in some provinces is differentiated. (3) During the study period, the local spatial pattern of multidimensional poverty between provinces had strong spatial dynamics and showed an increasing trend from the eastern region to the central and western regions; the multidimensional poverty index among provinces shows a strong spatial dependence over time, forming a pattern of decreasing from the northwestern and northeastern regions to the surrounding areas. (4) The spatio-temporal network of multidimensional poverty interaction in neighboring provinces is mainly negatively correlated with Shaanxi and Henan, Shaanxi and Ningxia, Qinghai and Gansu, Hubei and Anhui, Sichuan and Guizhou, and Hainan and Guangdong, forming spatially strong cooperative poverty reduction relationships. The research results have important reference value for the current implementation of China's strategy on targeted measures in poverty alleviation, especially the prevention of poverty-returning after 2020.
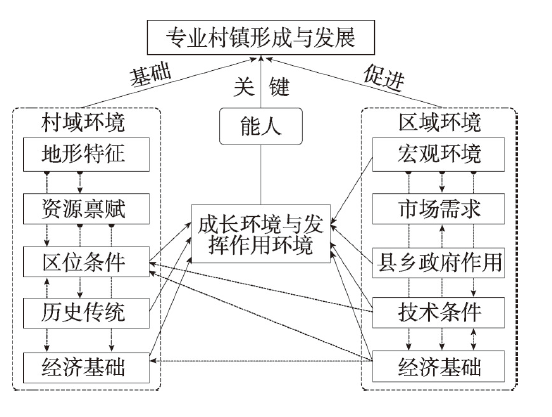
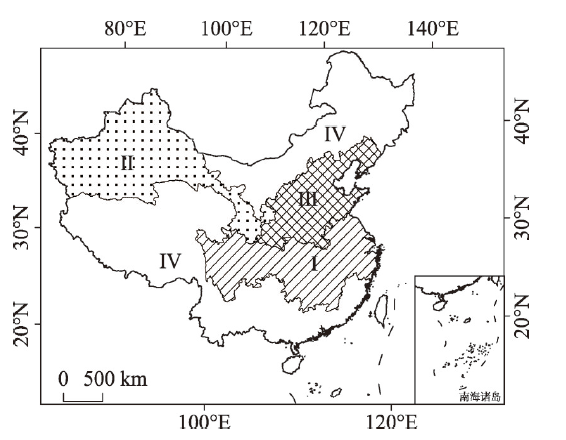
Specialized villages and towns has significance to agricultural transformation & upgrading and rural vitalization strategy. With the data of "One Village One Product" Demonstration Villages and Towns from the Ministry of Agriculture and Rural Affairs of the People's Republic of China, this paper revealed the spatial pattern of specialized villages and towns in the whole country. It also analyzed village-level factors (i.e. topography, resource, location) and region-level factors (i.e. market and economic foundation) from the national and agricultural regionalization scale using Geodetector model. The results showed that: (1) 83.64% of specialized villages and towns mainly concentrated to the southeast of the "Hu Line", presenting central agglomeration and gradient descent from the North China Plain-the Lower Reaches of Yangtze River Plain to south and then to northwest. (2) The products of specialized villages and towns were mainly fruits and vegetables, accounting for 59.45%. They were distributed mainly in the Huang-Huai-Hai Plain, Guanzhong Plain, the Middle-lower Reaches of Yangtze River Plain, Sichuan Basin, etc., as well as circle distribution centered on the provincial capitals. (3) The distribution of specialized villages and towns was more influenced by region-level factors than by village-level factors, and the explanatory value of market and economic factors was 0.30 and 0.19, respectively. The influence of topographic factor was more obvious than that of other village-level factors, with the explanatory value being 0.15. (4) These factors presented regional differences. The main factor affecting the distribution of specialized villages and towns was market in the northern plain and hilly region; topographic and resource factors dominated the agro-pastoral ecotone and plateau region; market, economic foundation and location factors had a joint effect in the northwestern and Tibetan Plateau regions. There were no prominent factors in the southern hilly and plateau area. This study has important scientific reference value for improving agriculture's level of specialization, identifying and cultivating specialized villages & towns and rural revitalization poles, and realizing the rural vitalization strategy.
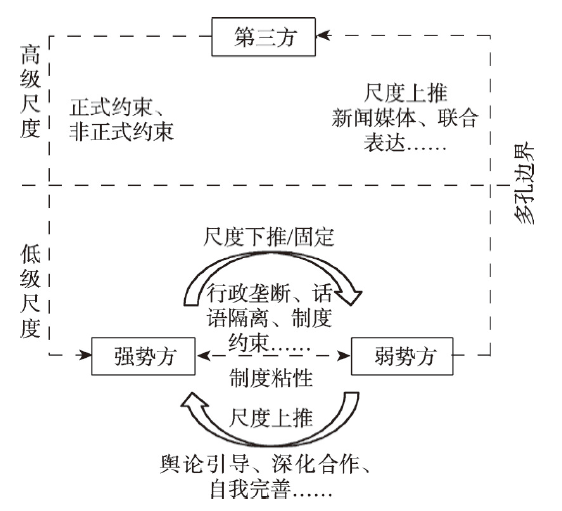
Watershed eco-compensation is a significant economic, social and environmental policy for cross-regional ecological governance and natural region protection in China. As a typical geography research proposition, it involves the difference and coordination of the regional stakeholders' rights, regional ecological coordinated development and cooperation model construction. This paper introduced the institutional stickiness into the politics of scale theory, analyzed the game behavior of the government-led eco-compensation in the Xin'an River basin, and explored the game characteristics and game mechanisms of governments at all levels. The results imply that the game among the central government, provincial government, municipal government and other government departments have gone through three stages: competition, cooperation and competition-cooperation. Building a community of government interests can promote the construction of watershed eco-compensation, and the "moderate intervention" of the central government is the key to carry out trans-provincial watershed eco-compensation. There is obvious institutional stickiness in the transition process of watershed eco-compensation system from "vertical" model to "vertical-horizontal" model. Government subjects use institutional constraints such as policy innovation and social participation to dilute the institutional stickiness and reshape the watershed eco-compensation system. Scale transformation is the core mechanism to promote eco-compensation in the Xin'an River basin. Government subjects shape the discourse system of watershed eco-compensation by redistributing power and capital and embedding informal constraints, so as to promote the transition of eco-compensation in the study area from "strong state-weak society" to "strong state-strong society" structural model. The research results can provide the theoretical support for the construction of trans-regional watershed eco-compensation mechanism, and form the scientific basis for the evaluation and guidance of watershed eco-compensation practice in the coordinated and sustainable development of watershed economy and society.
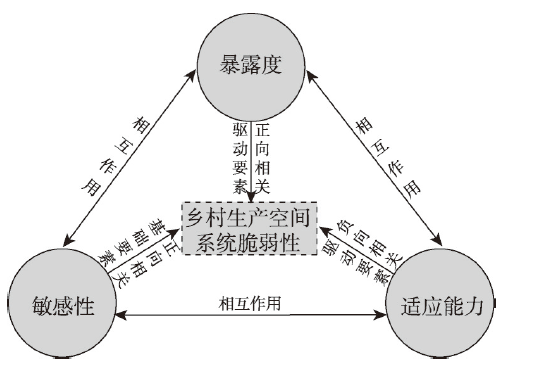
Vulnerability, one of the major properties of rural production space system (RPSS), is an effective measure in how system will be susceptible to negative effects or damage, as well as the way to achieving sustainable development of the system. This study establishes an evaluation index system and model of the vulnerability of RPSS and quantitatively measures the RPSS vulnerability of Chongqing from 2007 to 2017 to reveal its spatio-temporal differentiation. Accordingly it identifies vulnerability types and proposes targeted regulation strategies. The results are shown as follows. (1) The vulnerability of the RPSS is a comprehensive measure of the operating state of the system consisting of exposure, sensitivity and adaptability. It embodies the balance relationship of mutual influence and interaction that lies between rural diversified subjects centered on "human" and the rural production space centered on "land". (2) On the whole, the exposure of the RPSS shows an upward trend and a spatial pattern of "partly prominent, high in the north and low in the south"; the sensitivity shows a downward trend of fluctuation and a spatial pattern of "high in the east and low in the west"; the adaptability shows a rapidly increasing trend and a spatial pattern of "high in the west and low in the east". The overall vulnerability of RPSS presents a downward trend and the spatial pattern of "high in the east and low in the west". (3) After dividing the vulnerability of the RPSS into four types, namely, including adaptability type, exposure-sensitivity type, sensitivity-adaptation type, and strong comprehensive type, and based on the principle of "ecological priority - classified regulation - highlight emphasis - local adaptation", this study proposes differentiated "vulnerability reduction" strategies for different types, so as to guide the sustainable development of RPSS.
Based on the distribution data of cotton production in China from 1950 to 2015, the study aims to investigate the spatio-temporal changes and gravity center migration path in cotton production, area and yield in China by methods of time-series trend and spatial analysis. Then, contribution rates of cotton area and yield to the changes of cotton production are quantified. The results indicate that: (1) China's cotton production and yield showed an overall upward trend over the past 65 years. Among them, the production increased by 521.44×10⁴ t and the yield increased by 1381.83 kg/hm2. After five periods of violent fluctuations, stable development, and three ups and downs, the cotton area was basically the same compared with the year 1950. (2) There was a large regional gap between cotton yield and cotton area, but the overall trend was increasing. The variation trend of cotton yield per unit area was stable, among which the annual fluctuation of cotton production in the inland cotton area of northwest China was the largest. (3) From 1950 to 2015, nearly 87% of China's cotton-growing regions increased their production, about 63% of the regions decreased cotton area, and more than 70% of the regions increased cotton yield. The production and yield of the three major cotton areas have increased, but the growth rate has been decreasing. The northwest inland cotton area had the smallest shrinkage, and it was also the main area for China's cotton area growth. (4) China's cotton production has formed a "southeast-northwest" pattern. The main production area has changed from the Yellow River basin to the northwest inland; the cotton production and area center of gravity have moved to the northwest, with a total moving distance of 1947 km and 1398 km, respectively. From 2010 to 2015, the moving speed was the highest, reaching 140 km/a and 159 km/a, respectively; the production center of cotton in the northwest inland area moved from Hotan to Aksu. The basin cotton area was moved from Lu'an to Huanggang, and the Yellow River basin cotton area was moved from Handan to Liaocheng. (5) The contribution of national cotton production has gradually changed from yield dominance to area dominance. From the perspective of cotton regions, cotton areas in the Yangtze and Yellow river basins have gradually changed from yield dominance to area dominance, and the northwest inland cotton areas have been driven by area.
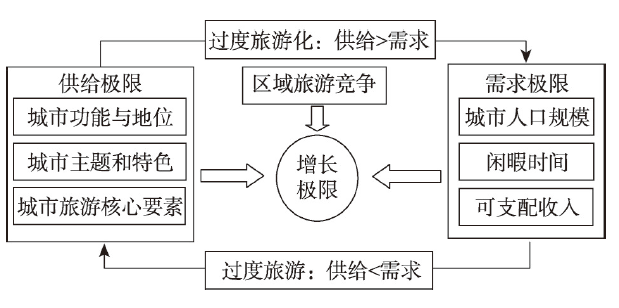
The growth of urban tourism has received wide attentions from tourism geography. Over the past four decades, China has been witnessed rapid, continuous and non-limit growths of urban tourism in most cities. The local governments and developers were encouraged by this miracle of past growth expectation or plan to a more optimistic glowing future. However, the urban tourism is an open and high mobility subsystem of city system, and its growth is stable and faces limits from both supply and demand sides for a certain period. When tourist demand exceeds its supply, it will lead to overtourism. Oppositely, when tourism supply exceeds tourist demand, which will result in over tourismification. The growth of urban tourism demand curve is stepped. Only when the long-term influencing factors of urban tourist demand continue to undergo major changes, can the growth of urban tourism break through the original limit and enter a new stage. The limit of urban tourist demand stipulates the urban tourism supply and determines the scale and level of tourist facilities such as scenic spots, hotels, restaurants, and shopping mall which are cater to the need of urban tourists within a certain period. This study defines a phenomenon of over tourismification as the status of tourism supply over tourist demand, which is manifested as three conditions: whole over-supply, partial over-supply and no over-supply but facing negative reaction to tourism growth by enterprises and locals. This study also proposes an analytical framework on limits to growth of urban tourism and uses it to empirically analyze urban tourism of Zhuhai city. It is found that middle- and high-end tourist demand of the study city has been stable and faced limit since less constant change in function, status, features and image of Zhuhai city took place and more intense competition from surrounding cities occurred in the past decade. This indicated that the supply of middle- and high-end hotels and other tourist facilities in Zhuhai reached a saturation point and any new more such tourist facilities will make for over tourismification. The conditions of breaking through limit and the relationship between growth of urban tourism and tourism development were discussed and suggestions on the improvement of tourism statistics in China were also proposed.
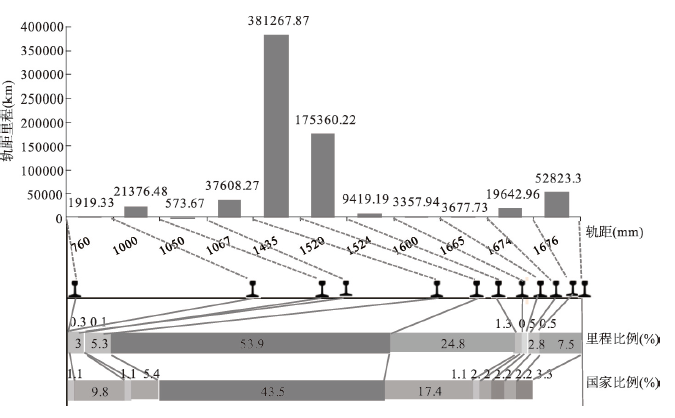
The railway is an important geospatial element as well as an indispensable feature of a nation's infrastructure. It is a material element of a nation's transport network, and it also has social, national defense, military, and even political attributes. Therefore, it has a profound impact on the geographical system, which intensifies the spatial differentiation and reconstruction of the terrestrial system. This paper defines the conceptual connotation and basic characteristics of the railway ecosystem, and analyses the railway network structure, including its gauge structure and national distribution. Secondly, taking Eurasia as the research area, we explore the geographical differentiation of the Eurasian railway network, including gauge differences, the rail system, and the organization of the transport system. Thirdly, this paper investigates the dynamic mechanisms leading to the formation of the Eurasian railway geo-system, with a particular focus on technology dissemination, path dependence, geopolitics, and national defense. Finally, a geographic model of the track gauges of railways in Eurasia is developed. It is found that a complex pattern of railway gauge differences has been formed in Eurasia. Among the numerous railway regulations, three main types of gauge are identified, including 1520 mm, 1435 mm, and 1067 mm. Considerable variation in the coverage of different track gauges is apparent, which provides a physical and technological basis for railway system differentiation and network fragmentation. We find that eight geo-systems in continents of Europe and Asia are strengthened, which divide the Eurasian continent into discrete regions. These differences that geo-systems extend across different numbers of countries, have led to the formation of distinct geopolitical relationships, with five separate track gauge expansion modes, and a geographical confrontation between the 1435 space and 1520 space track gauge areas.
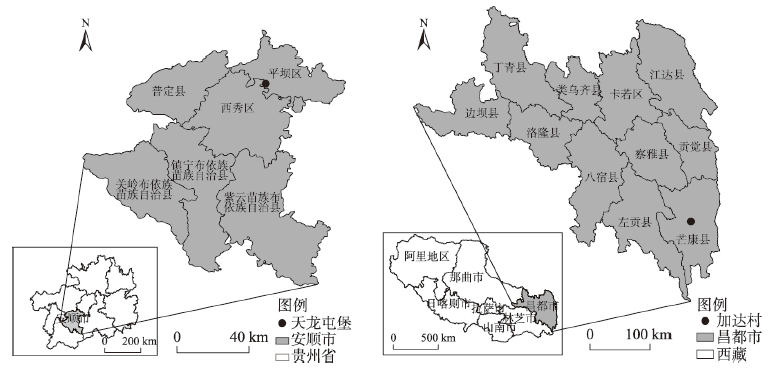
Ritual has become an excellent field for space research and theoretical interpretation due to its symbolic and social nature. In the research of ritual and ritual space, the social relationship behind ritual and its impact on ritual space have not been fully taken into account. This study takes Tunpu Dixi and Bamabadian as examples, using the method of interview, observation and literature analysis, to trace back and analyze the process and characteristics of two ritual space productions, describe the social relations that participate in and influence the ritual space production, deeply analyze each dimension of ritual space and the ternary interactive practice of space production, and try to compare and present the impact of tourism development on the changes of local traditional rituals. The study found that the traditional ritual space is shaped by the social relations of the ritual subjects, and its space production is essentially a process of "restructuring or debugging" social relations and spatial order. In the ritual space production under the influence of tourism, the differentiated interactive relationship between the spatial representation and the representational space creates the differentiated ritual space practice. In addition, the ritual space production implies the resistance to the dissolution of modernity. This study builds a theoretical framework for traditional ritual space production, and provides a new perspective for interpreting and deepening Lefebvre's space ternary interaction, in order to reveal the deeper connection between tourism and local cultural changes.
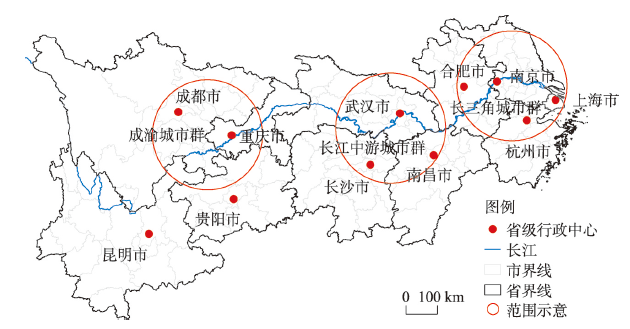
The spatial difference between regional tourism efficiency and tourism scale is evident. It is of great theoretical and practical value to dynamically grasp the spatial-temporal evolution characteristics and the coupling coordination relationship of them to promote the high-quality sustainable development of tourism. This paper measures the tourism scale of 126 city units in the Yangtze River Economic Belt from 2001 to 2018. The DEA-MI model was introduced to measure and decompose tourism efficiency, while the exploratory spatio-temporal data analysis method was used to explore the spatial and temporal characteristics of regional tourism differences and spatial structure. In addition, the coupling coordination degree model of tourism efficiency and scale was established to examine the coupling superiority and synergy consistency of the two. The results demonstrated the following: (1) the spatial difference in comprehensive tourism efficiency of the study area was recognizable. The average situation exhibited the spatial distribution characteristics of "high in the east and west and low in the middle", and inter-annual changes decline in fluctuations. Scale efficiency played a supporting role in overall efficiency, and technical efficiency played a restrictive role. (2) The fluctuation range with the local spatial structure of tourism efficiency and tourism scale was relatively small, and the direction of dependence was relatively stable. The volatility of the latter is slightly stronger than that of the former, and the change of spatial dependence direction is comparable. The competitive situation of local spatial structure of tourism efficiency was stronger than that of cooperation, and the integration of tourism scale cooperation was strong. (3) The local spatial structure of tourism scale was relatively stable as it was was difficult to change the relative position of the city unit. However, the local spatial structure of tourism efficiency was still unstable, and it was likely to change the possibility within the city unit. (4) The overall coupling degree and coupling coordination degree of tourism efficiency and scale were gradually improved with similar spatial and temporal differentiation characteristics. There was spatial heterogeneity and volatility in local evolution, and the high value region of the degree of coupling coordination generated a broader range and slower diffusion.
In such an era of great transition, the migrants in China are on the horns of a dilemma — they cannot integrate into the cities, while the home villages are no longer their warm harbors. To help them acclimatize to the places of migration, constructing migrants' place meaning is a feasible solution, which therefore is a fundamental and urgent topic in the field of place research from the mobility perspective. One construction that researchers have used to understanding the human-environment connections is place meaning, which however has not been clearly defined and accurately measured in the previous studies. By employing the Q method and scale development, Study 1 investigates the dynamic nature of place meanings from the migrant's perspective, and develops a theoretical framework to explain the construction of place meanings. Through data analyses we identify four dimensions of the place meaning-self-identity, the interaction between migrants and others, the interaction between migrants and physical attributes, and synthetic interactions among migrants, others and physical environments. These interactions exist in a geographical framework consisting of nature, social relationship, and values. Study 2 designs a measuring scale of place meaning, which contains four dimensions with 20 items. Through the Exploratory Factor Analysis and Confirmatory Factor Analysis, the results verify that the theoretical model of place meaning is valid and acceptable. In addition, this paper also leads to a discussion on the nature, the identification and the characteristics of the migrants' place meaning. This study has enriched and improved the concepts of place and place meaning and their system structures, which have partially responded to the theoretical and practical needs to extend the research on migration and human-environment connections.
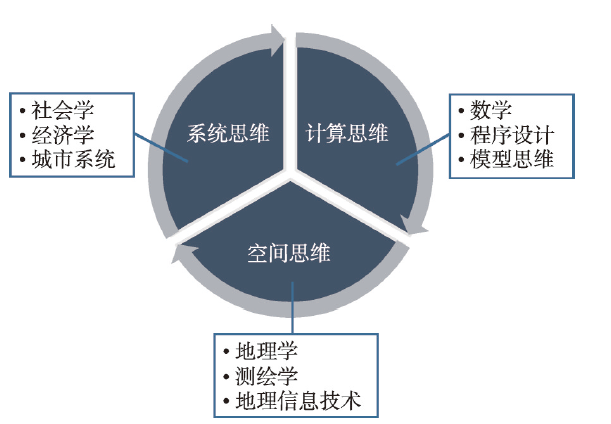
GIScience is facing challenges in defining its discipline-specific knowledge and skills due to the rapid development of computer science. Meanwhile, the research paradigm of urban studies is shifting to more quantitative approaches with the emerging big data and various analytics tools. Based on the development pathways of GIScience, we argued that one direction of the future GIS is urban informatics by taking the advantage of spatial modelling and analysis technologies. The transformation from GIS/Geomatics to urban informatics requires transdisciplinary knowledge, methods, and tools to form a new teaching and research framework. An undergraduate curriculum for urban informatics is proposed in this paper based on the notion of transdisciplinary cooperation among GIS, computer science and urban studies, to foster system thinking, spatial thinking and computational thinking in urban informatics teaching. Researchers and educators from urban studies, geography, geomatics and GIS should work together to promote the development of this emerging discipline, so as to achieve more significant scientific discovery and innovations.