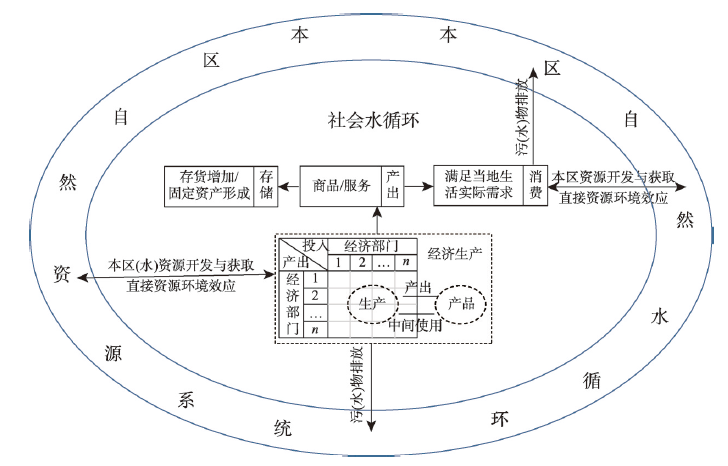
The continuous and intense human activities have greatly changed the structure, path and driving force of the natural water cycle evolution, which conversely influences the water security of human being. With the process of globalization and market economy, human activities not only affect the artificial development of water and soil resources, but also extend to the economic field. The "flow" of water trade contained in product has become an important internal factor that drives the evolution of the regional water cycle and affects regional water security. Traditional water cycle research, which focused on the watershed scale, is difficult to reveal the linkage, two-way feedback mechanism and co-evolution dynamic mechanism in water cycle among different regions. Starting from the phenomenon of continuous and water-intensive agricultural products export in Northwest China, this research elaborates the phenomenon, the process, the structure and their driving forces of the unitary natural water circular, nature-human society binary circular, and trading water circular within multi-regional social economic complex systems by theoretical analysis. We explicated the theoretical framework for constructing the "natural-social-trading" ternary water cycle in the inland river basin, including mode of process, driving force of water cycle, conceptual model, influencing factors and ecological environment effects. Furthermore, we discussed the frontier of water cycle research in inland river basin based on ternary water cycle model-social hydrology. We advocated that the future study on water cycle and water resources should focus more on the external forces driving the water cycle of the inland river basin and its two-way mutual feedback and co-evolution, providing theoretical references for the decision-making of water security, ecological environment security and ecological civilization construction in inland river basins.
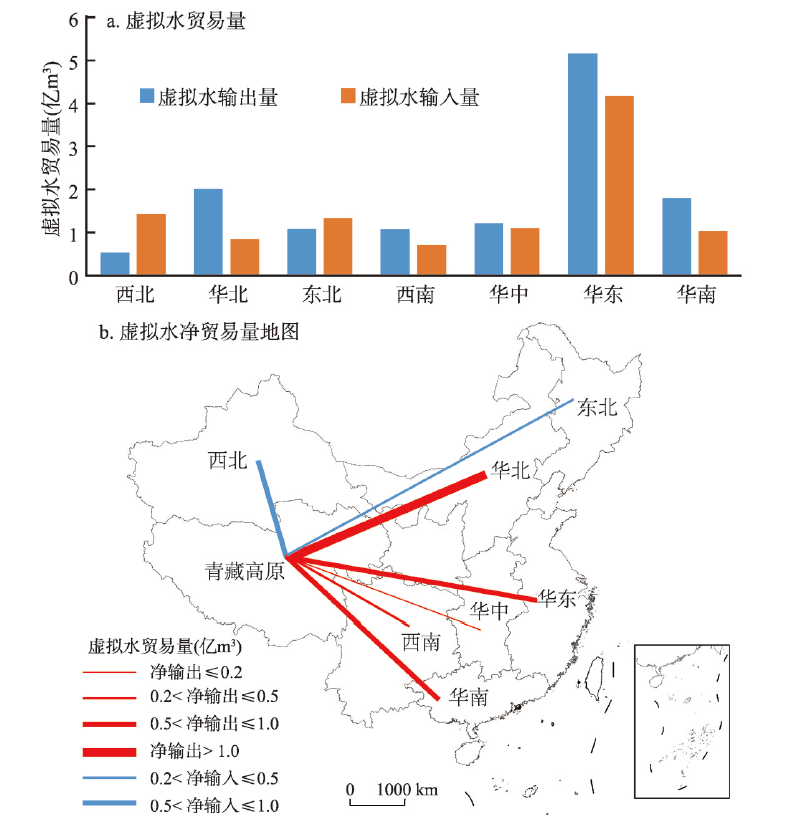
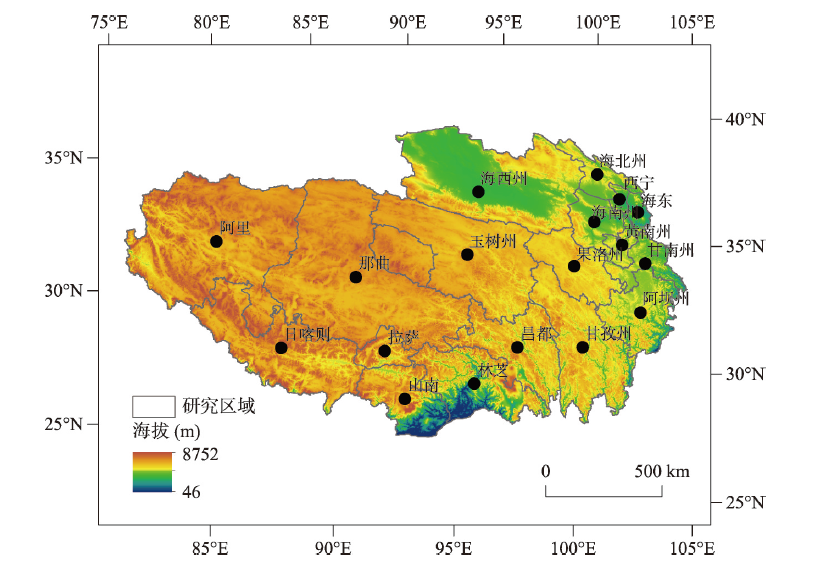
It is essentially important to protect water resources and water eco-environment in the Qinghai-Tibet Plateau, the Asian water tower. Understanding water transfers through the trade of different products and services (i.e. virtual water transfers) and their influencing factors between Qinghai-Tibet Plateau and external regions can aid in analyzing local water resources problems and making virtual water strategies. Based on the China multi-region input-output table in 2012, this study calculated the virtual water transferred between Qinghai-Tibet Plateau and other regions in China. The virtual water transfer network comprising urban and rural nodes was constructed. Influencing factors that determine net virtual water trade of Qinghai-Tibet Plateau with other regions were analyzed using the Logarithmic mean Divisia index method. The results indicated that Qinghai-Tibet Plateau delivered a total of 0.23 billion m3 net virtual water to other regions in China. It delivered net virtual water to Southwest, North, Central, East and South China, and received net virtual water from Northwest and Northeast China. Intensive virtual water transfers between urban and rural regions were found. In the Qinghai-Tibet Plateau, production-based water footprint was higher in rural areas, whereas consumption-based water footprint was higher in urban areas due to high population density and consumption level. The node strength in rural areas of Qinghai-Tibet Plateau was higher than that in urban areas. In the plateau, the products transferred to other regions were dominated by agricultural products, which led to 1.27 billion m3 of virtual water export. The Qinghai-Tibet Plateau had a trade deficit with other regions, which resulted in 0.86 billion m3 of net virtual water export. Water use efficiency led to 0.18 billion m3 of virtual water export from the plateau. Water management policies were formulated towards sustainable water resources use. Irrigation water conservation needs to be implemented to reduce production-based agricultural water footprint, and urban inhabitants' consumption corresponding to a lower water footprint should be encouraged. In addition, net import of various products and water resources ecological compensation will be beneficial to water resources protection in the Qinghai-Tibet Plateau.
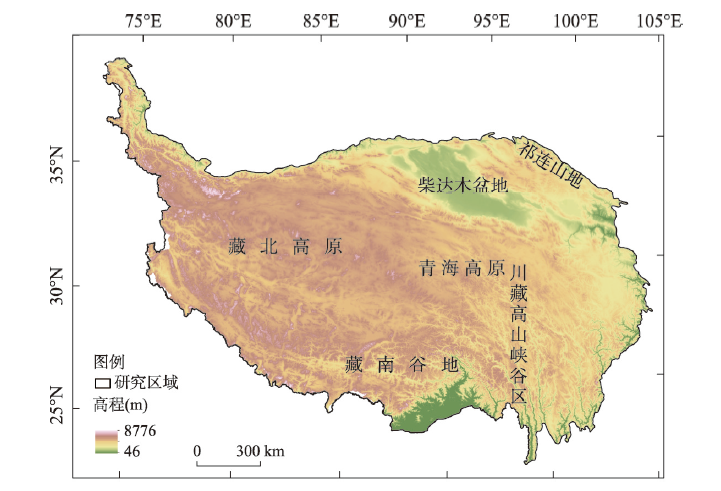
Relief degree of land surface (RDLS) is one of the key indicators in the fields of suitability assessment of human settlements (SAHS) as well as resources and environmental carrying capacity (RECC) evaluation at the regional scale. Currently, there is still a lack of in-depth research on the determination of the optimal window size for the RDLS calculation and evaluation and its correlation analysis with two topographical parameters, e.g., elevation and relative height difference. These issues further affect the effective representation of the RDLS in the delineation of local to regional topographic relief. Therefore, an objective understanding of the RDLS in the Qinghai-Tibet Plateau of China greatly contributes to promoting the construction of national ecological security barrier and regional green development. In this study, based on the 30 m Advanced Spaceborne Thermal Emission and Reflection Radiometer (ASTER) Global Digital Elevation Model (GDEM Version 2), the optimal window size for calculating and evaluating the RDLS in the Qinghai-Tibet Plateau was accurately determined using the average change-point method, and the first 30 m RDLS thematic map for the Qinghai-Tibet Plateau was generated accordingly. Next, the interrelation between the RDLS and elevation and relative height difference was quantitatively examined. Based on that, the effective representation or geographical meanings of the RDLS in the plateau were defined. The results/conclusions include: (1) The optimum window size for the RDLS calculation and evaluation in the study area based on the 30 m GDEM is a rectangular neighborhood of 41×41 pixels, equaling to an area of about 1.51 km2. The average change-point analysis approach shows that the optimum window size for regional RDLS analysis is unique. (2) The average RDLS of the study area is approximately 5.06, along with over 60% of the plateau ranging between 4.5 and 5.7. On the whole, the topographic relief increases from the northeast to the southwest and west parts. Gentle to small-relief landforms are mostly seen in the Qaidam Basin, the Southern Tibet Valley, and the Hehuang Valley (Yellow and Huangshui river valleys). Also, the differences in the local surface relief in varied latitudinal sections (along the mountain range) are small, while those at longitudinal level are big, showing hierarchical and regular fluctuations (crossing the mountain trending). (3) Correlation analyses showed that different values of the RDLS in the plateau correspond to geomorphic units with different elevations and relative height differences. The profile characteristics of the mountains in the Qinghai-Tibet Plateau based on different terrain reliefs indicate that the height above sea level of low mountains steadily increases first, then experiences sudden rise and severe fluctuation in surface relief, and finally forms the orderly ups and downs of the extreme mountains, e.g., the Himalayas.
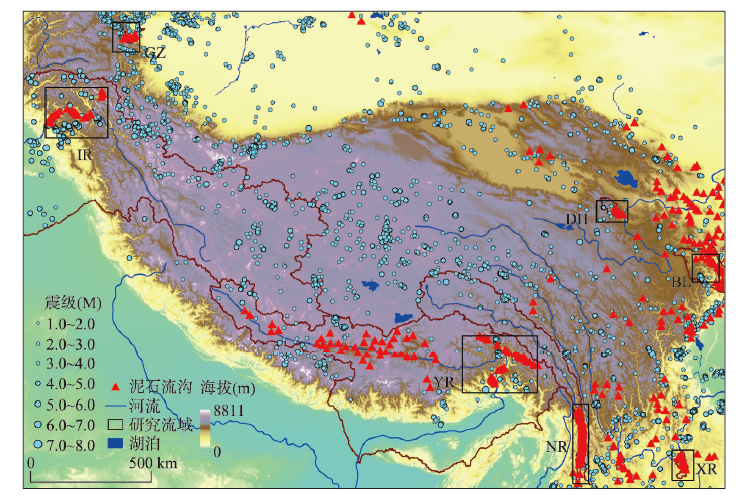
The edge of the Qinghai-Tibet Plateau is characterized by high topographic relief, significant tectonic motion, extreme precipitation, and densely populated active debris flow gullies. It is essential to scientifically categorize the debris flow gullies to understand their mechanisms, prevent and mitigate debris flow disasters, and find out strategies to restore the ecology. The present study carried out topographical measurements and statistical analyses of seven regions on the edge of the Qinghai-Tibet Plateau, in which active debris flow gullies are concentrated. The debris flow gullies are classified into three types by means of nonmetric multidimensional scaling. Type I is formed by rainstorms in exposed bedrock areas, Type II is formed by glaciers in exposed bedrock areas, and Type III is formed by rainstorms in depositional basins. The variation in landforms of the three types is analyzed using Kruskal-Wallis tests. The sources of loose material and the characteristics of water flow and sediment transport in all the three types of debris flow gullies are discussed from the aspects of geology, topography, and climate. It is shown that the activity of Type II increases along with the warming of the Qinghai-Tibet Plateau, and the activities of types I and III increase along with the frequency of extreme rainfalls.
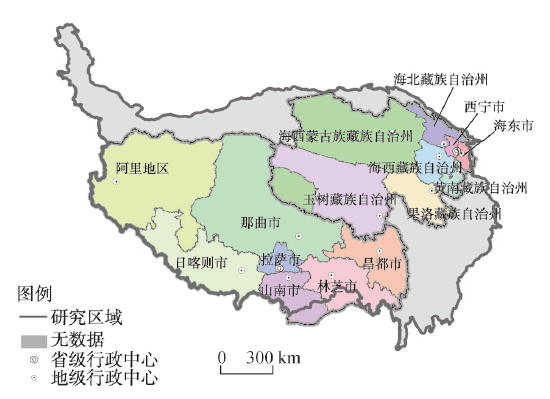
Scientifically assessing the interaction between urbanization and eco-environment in the Tibetan Plateau is critical for optimization of urbanization speed and quality, and for the restoration and improvement of the eco-environment. Based on previous studies about the interaction between urbanization and eco-environment in the Tibetan Plateau, we established complete analysis models to examine the overall process, including comprehensive evaluation index analysis, coupling coordination degree measurement, coupling type identification, decoupling path exploration, and future trend prediction. We used a multi-scale comparison analysis method to clarify the differences between scales (across the Tibetan Plateau and its provinces and prefecture-level cities), identify the problem regions, and propose customized improvement measures. Here we show that the comprehensive evaluation index of urbanization has experienced a staged upward trend in different scales, and the overall urbanization index of Qinghai is higher than that of Tibet. However, the changing trends of the eco-environment index are different. The changes in eco-environment index of Qinghai show a decreasing trend, whereas Tibet's changes tend to be stable. The eco-environment index of prefecture-level cities is stratified. We also found that the changing trends of coupling coordination degree of urbanization and eco-environment in different scales were overall rising. The coupling type has changed from imbalanced recession type to nearly imbalanced recession type, and finally to grudgingly coordinated development type. However, most of these types are lagged urbanization types. The alternate change trend between strong decoupling and weak decoupling indicates a negative interaction between urbanization and the eco-environment at different scales. Thus, it can be inferred that the lagged urbanization is a prominent phenomenon. The result of predication shows that in the next 10 years the coupling coordination degree of urbanization and eco-environment will increase steadily in all geographic units, but there will be a gap in the growth rate.
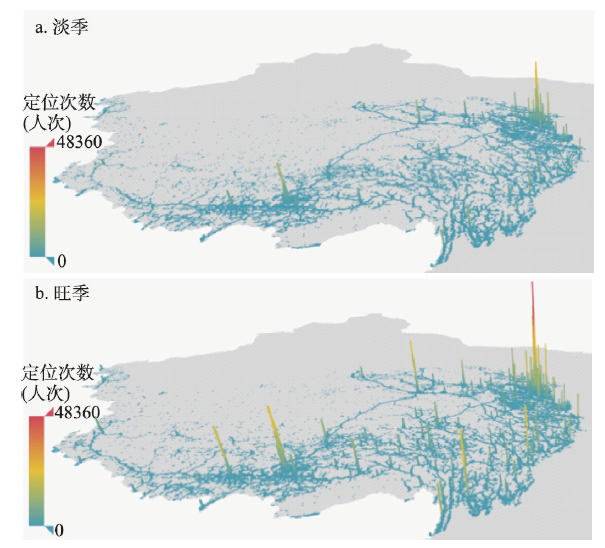
The activities of local people and tourists have great effects on the ecological environment on the Qinghai-Tibet Plateau. Different kinds of activities may cause different impacts on ecology and environment. To effectively protect the ecological environment, it is necessary to study the spatiotemporal patterns of different kinds of human activities. In this paper, two Tencent positioning datasets which record one-week location requests in January and July of 2018, respectively, are used to explore the human activities in off-season and peak season of tourism on the plateau. A Tucker tensor decomposition method is employed to reduce the dimension of massive data and obtain the principle modes of human activities. The data in off-season are decomposed into 3 daily patterns, 3 hourly patterns and 8 spatial patterns, and the data in peak season are decomposed into 2 daily patterns, 4 hourly patterns and 8 spatial patterns. By analyzing the core tensor, different kinds of activities are inferred through the relations among different dimensions of data, and the human activities in off-season and peak season of tourism are analyzed. The human activities on the Qinghai-Tibet Plateau are found to be different from those in other places. Different from ordinary weekday and weekend patterns, there is a mid-week pattern (Tuesday through Friday) and an inter-week pattern (Saturday, Sunday and Monday) on the Qinghai-Tibet Plateau, and there is a special holiday pattern in off-season of tourism. It is also found that the human activities in off-season and peak season of tourism are different, which indicates different activities of the local residents and the tourists. In off-season of tourism, the positioning activities are very active in the morning, however, the activities are less active during the daytime of mid-week days than during the daytime of inter-week days, and the activities are mostly found in the cities in the mid-week days but mostly in the outskirts of the cities or on the way to scenic spots in the inter-week days. In off-season, there exist the activities of local residents. In peak season, there are less activities in the morning, but the activities during the day are more broadly distributed both in the mid-week days and in the inter-week days. It is indicated that the activities of tourists are significant in the peak season. After clustering spatial grids with similar patterns, we find that there are mixed spatial patterns in most parts of the study area, which discloses that there are usually multiple kinds of human activities in a region.
In the big data era, data of population migration on the Internet has exerted great influence on conducting researches on the patterns of inter-regional population inflows and outflows. This study, based on Tencent's daily migration data (2015-2018), analyzed and explored the patterns of population inflows and outflows in the Qinghai-Tibet Plateau by means of methods like time series analysis, social networks analysis and space-time statistical analysis, and discussed the seasonal law of the fluid population between the study area and other cities in China and the network features of population interaction. The results indicated that: (1) The population flow in the Qinghai-Tibet Plateau was featured by seasonal variability, which could be represented as four seasons "Low, Medium, Mid-High, High" during the year. From 2015 to 2018, the Qinghai-Tibet Plateau in the interaction network of national urban floating population witnessed an increasing status. The population flow rate improved by 8.2%, and the ranking on the population mobility network increased by 24.5%. Relative to the Low season, the average daily population movements in the Medium season, Mid-High season and High season increased by 14.2%, 26.7% and 57.8%, respectively. (2) The population flow direction lied in the 45° fan-shaped range from NEE-67.5° to SEE-112.5°, and the Qinghai-Tibet Plateau had strong and frequent interactions with the capitals of the surrounding provinces. (3) Most cities across the country attached importance to a continual increase of the intensity of population interaction with the Qinghai-Tibet Plateau, and tourism had played a dominant role in promoting the changing and development. The Hotan and Bayin prefectures in Xinjiang, Chongqing, Guang'an and Meishan in Sichuan, and Sanmenxia in Henan presented a pattern of seasonal rise in the Medium and Mid-High seasons and a pattern of seasonal fall in the High season, reflecting the seasonality of labor export to the Qinghai-Tibet Plateau. In addition, population flow in cities like Turpan, Dongguan and Yuncheng showed a declining trend in the stage of High season as a result of the goods and materials supply relations.
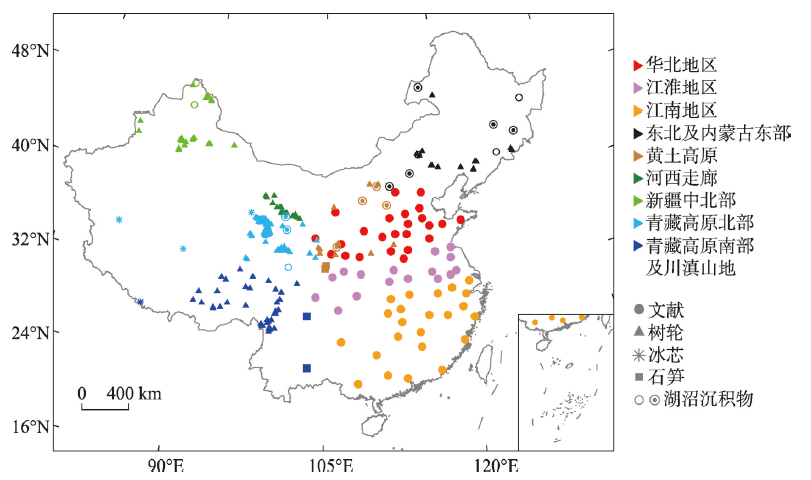
Based on the latest hydroclimatic reconstructions in peer-reviewed scientific journals, we summarize the multi-scale pattern on hydroclimatic changes and assess whether or not the variability of the 20th century is unusual in the context of the past millennium for different regions of China. The main conclusions are as follows: (1) In the central-eastern China, the dry/wet series reconstructed from historical documents after 1400 have high confidence level, while before 1400, the reconstructions only in half of the period have high confidence due to the shortage of records. In northeastern China and eastern Inner Mongolia, centennial-scale reconstructions from lake sediments at multiple sites are in low agreement in most of periods. In Loess Plateau, Hexi Corridor, central to northern Xinjiang, northeastern and southeastern Tibetan Plateau, hydroclimatic reconstructions from tree rings have robust agreement within the same region. (2) All sub-regions of China show significant cycles with 90% confidence level at inter-annual, inter-decadal and centennial scales. The cycles of 2.5 a, 60-80 a and 110-120 a are detected over all the regions, while the cycles of 3.5-5.0 a and 20-35 a mainly occur in the Loess Plateau, Tibetan Plateau, northeastern and central-eastern China. The cycle of quasi-45 a only occurs in northeastern and central-eastern China. Moreover, the hydroclimatic changes are out of phase in different regions. (3) The 20th century is one of the wettest centuries in the past 3000 years in northeastern Tibetan Plateau. However, most series from other regions show that the inter-decadal hydroclimatic variability of the 20th century does not exceed the amplitude of natural variability, which had ever occurred during the past millennium.
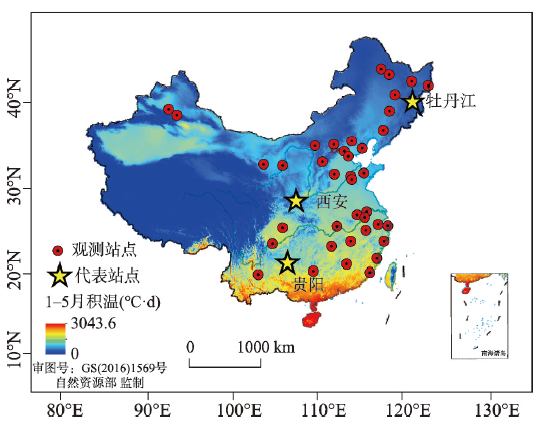
The forcing temperature in spring is the main factor that determines the flowering time of woody plants in the Northern Hemisphere. Global warming has reduced the number of chilling days in winter, which probably alters the thermal requirement of flowering. In the past 50 years, the spatio-temporal changes in the thermal requirement of spring phenology in China remain unclear. Based on the first flowering date (FFD) data of Salix babylonica and Ulmus pumila derived from China Phenological Observation Network during 1963-2018, we used three methods to calculate the thermal requirements of FFD and systematically analyzed their spatial and temporal patterns at representative sites. We also developed chilling days-thermal requirement models to quantitatively simulate the thermal requirement at each site in different years. The results showed that the thermal requirement of FFD exhibited a large spatial difference, with a relatively high value at low latitudes than that at middle latitudes. There was a significant negative exponential relationship between the average thermal requirement and chilling days across sites. The thermal requirements of FFD also changed over time. The trend in thermal requirement of Salix babylonica FFD in Guiyang, Xi'an and Mudanjiang reached 1.28-1.41 °C·d/a (P<0.01), 1.63-1.89 °C·d/a (P<0.01) and 0.12-0.58 °C·d/a (P<0.05) for the growing degree day method, respectively. The thermal requirement of Ulmus pumila FFD also increased significantly in Guiyang and Xi'an, but the trend in Mudanjiang was not significant. The decrease in the number of chilling days was the main reason for the increase in the thermal requirements. Due to the low winter temperature in Mudanjiang, the number of chilling days was large and had a small interannual variation, thus chilling days exerted no significant impact on the thermal requirement. The chilling days-thermal requirement model performed better in simulating the thermal requirement of Salix babylonica FFD, with R 2 of 0.54-0.66. In comparison with Salix babylonica, the model showed a relatively low precision in simulating the thermal requirement of Ulmus pumila FFD, with R 2 ranging from 0.33 to 0.64. Among the three methods, the thermal requirement could be better simulated by the growing degree days method compared with the growing degree days-sigmoid and growing degree hours methods. This study provides an important scientific basis for quantifying the spatio-temporal variation of the thermal requirement of flowering and for predicting the future flowering date of woody plants under the background of climate change.
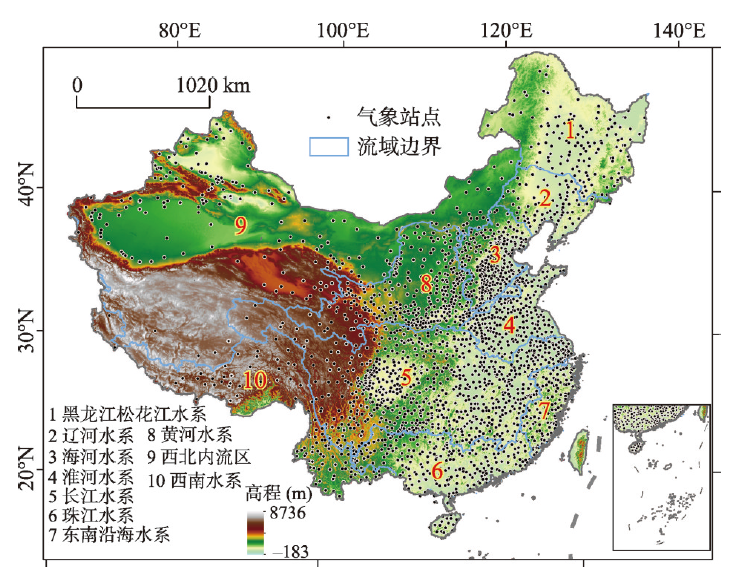
Drought is one of the most severe natural disasters that have widespread impacts on eco-environment and agriculture. Great efforts have been made on the study of the non-stationarity of hydrometeorological processes, while few reports are available addressing non-stationarity in drought index. Therefore, in this study, we attempted to develop a non-stationary standardized precipitation evaporation index (NSPEI) based on standardized precipitation evaporation index and non-stationary theory with the aim of investigating drought conditions across China in both space and time under different emission scenarios from 2006 to 2100. The results indicated that: (1) Stations with non-stationary hydrometeorological processes are concentrated in northeast China, the Huang-Huai-Hai Plain, the Yangtze River Delta, the Tibetan Plateau, the Hengduan Mountains, and the southern Xinjiang. The NSPEI has the best fitting performance at 88% of the meteorological stations considered in this study. (2) Compared with other drought indices, SPEI tends to overestimate the intensity and duration of droughts during evaluations of the future drought changes; while NSPEI avoids the weakness of SPEI in overestimation of drought intensity. Therefore, NSPEI can better monitor the meteorological droughts in China and describe the future drought changes across the country. (3) Drought monitoring results based on NSPEI indicated an increasing drought trend in northern China, and southern China is dominated by a wetting trend under the scenario of low and high emissions. Extreme dry and wet duration and occurrence frequency showed an increasing trend in China in the future under medium and high emission scenarios.
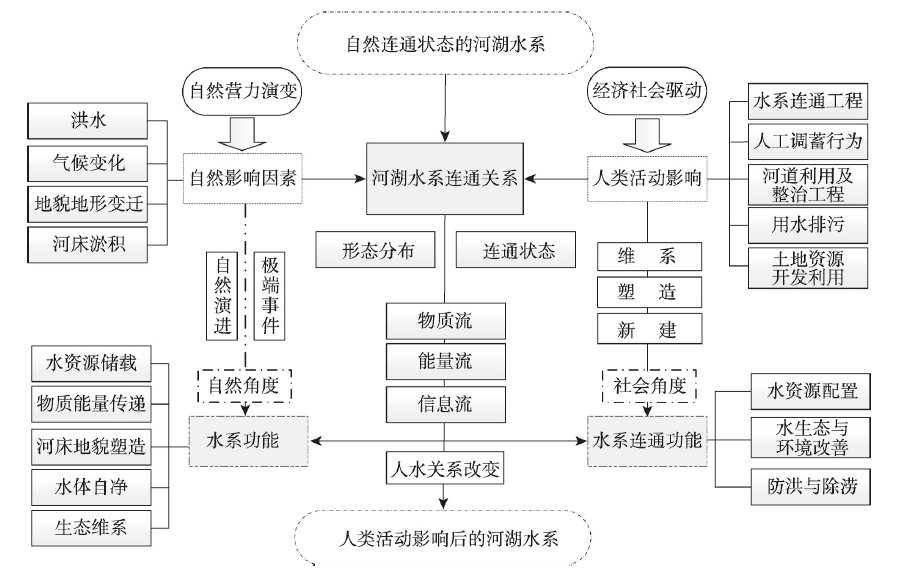
The natural river system, which is inherently interconnected, is an essential resource for human and economic society. Beyond water, and the flows of substance (e.g. sediment, contaminant), energy (e.g. streamflow velocity), and information (e.g. livelihood and activity) are exchanged in an interconnected river system. However, under the joint influences of natural evolution and human activities, the natural river system has been and is being changed. Particularly, water-related human activities in recent years are frequent and highly intensified, such as the water allocation projects and man-made reservoirs. Therefore, research on the evaluation of human activities affecting the interconnected river system network (IRSN) is needed to technically support the relevant practices. This study analyzed the affecting factors of IRSN from two perspectives: natural perspective and social perspective. The processes of human activities affecting the IRSN were theoretically explained. On this basis, both the positive and negative influences of human activities on IRSN were summarized in three aspects: interconnected-river-system-network function relationship, rivers-lake-system natural function, and interconnected-river-system-network function. To this end, the study proposed a quantitative evaluation method to assess human activities affecting the IRSN in the above three aspects. As the Huaihe River basin was severely influenced by human activities, we applied the evaluation method in this basin. Results show that human activities contributed to the interconnected-river-system-network function, meaning that possible influences on water scarcity and flood protection were generated in improving the complexity of man-made river system. Meanwhile, slight negative influences on the rivers-lake-system natural function were reported, as downstream aquatic life and surrounding environment were affected by the flow changes of water, substance and information. Together with characteristics of the Huaihe River basin, the overall quantitative evaluation results suggested that stepping up the efforts to protect the environment could further positively influence the IRSN in the Huaihe River basin. This study sheds new light on our understanding and quantitative evaluation of the influence of human activities on the IRSN.
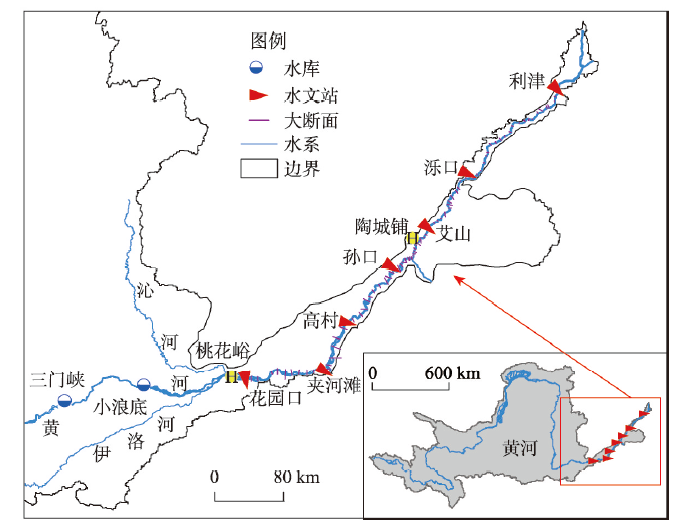
To understand the non-equilibrium morphological adjustment of a river to environmental changes, it is essential to (i) identify accurately how previous water and sediment conditions have impacted the current morphological adjustment of the river to environmental changes and (ii) establish a corresponding simulation method for non-equilibrium conditions. Based on water-discharge and suspended sediment concentration (SSC) data and 82 cross-sectional data for the Huayuankou-Lijin reach of the Lower Yellow River for 1965-2015, the adjustment processes of the main-channel geometry (area, width, depth, and geomorphic coefficient) and their responses to changes in water discharge and SSC for different reaches are analyzed statistically. Then, with the water and sediment conditions as the main controlling factors, a delayed response model (DRM) of the main-channel geometry subjected to previous changes in water discharge and SSC is established using the multi-step analytical model. The results show that the main-channel area, width, and depth decreased initially, then increased, then decreased again, and finally increased again. They were correlated positively with the 4 a moving average discharge and negatively with the 4 a moving average SSC. The main-channel geomorphic coefficient for the Huayuankou-Sunkou reach exhibited a decreasing trend, whereas that for the Sunkou-Lijin reach decreased initially, then increased, then decreased again, and finally increased again. Except for the Huayuankou-Gaocun reach for 1965-1999, the coefficient was correlated negatively with the 4 a moving average discharge and positively with the 4 a moving average SSC. In applying the DRM to the response of the main-channel cross-sectional geometry to previous water and sediment conditions in the Lower Yellow River, the calculated values of the main-channel morphological parameters for all the sub-reaches agree well with the measured values. This indicates that the DRM can be used to simulate the response adjustment process of the main-channel cross-sectional geometry to variations in the water and sediment conditions. The results of the established model show that the adjustment of the main-channel cross-sectional geometry is affected by the current discharge and SSC (30%) and those of the previous seven years (70%), where the numbers in brackets are the respective weight factors. The established model offers insights into the mechanism whereby previous water and sediment conditions influence the current morphological adjustment of the river, and it provides an effective method for predicting the magnitude and trend of the main-channel geometry under different incoming water and sediment conditions.
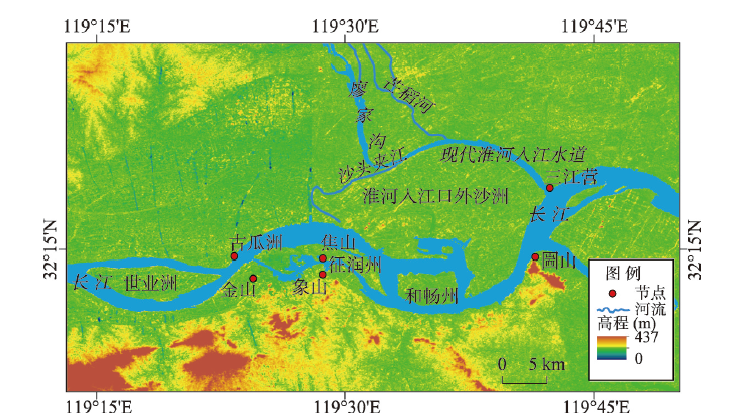
Under the influence of the changing relationship between the Yellow River and the Huaihe River, the lower reaches of the Huaihe River had gradually drained into the Yangtze River since 1570 AD, and finally became a tributary of the Yangtze River. This transformation added new variations to the evolution of the Yangtze River's fluvial processes by changing the original riverbed features and currents of the Zhenjiang-Yangzhou reach. This article analyzed three surveyed maps, discussed related historical literature and investigated some antique maps to explore the formation and the evolution of the sandbanks outside the estuary of the Huaihe River. Some sandbanks including the Yumin Sandbar and Nanxin Sandbar appeared before the 17th century due to the disintegration of original sandbars such as Tengliao Sandbar,which disappeared during the Chenghua and Hongzhi reigns in the Ming Dynasty (1465-1505 AD). Since the Huaihe River entered into the Yangtze River, the Yumin Sandbar and Nanxin Sandbar had continued to expand and banked to the north along with the newly-formed sandbanks. At last, the northern channel of the Zhenjiang-Yangzhou reach demised and the riverbed transformed from a straightforward bifurcation into a curved one. Accordingly, the formation of meandering flow began to erode Guazhou Town on the upstream concave bank and silt Zhenjiang Town on the convex bank, gradually reshaping the Zhenjiang-Yangzhou reach of the Yangtze River into its current configuration.
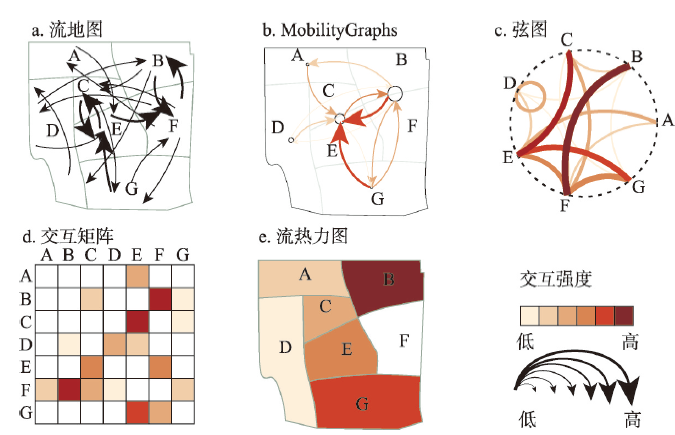
Spatial interaction is a critical basis of understanding human processes on the land surface. Together with spatial dependence, it embodies the uniqueness and relatedness of geographical space, as well as the impact on the embedded geographical distribution patterns. Spatial interaction also has distinctive space-time attributes, and thus it is significant to geographical research. Big data bring new opportunities for the studies of spatial interaction, which enables us to sense and observe spatial interaction patterns at different spatial scales, and simulate and predict their dynamic evolution. This provides great support for the research of human activity regularities and regional spatial structures. In this article, we first demonstrated the relationship between spatial interaction and geospatial patterns, and introduced how to sense spatial interaction with big geodata. Then, we generalized the progress of relevant models and analytical methods, and introduced the corresponding applications in fields of spatial planning, urban transportation, public health and tourism. Some key issues were also discussed. We hope this review can provide guidance for the studies of spatial interaction supported by big data.
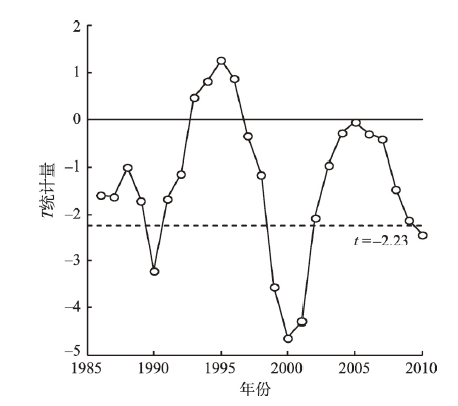
Since the reform and opening-up in 1978, the morphology of urban built-up land (UBL) has been changed significantly due to the rapid socio-economic development in China. Moreover, this change shows an unbalanced variation over space. Based on the UBL area and census data from 1981 to 2015, we use the moving T-test, kernel density estimation and Gini coefficient to identify the abrupt change points over UBL transition process and present its dynamic spatial pattern. This research exhibits four main results. First, there are three identified stages over the transition process, namely, low expansion rate of UBL-decrease of per capita UBL (1981-2000), moderate expansion rate of UBL-slow increasing rate of per capita UBL(1990-2000) and high expansion rate of UBL-high increase of per capita UBL (2000-2015). Second, the spatial pattern of UBL area transition proceeds slowly over the periods of 1990-2000 and 2000-2015. Cities with a high expansion rate of UBL tend to present a spatial pattern of an agglomeration over the Yangtze River Delta and the Pearl River Delta, and the rest of the regions that tend to show a spatial pattern of an dispersion are provincial capitals in the central and western regions. On the contrary, cities with a high increasing rate of per capita UBL tend to originate from the eastern region to the entire country. Third, the variance of the UBL tends to be smaller during 1990-2000 and then greater during 2000-2015 over space, while the variance of the per capita UBL tends to be smaller during 1990-2000 and then stable during 2000-2015 over space. Lastly, we find that the results correspond to the previous theory of regional land use transition, and the socio-economic transformation phenomenon demonstrates the three identified stages. Moreover, the transition of spatial pattern reveals the fact that the change of national development strategy is from the priority of eastern coastal areas to the regional coordination. This work fills in a gap of quantifying the stage of land use transition, and provide support references to UBL management in the socio-economic transformation in the new era.