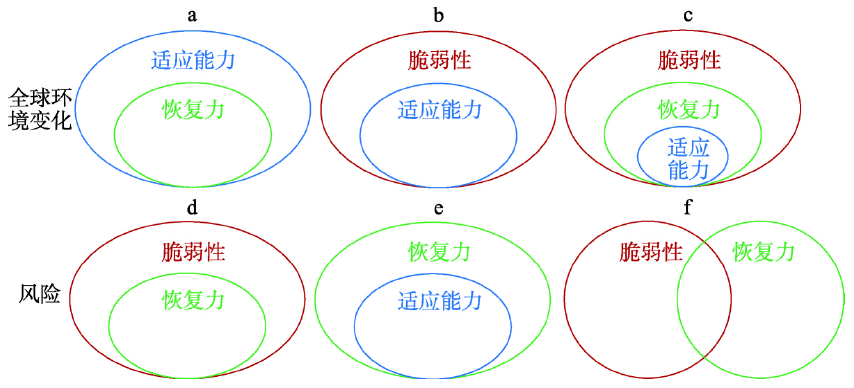
The concept of human-earth system represents a dynamic structure formed by the interaction between human and earth within a specific region. Considering the complexity of the system, it is necessary to construct a more powerful indicator system to describe the interaction and reflection processes between human and earth systems. The term of spatial resilience can be understood as the overall ability of regional space to absorb, recover or transform natural and social disturbances. Spatial resilience targeted at securing the structural stability of human-earth system, and it also provides a new approach for the shaping of targeted theoretical models and quantifiable indicator system in the study of human-earth system. This study reviews the research progress of spatial resilience from three perspectives, including: ecological policy and ecosystems spatial resilience from a natural perspective; environmental changes and spatial resilience of community production and living from a social perspective and the spatial resilience integrated indicator system from a comprehensive description perspective. Then the article puts forward three important directions of spatial resilience research in China, including understanding the spatial state that guaranteed system sustainability, identifying the spatial thresholds of human-earth system dynamic process, and satisfying the national demands of ecological protection and social development. This study also discusses the spatial resilience indicator system in various human-earth system functional areas from aspects of system structure, function and threshold. By the deepening of the theories and methods of spatial resilience, the human-earth system dynamics can be further understood, so as to improve the regional level accuracy on simulating the socioeconomic, environmental and political paths, and provide key theoretical and methodological support for the decision-making of sustainable development at global, national and regional levels.
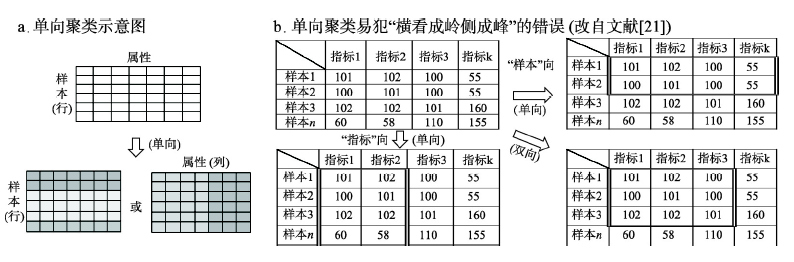
With the improvement of geographic data acquisition capabilities, the volume of geographic data has been growing exponentially, and the data types as well as characteristics have become more diverse. The effective identification and classification of data has become the key to understand spatio-temporal patterns, evolutionary processes, and driving mechanisms of geographic phenomena. However, traditional clustering methods are facing some challenges, such as large amount, high-dimensionality and poor-quality of the data to be dealt with. Therefore, it is necessary to improve clustering methods. This paper first describes the transformation from one-way clustering to tri-clustering. One-way clustering methods perform the clustering analysis along with the samples or the attributes. They played an important role in previous studies, but ignored local features that are very similar. Co-clustering methods perform the submatrix partitioning scheme based on location similarity of elements within the data matrix. They avoid shortages of one-way clustering by realizing the clustering from both rows and columns, making similar elements into the same submatrix and dissimilar ones into different ones. However, they cannot satisfy multiple directions interpretations of geographical research since they do not support 3D panel data body. Then, we develop a new tri-clustering method, presents the workflow of using tri-clustering to spatio-temporal patterns' studies, and summarizes how to construct the 3D data matrix for clustering according to different aspects of 'space-time-scale-attribute' involved in the analysis. Finally, we show some practices of tri-cluster. The results show that: (1) Tri-clustering is an effective method to identify the spatio-temporal differentiation of geographic data in the era of big data by solving problems, i.e. data of high dimensionality and low quality. (2) Tri-clustering is universal in the algorithmic level when facing different geographic topics, but the differences rely on the 3D data matrices constructed according to different aspects of "space-time-scale-attribute" involved in the analysis. And, different data matrices are clustered to different results, which answer different topics. (3) Tri-clustering is able to interpret the spatio-temporal differentiation of geographic data in multiple directions, multiple scales, and multiple hierarchies, and thereby reveal the superposition effects of spatio-temporal scales of geographic features. Finally, we emphasize the significance of constructing 3D data matrices based on different geographic topics and expect that tri-clustering methods can enhance the ability to analyze geographic data with multiple spatial scales and attributes in the future.
The complexity in low altitude has hindered the development and utilization of low-altitude airspace resources with UAVs as the main application users. With the rapid increase of UAV numbers and the rapid expansion of commercial application of UAVs, the conflict between the increasing flight demand and the limited flight space is increasingly prominent at low altitude. Therefore, how to conduct the activities of UAVs at low-altitude safely and efficiently is a problem to be urgently solved. Many countries or regions are looking for solutions. Among the proposed solutions or methods, the low-altitude public air route network of UAVs, which is proposed firstly by the Chinese Academy of Sciences (CAS) to orderly manage UAV low-altitude traffic and efficiently utilize low-altitude resources, has been widely recognized. However, the concept is still in the early exporting stage and is not clear on how to construct. In addition, how to quickly acquire high-precision geographic information to support safe and efficient flights of UAV in low altitude, especially in urban areas with complex and high-dynamic changeable surface environment, is also difficult. In view of the promising application of remote sensing (RS) technology in extracting and processing air route sensitive elements, this paper proposes a method to efficiently and iteratively construct the low-altitude public air route network by RS and geographic information technology in urban areas, and then demonstrates the feasibility of this method from theoretical support and existing research foundation. The technical roadmap includes four steps: (1) generating the first-level air route network based on ground roads to make full use of ground traffic facilities; (2) constructing the second-level air route network by using positive constraints of air routes, such as green lands and waters; (3) constructing the third-level air route network by avoiding negative constraints of air routes, including buildings, weak-communication areas and power lines (poles); (4) generating the fourth- and fifth-level air route network by simulated flight and practical flight tests. Comparative analysis between actual measurement and simulated environment map is conducted to ensure safe UAV flights. The method proposed above comprehensively utilizes interdisciplinary technologies such as RS, geographic information system (GIS), aviation and transportation, and provides a new way to make safe and efficient UAV operations in low altitude. Furthermore, this paper uses geography method to construct UAV air route network in low altitude, which is another breakthrough in the application of UAVs in geography after UAV remote sensing application. It also expands the research scope of geography and will certainly promote the development of geographic science.
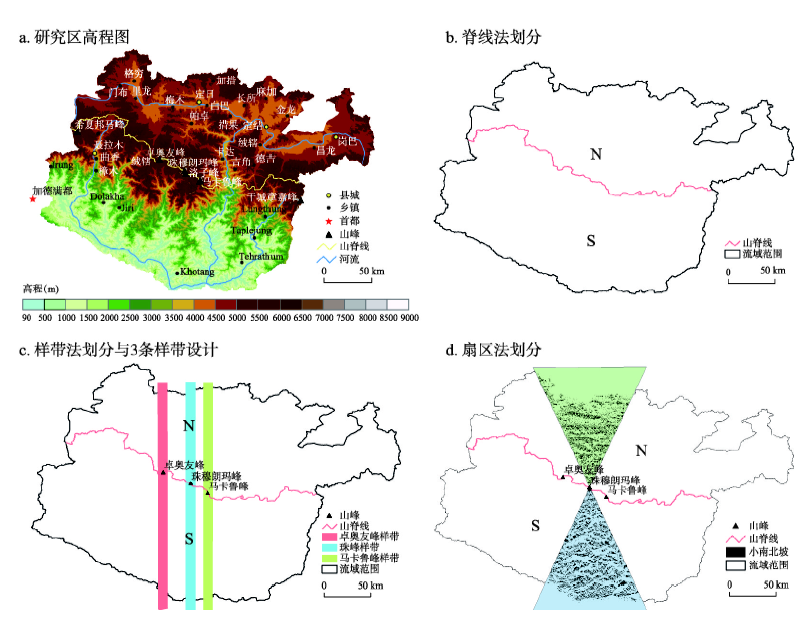
The Qomolangma Mountain region within the Central Himalayas is characterized by obvious altitudinal variation, habitat complexity, and land cover diversity. This region is therefore one of the most sensitive areas to climate change in the world. Besides, because this region has the most complete natural vertical spectrum in the world, it is ideal for studying the vertical structure of alpine land cover. Utilizing land cover data for 2010 (30 m resolution) along with digital elevation model outputs, three division methods were defined that encompass the northern and southern slopes of Qomolangma Mountain. These comprised the ridgeline method, the sample transect method, and the sector method. The study investigated altitudinal distributions, similarities and differences, and changes in the degree of land cover on the northern and southern slopes of the Himalayas area using the software ArcGIS and MATLAB tools and division models. The main results of this analysis are listed as follows:
Firstly, the distribution of land cover in mountainous areas was characterized by an obvious vertical spectrum structure, with the south-six and north-four pattern of vertical spectrum of land cover in the Central Himalayas marked by the influence of human activities. Secondly, zonal distribution was exhibited by forests, grasslands, sparse vegetation, barren land, glaciers, and snow covers from low to high altitudes. It was markedly different in the composition and structure of land cover vertical spectrum between the northern and southern slopes of this mountain area. The vertical spectrum of land cover types on the southern slope was complete and diverse, but it was relatively simple on the northern slope. The study shows that given the same land cover type, the amplitude of elevation distribution on the southern slope was wide, while that on the northern slope was narrow. The distribution of land cover types on the southern slope was low. Thirdly, the results show that the area distribution ratio of each land cover type varied with elevation according to change mode. Vertical distribution patterns of land cover types on the southern and northern slopes were therefore divided into four categories, with glaciers, snow, sparse vegetation, and grasslands conforming to unimodal distribution patterns. The bare land also followed a unimodal distribution pattern on the southern slope, but it followed a bimodal one on the northern slope. Fourthly, all kinds of vertical belt structures and land cover divisions on the southern slope were similar, but they were different from one another on the northern slope due to division methods. In comparison with field survey data, results reported here for the sector method were more in line with the actual situation.
The Loess Plateau is the core region of the "Green to Grain" Program, which makes it become the most successful example of ecological restoration in China. It is the common demand of both academic research and management practice to analyze the effects of vegetation restoration on ecosystem service and identify the threshold effects of vegetation restoration. However, there still is a research gap in related studies, especially for the thresholds of vegetation in the ecosystem service change at regional scale. In this study, we chose the fractional vegetation cover (FVC) as an index to indicate the vegetation coverage change in the Loess Plateau in 2000-2015, and took soil conservation service, water yield service and carbon sequestration service as indexes to exhibit the ecosystem service changes. The spatiotemporal changes of vegetation coverage and ecosystem services and their interaction were quantitatively analyzed. On such a basis, we further assessed the effects of vegetation coverage change on ecosystem services and quantitatively identified their thresholds. The results indicated that: (1) The vegetation coverage significantly improved in 2000-2015. Meanwhile, the differences of ecosystem service changes were prominent, with the carbon sequestration service getting significant enhancement, soil conservation service getting certain improvements and the water yield service maintaining steady. (2) There are differences among the correlations between vegetation restoration and changes of ecosystem service. The correlation of vegetation coverage-carbon sequestration service was the strongest, followed by that of vegetation coverage-soil conservation service. (3) The vegetation restoration could promote the improvement of the overall level of regional ecosystem service. Furthermore, we revealed the threshold effect in the promotion. The threshold occurrence resulted in the decrease of promotion efficiency of vegetation restoration, with vegetation coverage reaching 44%, 32%, 34% and 34% in forest zone, forest-grass zone, grass zone and grass-desert zone, respectively.
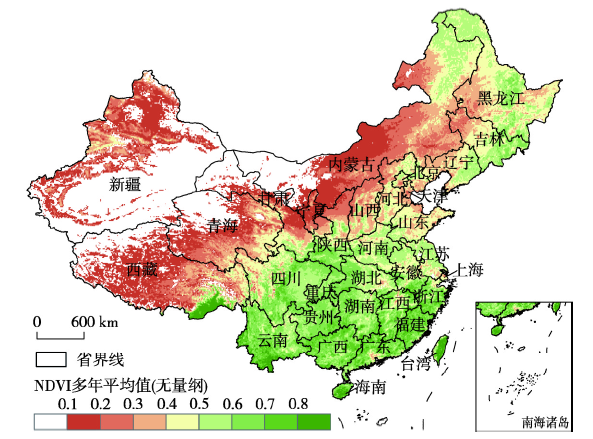
Based on the observed daily temperature and precipitation of the land surface of 603 meteorological stations in China, the Global Inventory Modeling and Mapping Studies (GIMMS) Normalized Difference Vegetation Index (NDVI) 3rd generation dataset, the changing patterns of NDVI in China during 1982-2015 were investigated and the corresponding contributions of the main driving forces, climatic change and human activities, to these changes were distinguished using the methods of trend analysis and multiple regression residuals analysis. The results showed that vegetation recovered in whole China in research period significantly. Shanghai was the single case with a decrease in growing season NDVI in the selected 32 provincial-level administrative regions, while the growing season NDVI in Shanxi, Shaanxi, and Chongqing increased much faster compared with other regions. The climatic change and human activities drove the NDVI change jointly as main forces in China and induced both a rapid increasing trend on the whole and a huge spatial difference. The impacts of climatic change on NDVI change in the growing-season ranged from -0.01×10 -3 a -1 to 1.05×10 -3 a -1, while the impacts of human activities changed from -0.32×10 -3 a -1 to 1.77×10 -3 a -1. The contributions of climatic change and human activities accounted for 40% and 60%, respectively, to the increase of NDVI in China in the past 34 years. The regions where the contribution rates of human activities were more than 80% were mainly distributed in the central part of the Loess Plateau, the North China Plain, and the northeast and the southwest of China. There were 22 provincial-level regions where the contributions of human activities were more than 50%, and the shares of contribution induced by human activities in Shanghai, Heilongjiang, and Yunnan were much greater than those of any other regions. The results suggest that we should focus more on the role of human activities in vegetation restoration in the whole country.
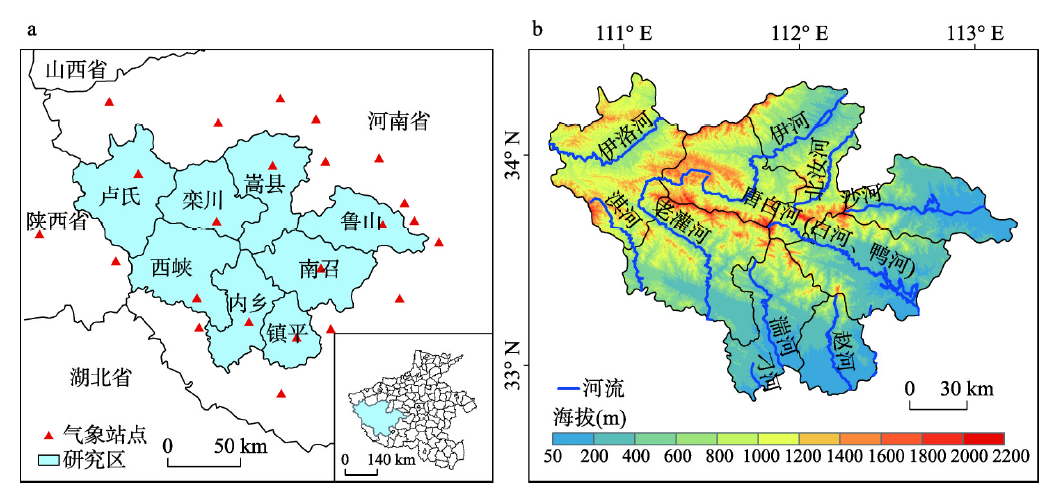
Forest ecosystem service trade-offs and synergies are important research topics for several disciplines. The multi-scale analysis of service trade-offs and synergies assists in the implementation of more effective forest resource management. Based on multi-source data including forest distribution, topography, NDVI, meteorology and soil conditions, key forest ecosystem services, including total forest volume, carbon storage, water yield, soil retention and habitat quality were mapped and evaluated for the Funiu Mountain Region through integrated deployment of the CASA model, the InVEST3.2 model and the ArcGIS10.2 software. The characteristics of trade-offs and synergies among different ecosystem services were then mapped and considered across multiple spatial scales (i.e., by region, north and south slopes, vertical belt) using the spatial overlay analysis method. The main results are as follows: (1) Mean forest volume is 49.26 m 3/hm 2, carbon density is 156.94 t/hm 2, water supply depth is 494.46 mm, the unit amount of soil retention is 955.4 t/hm 2, and the habitat quality index is 0.79. (2) The area of forests with good synergy is 28.79%, and the area of forests with poor synergy is 10.15%, while about 61.06% of forests show severe trade-offs and weak trade-offs. The overall benefits of forest ecosystem services in the study area are still low. In the future, bad synergy and severe trade-off areas should be the focus of forest resource management and efficiency regulation. (3) Synergy between ecosystem services is better for forest on south slope than that on north slope. Deciduous broad-leaved forest belt at moderate elevations on south slope in the mountains (SIII) has the highest synergies, while that at low elevations on north slope (NI) exhibits the lowest synergy levels.
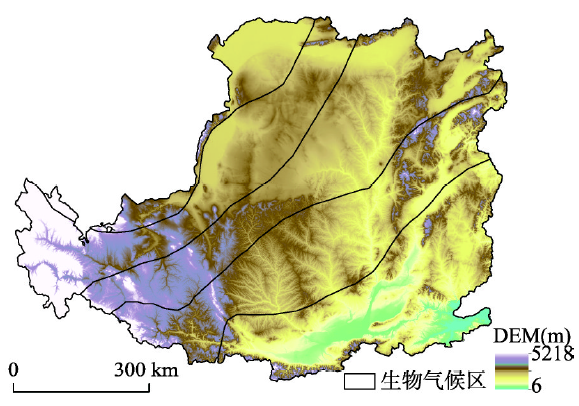
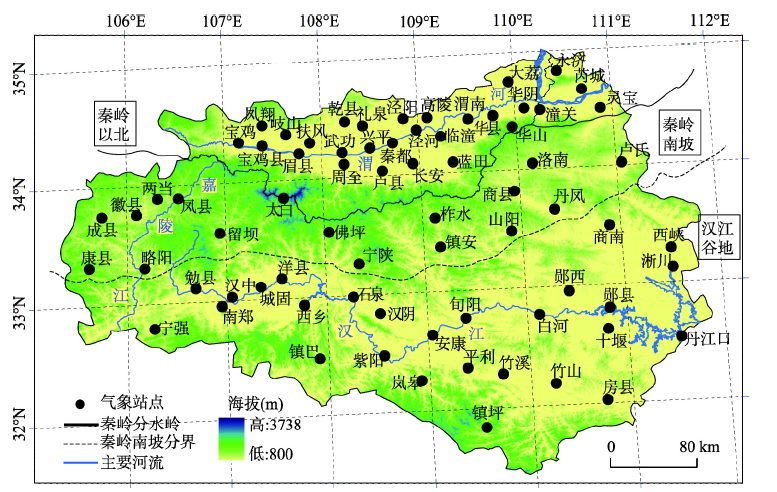
Modeling extreme precipitation processes could provide a pathway for a better understanding of the questions concerning how much precipitation is extreme and how that extreme precipitation responds to warming in the climate change sensitive and ecological fragile zone of China over the coming decades. In this perspective, based on daily precipitation and temperature data from 72 meteorological stations released by the National Meteorological Information Center, the spatial-temporal variation of precipitation is investigated in the Qinling Mountains from 1970 to 2017, which is a critical geographical and climatic boundary between northern subtropical and warm temperate zone in China. Then we applied a framework to identify the dominant pattern of EEP in the study region, and time distribution pattern (TDP) of the event-based extreme precipitation (EEP) could be divided into four types, i.e. early, after, balance-phase and single day EEP, here after referred to as TDP1, TDP2, TDP3 and 1-day EEP. More specifically, the relationship between different EEP and local temperature is investigated through the cross wavelet transform and linear correlation. The result showed that from a long-term climate view, precipitation pattern is relatively stable in the Qinling Mountains in the past 48 years, and the 800 mm isohyetal line is still distributed in the south piedmont of Qinling Mountains. Moreover, precipitation analysis showed an obvious synchronous trend in the sub-region, which could be characterized as non-smooth and non-linear, and after 1997, there is an increasing trend in annual precipitation amount, a declining trend in rainy days, and a continuous increase of extreme precipitation intensity. Spatially, according to percentage of total precipitation amount of EEP, a wide distribution of TDP3 is clearly seen over most regions and 1-day EEP does not prevail, which demonstrates that daily precipitation extremes during an EEP could be mainly distributed at both the first and second half parts of the event duration. In north of Qinling Mountains, the dominant pattern combines TDP3 and TDP2. For south piedmont of Qinling Mountains, it witnesses fewer combinations of EEP. There exists difference between the east and west in Hanjiang River Valley, that is, TDP3 and TDP2 in the west is greater than in the east where the dominance of TDP1 and TDP3 is more prominent. However, based on the percentage of total frequency of EEP, TDP1 is observed in southern and northern Qinling Mountains, and the dominant pattern combines TDP1 and TDP2 in Hanjiang River Valley. Furthermore, in the past 48 years, the influence of local climate change, for the decadal variation of extreme precipitation, was more obvious on the time scale of 8-12 years than of on the time scale of 4-8 years. It is worth mentioning that changes in nearly all indices had a strong correlation to temperature in Hanjiang River Valley, especially TDP2 and 1-day EEP. This is particularly true of high temperature related to more precipitation intensity of single day, which in turn raises the expectation of more intense extreme short-duration rainfall events that could be assessed by the wavelet coherence analysis. Between 1998 and 2012, the phenomenon, 'global warming hiatus', occurred in the Qinling Mountains, which led to the decrease of 1-day EEP, and the increases of TDP1 and TDP3 in the north of Qinling Mountains, as well as the increase of TDP2 over the south piedmont of Qinling Mountains. All the above results are closely linked to lower temperature. The response of TDP3 and TDP2 is stronger than other types in Hanjiang River Valley. It should be noted that these results are helpful to understand the relationship between climate warming and extreme precipitation, but the response of different EEP to anthropogenic forcing and atmospheric oscillation is still complex and not explicitly resolved.
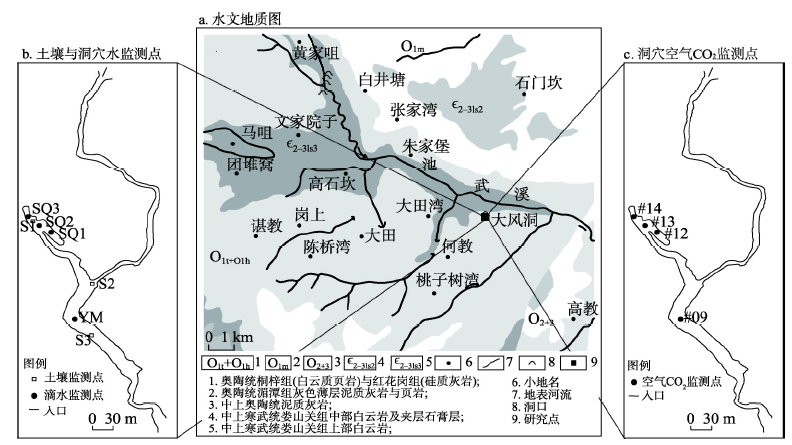
The critical karst zone is the central area with the combined action of the carbon cycle in the lithosphere, atmosphere, hydrosphere, and biosphere, and the interaction among different layers forms distinctive reaction systems, where CO2 plays a vital role. Through monitoring the concentration of CO2 in the overlying soil of Shuanghe cave, cave water, and atmosphere, the vertical conversion characteristics of CO2 were systematically analyzed based on the carbonic acid equilibrium theory by adopting statistical analysis. The results show that the vertical conversion process of CO2 is influenced by the changes in temperature inside and outside the cave, pH value of the dripping water and the process of degassing precipitation, and the source of CO2 and ion saturation conditions, which are significantly different between the rainy and dry seasons. During the rainy season, the infiltration rate of atmospheric precipitation is high in the soil, forming a relatively stable enclosed environmental soil. The surface karst belt has weak activity in complementing CO2 in the infiltration water, and the partial pressure of CO2 (PCO2) in the infiltration water varies in the range of 0.035~0.126 vol%, and the partial pressure of CO2 in the water-atmosphere (△lg PCO2) inside the cave is above 0. The cave water is featured by the corrosion property, and CO2 in the lower part of the surface karst belt is the primary source of CO2 in the cave water, whereas during the dry season, due to a small amount of precipitation, the infiltration water has sufficient time to receive CO2 supplement from the soil and surface karst belt, forming an open system. The infiltration water changes in the range of 0.038~0.129 vol%, which is more conducive to the occurrence of the prior calcite precipitation (PCP). At this time, PCO2 in the atmosphere inside the cave is smaller than that in cave water (△lg PCO2 < 0), prompting the recurrence of degassing precipitation inside the cave. Also, both the soil and surface karst belt are the major sources of CO2 in the cave water.
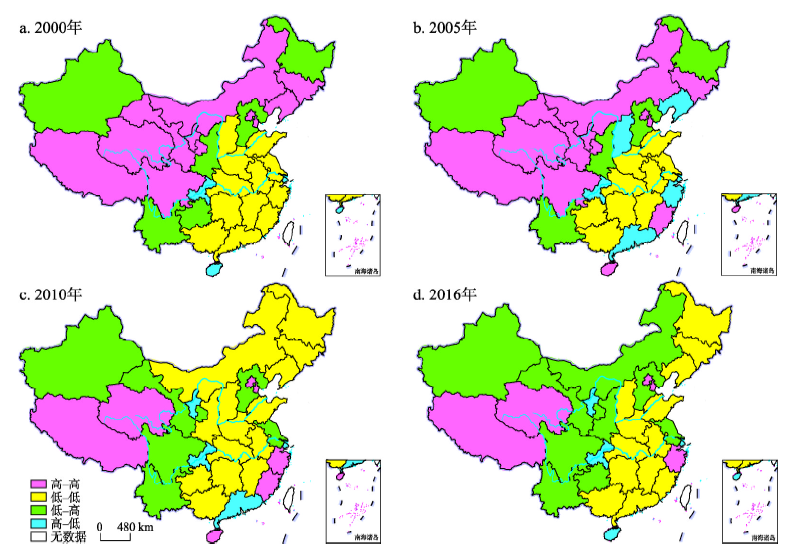
Water shortage, which can greatly affect both natural systems and social development, has drawn extensive attention from governing authorities around the world, and become an urgent issue to be addressed. How to improve the green efficiency of water resources and alleviate the present situation of water shortage is the content of this study. In the concept of "people-oriented" green development, the evaluation system of green efficiency is constructed, which includes four aspects: nature, social economy, environment, science and technology. This paper, based on the panel data of 31 provincial-level regions of China obtained from 2000 to 2016, aims to calculate the green efficiency of water resources by applying the Super-efficiency SBM model, to analyze its spatial correlation pattern, and to explore the driving mechanism of green efficiency of water resources by making use of the geographical weighted regression (GWR) model. The results show that there was ignificant positive spatial correlation and uneven spatial distribution of the green efficiency of water resources in China. Compared with the OLS model (the regression coefficient obtained by the model just represents the average characteristics of the overall green efficiency of water resources), the GWR model proves that there were spatial differences in the influence of various factors on the green efficiency of water resources. Generally speaking, industrial structure, industrial and agricultural development level, transportation infrastructure construction, environmental protection investment and science and technology conversion rate had a positive effect on the green efficiency of water resources, while the factors, including per capita water resources, population size and pollutant emissions, had a restraining influence. Social factors and environmental factors had a particularly obvious effect on the green efficiency of water resources. In addition, due to the large potential of the technology market turnover, the regions should step up efforts to increase investment of scientific research and focus on the transformation of scientific research results so as to make technology a new growth pole of green efficiency of water resources. In terms of spatial differences, water endowment and population size had significant impact on the green efficiency of water resources in the western region, and industrial structure, water utilization structure and transportation infrastructure posed a positive effect in the eastern region. This study is of great practical significance to solve water shortage and to formulate relevant policies suitable for the development of all regions.
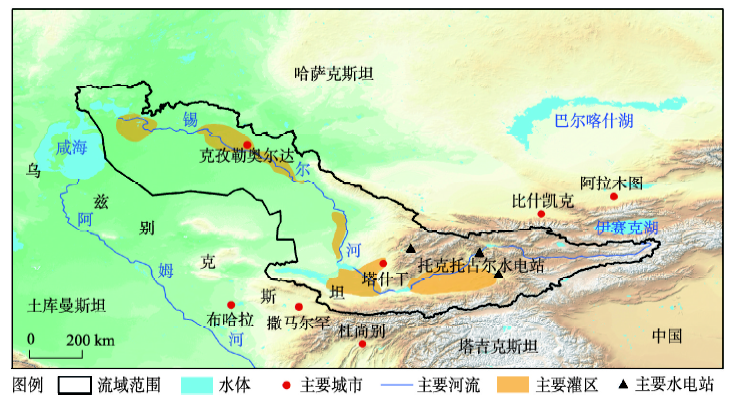
Due to the influence of climate change, population growth, politics, ecological feedback and related factors, the water use system of transboundary basins are characterized by a complicated Water-Energy-Food-Ecology nexus, which constitutes a complex nonlinear system with high uncertainty. Unfortunately, the traditional optimization of water resources is often constrained by such a complex nexus. Despite that integrated modeling approach is often used in the simulation of complex nexus, it remains unsupportive of big data needs, thereby making uncertainty reduction a difficult task. The Bayesian network (BN), which is considered a more robust tool for analyzing complex relationships, was applied in this study to characterize the Water-Energy-Food-Ecology nexus of Syr Darya river basin, a transboundary inland basin which contributed to the Aral Sea ecological crisis for unreasonable water use. The annual scale data was introduced into BN to model the impact of stochastic annual runoff and compare their differences using periods "before" and "after" the disintegration of the Soviet Union as benchmark. Results show that during the before period, the amount of water inflow into the Aral Sea was sensitive to increased irrigation for agricultural development, increased water storage of the upstream reservoir and stochastic runoff. This situation became reverse after the disintegration of the Soviet Union. The reverse situation resulted from unresolvable disputes between power generation in upstream and irrigation water in downstream countries. Comprehensive scenario analysis shows that it is effective to improve the proportion of food crops, the efficiency of water use for salt leaching and irrigation, and prevent drought damage. Based on the increased use of advanced drip irrigation technology from 50% to 80%, it is anticipated that the annual inflow into the Aral Sea will increase significantly, reaching 6.4 km 3 and 9.6 km 3, respectively; and is capable of ameliorating ecological crisis within the basin. Finally, this study shows that the BN is a cost-efficient approach for predicting systematic water usage as decision support in water management with less complexity, and it is effective in modeling casual relationships in the Water-Energy-Food-Ecology nexus.
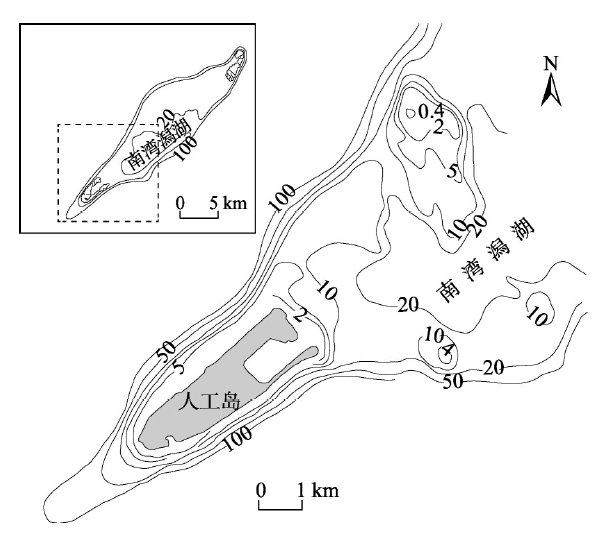
The goal of constructing artificial islands on coral reefs in China is to build ecological habitable islands. The seawater in the artificial islands is gradually replaced by rainfall infiltration, and the freshwater lens formed is an important water source supporting the island ecosystem. The double-layer geological structure is widespread in coral reefs in the South China Sea. Considering the fact that there exists a great large difference in the permeability coefficients obtained using different measurement methods, this study established numerical simulation models for a coral reef island in the South China Sea to simulate the seawater refreshing process. The results show that different permeabilities of the double-layer geological structure of the artificial islands have no obvious influence on the formation time of fresh water on the artificial islands. The permeability of the Holocene coral sand sediment is the main factor controlling the freshwater lens of the artificial reef. The volume of the forming freshwater lens decreases logarithmically with the increase of the permeability coefficient, and the volume of the freshwater lens decreases more significantly with the increase of the permeability of the Holocene sediment than the thickness of the freshwater lens. After the freshwater lens crossed the unconformity surface and entered the Pleistocene reef limestone, due to the sudden increase of the permeability coefficient of the aquifer, the freshwater lens expanded to the horizontal direction and formed the mustached-shape freshwater body in the reef limestone.
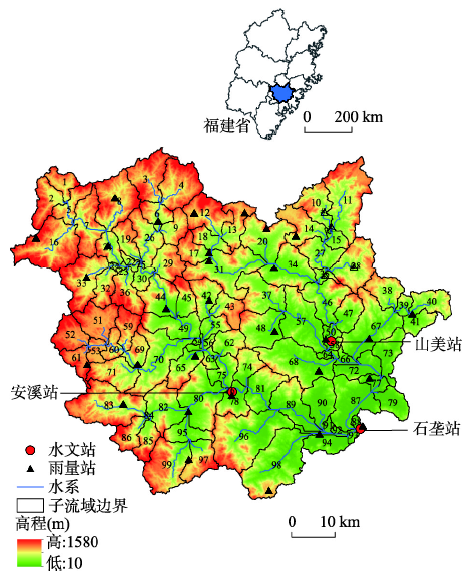
A method has been developed based on the Soil and Water Assessment Tool (SWAT) to quantitatively evaluate the water conservation function of forests and its multi-time scale characteristics in a discontinuous forest watershed. Using this method, we have divided hydrological response units (HRU) based on the spatial distribution of forests, and derived a formula to quantify the water conservation in discontinuous forest watershed based on the water balance method. Here we take the Jinjiang River Basin in southeast coastal China as an example. We constructed SWAT model under land use conditions in 2006 and analyzed the temporal variation of forest water conservation in the study river basin under precipitation conditions from 2002 to 2010. The results show that (1) the SWAT model of the study area is of high accuracy, and the hydrological response unit can accurately reflect the distribution of forest patches when the area threshold is zero. The model provides a new method for evaluation of forest water conservation function in the discontinuous forest watershed using a distributed hydrological model. (2) The annual conservation of forest water in the Jinjiang River Basin was 271.41-565.25 mm. The annual conservation function of forest water is relatively stable, and there was no runoff regulation between consecutive years. The monthly conservation ranged from -29.15 mm to 154.59 mm, which is positive for most months of the year. The forest water conservation was positive in extreme precipitation period, and negative in extremely dry period. This demonstrates the function of forest water conservation in retaining rainwater in wet periods to decrease flood in the river and supplying water in dry periods to supplement the flow at the daily scale was more effective than that at the monthly scale.
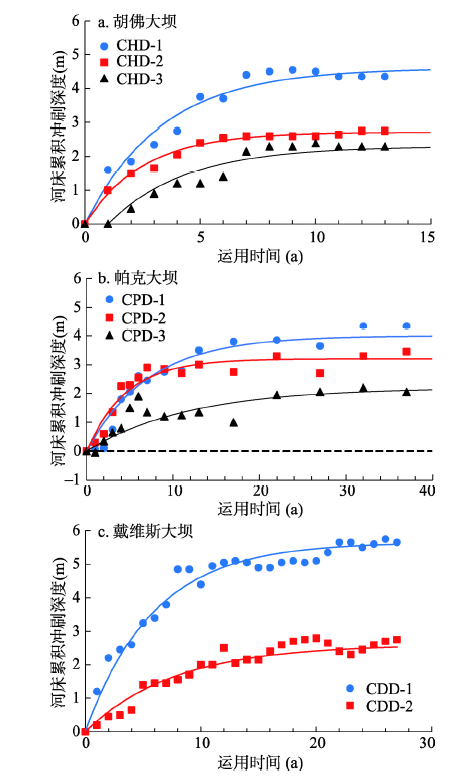
The accumulation phenomenon commonly occurs in fluvial processes. Accurately considering the accumulation effects of previous water and sediment conditions is essential for the study of riverbed evolution. To reveal the physical dynamics of the accumulation phenomenon, herein various geometry observations upstream and downstream of dam on several domestic and overseas typical fluvial rivers were analyzed. To do this, the changes in water and sediment conditions were defined as external disturbances, based on assumptions that the probability of an external disturbance conforms to the Poisson distribution and the feedback intensity induced by an individual disturbance decays exponentially with time. In this paper, a mathematical description of the accumulation processes of internal feedback induced by external disturbances is given, and a corresponding theoretical model is proposed for simulating the spatio-temporal adjustment processes of river characteristic variables on the basis of the stochastic theory in statistical mechanics. Further, the above models were then applied to investigate the spatio-temporal adjustment processes of the upper and lower reaches of dams after their construction. Results revealed two key findings. (i) Temporally, the vertical, lateral, and whole reaches' adjustment rates over time are relatively fast in the early period following disturbances but then slow down rapidly, while the accumulated bed degradation, river width and accumulated sedimentation continuously increase until a new dynamic equilibrium state is attained; these phenomena reflect the representative accumulation characteristics of fluvial processes. (ii) Spatially, the erosion intensity downstream of dams decreases nonlinearly along the channel until it eventually diminishes. In fact, the unbalanced distribution of erosion intensity across space arises from the system feedback caused by external disturbances propagating in space yet decaying over time, which is another external manifestation of an accumulation characteristic in fluvial processes. Model applications indicate that the spatio-temporal adjustment processes of cross sections and channel reaches can be accurately described by the unified theoretical formula derived from equation deforming, since the model predictions show good agreement with observed field data: coefficient of determination (R 2) between them attained values of 0.92, 0.93, 0.76, and 0.95. The proposed theoretical models take both the accumulative characteristics of fluvial processes and the spatial propagation characteristics of system feedback into account synthetically. In demonstrating this approach, this study provides the theoretical basis and new calculation method for quantitatively describing the spatio-temporal adjustment processes of non-equilibrium fluvial channels following disturbances.
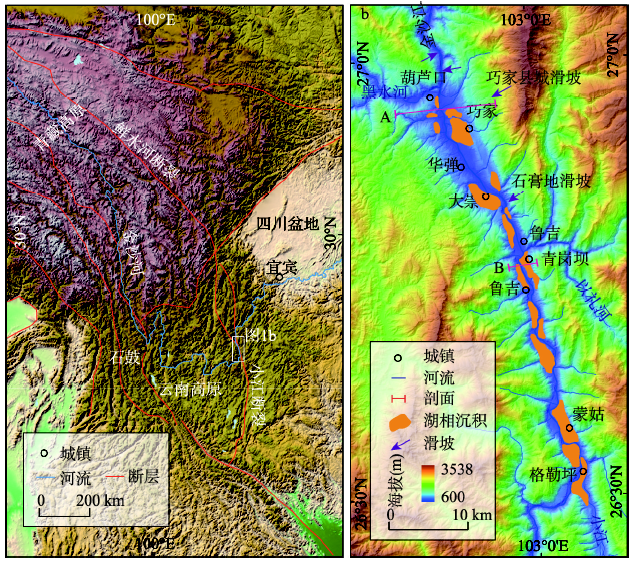
The valley evolution of the Jinsha River is a research hotspot in the geomorphology, but there is a big dispute on the formation time and the evolution process of the river valley. Fluvial terraces and the correlative sediments contain abundant information about the fluvial valley evolution. Through field investigation combined with Optically Stimulated Luminescence (OSL) and Electron Spin Resonance (ESR) dating, we confirmed that 8 fluvial strath terraces were formed, and then preserved, along the course of the Jinsha River near Hulukou. The formation ages of T6-T1 are 1190±154 ka, 1079±118 ka, 942±92 ka, 816±48 ka, 544±82 ka, and 41±5 ka, respectively, corresponding well with the transition period of MIS. Near the Qinggangba, 5 terraces (T5-T1) composed of the dammed lake sediments are preserved on the hillslope, with ages of 629 ka, 88 ka, 71 ka, 49 ka and 20 ka, respectively, indicating that the Jinsha River valley from Qiaojia to Menggu has been repeatedly dammed by the landslide deposits since the mid-Pleistocene epoch. The valley evolution defers to the model of "cut-landslide-dammed-aggradation-cut". We calculated the incision rate based on the formation age and the height of the strath terraces near Hulukou, and found that the incision rate can be separated into two parts: before 0.82 Ma, the incision rate is 0.56 mm/a; from 0.82 Ma to now, it descended to 0.19 mm/a. We think this transition is induced by the frequent landslide events, which can bring a large amount of sediments to the river valley, and then impound a lake and accumulate sediments upstream, inhibiting the river incision. Synthesized studies of the fluvial terraces indicate that the formation of the modern valley of the Jinsha River may have begun in the late Early Pleistocene.