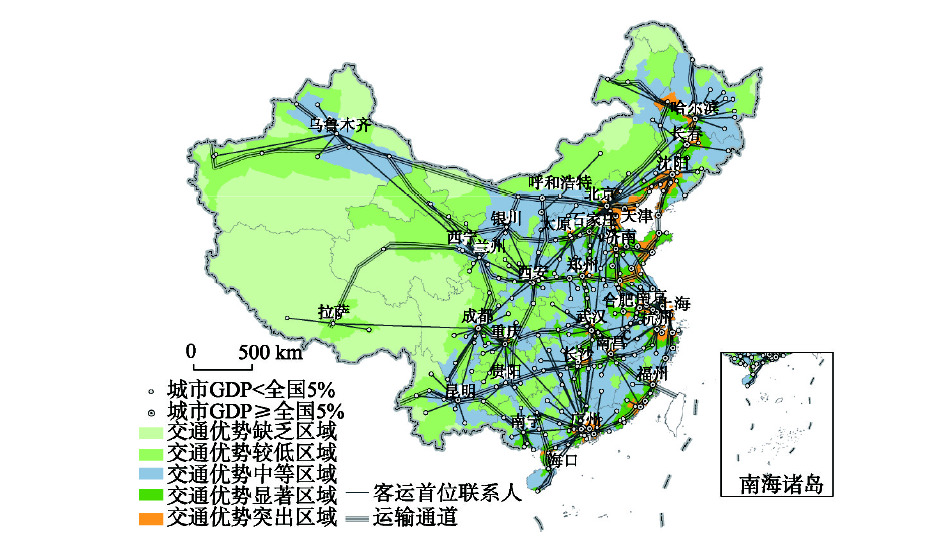
Since the reform and opening-up in 1978, historic changes have been seen in the transportation geography pattern of China. Understanding its evolutionary characteristics and regularity is significant and meaningful for future transportation construction and territory development. This paper reviewed the process of transportation construction in China and investigated the evolutionary characteristics and spatial effects of transportation geography pattern with the technologies in big data mining and GIS. In addition, the regular rules of transportation geography evolution from the aspects of stages, structures, and orders are systematically analyzed. The investigation showed that China's transportation construction has entered the stage of quality improvement. The construction mode has upgraded from scale-expanding driven by investment to quality-improving driven by innovation. The development direction has changed from "prior development" to "integrated coordinated development". The rapid growth and development of transportation networks have significantly influenced the relationship between time and space. The resulting spatial convergence and superiority pattern are coupled with economic-social distribution, which facilitates the development of the economic-social spatial structure. Consequently, territory development that is traditionally centralized by corridors has changed into the networked mode centered on metropolises and metropolitan areas. In brief, the transportation geography pattern is of evolutionary principles. China has been evolving from the stage of ordered structure to the stage of cascade-order structure. Simultaneously, the economic-social pattern has changed from the axis structure to the hub-and-spoke structure with a preliminary ordered network. As transportation networks grow and expand, China's functional spatial structure and ordered network will be gradually stabilized and balanced.
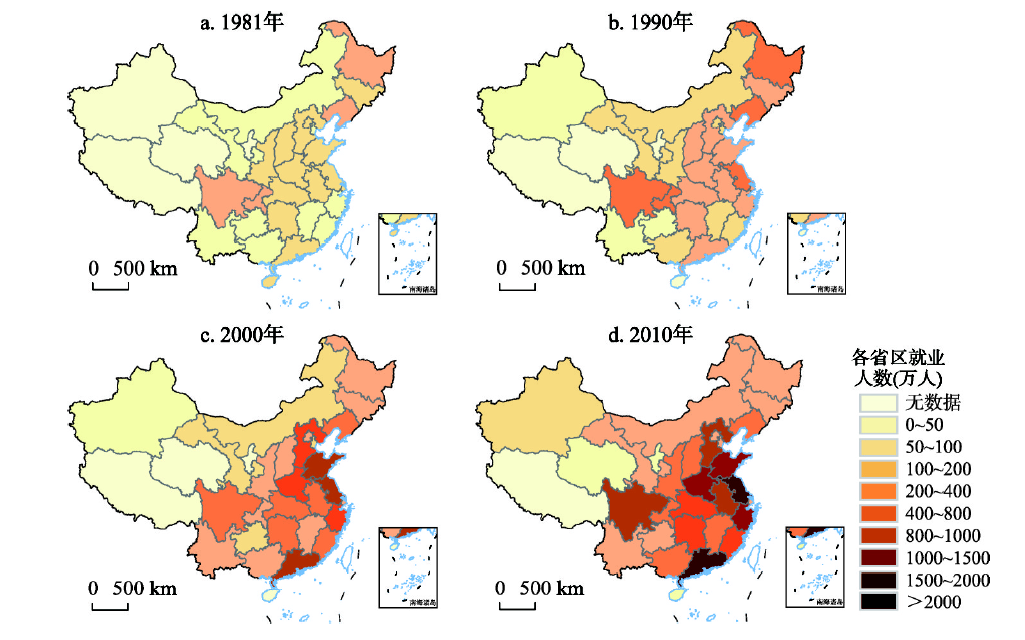
Looking back on the 40 years of reform and opening-up, Chinese industry has achieved rapid growth and development, and Chinese industrial geography has been profoundly reshaped under the profound institutional evolution environment. Chinese industry has undergone a process of spreading in the inland to agglomeration in the coastal areas and then dispersion towards the inland again. However, the geographical pattern of different types of industries is influenced by different forces, leading to differences in the spatial restructuring process. Since the beginning of reform and opening-up in 1978, Chinese industries have been increasingly more agglomerated at different geographical scales, but still much lower than the European Union and the United States. Industrial agglomeration and decentralization drive industrial migration at different scales. In spite of the heterogeneity of industries, industrial migration has generally changed from a scattered layout to an agglomeration pattern in coastal areas; and in recent years, industrial migration has gradually shifted from developed eastern provinces to central provinces, indicating a new round of industrial migration. Remarkable regional industrial entries and exits have promoted the evolution and diversification of local industries. Overall, Chinese industrial space tends to be more complex and concentrated, the links between industries are further strengthened with a more obvious "path dependence" characteristics of industrial evolution in coastal areas. Theoretically, Chinese economic reform is not only the reform of development mode, but also the reform of institutions in essence. The fundamental triple process of marketization, globalization and decentralization has introduced market forces, local forces, and global forces to reshape Chinese industrial geography. And for the study of Chinese industrial geography, besides continuing to summarize patterns and dynamics from multiple perspectives, it is necessary to reveal the deep-level mechanism of the evolution of industrial geography pattern through phenomena, and evaluate the multiple effects of the reshaping of industrial geographical pattern systematically.
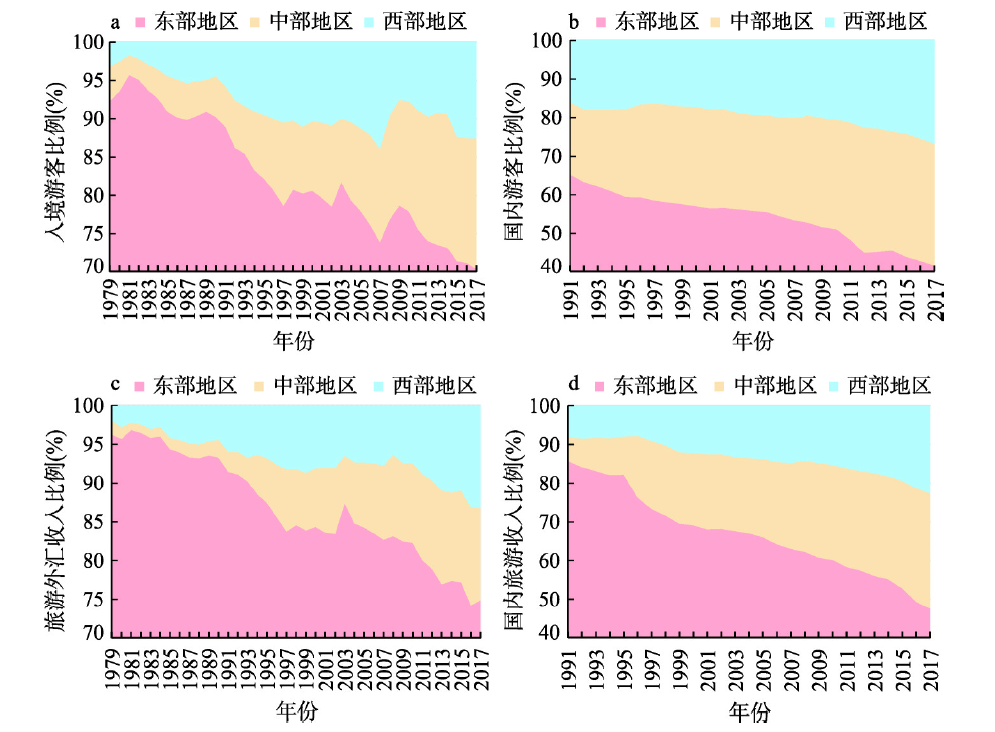
China's tourism development has made significant progress since the reform and opening-up policy officially launched in 1978. Now it is high time to conduct research on how and why the geographical pattern of China's tourism development has evolved in the previous four decades on national and regional scales. Employing grounded viable data sets (namely the inbound tourism data from 1979 to 2017 and the domestic tourism data from 1991 to 2017) and multiple vibrant data analysis approaches (including the Gini coefficient, the primacy index analysis, the hot spot analysis and the Pearson correlation analysis), this paper can draw three findings. (1) China's tourism can present a distribution pattern of "high in the eastern and southern parts, but low in the western and northern parts." Meanwhile, China's inbound tourism development has long been polarized, Guangdong is the "core" of inbound tourism, Beijing and Shanghai belong to the second tier, while Gansu, Xinjiang, Qinghai, Tibet and Ningxia lag behind. Meanwhile, the domestic tourism development has transferred from polarization to equilibrium distribution. (2) Different stages of China's tourism development exhibit various features and characteristics. Specifically, at the so-called initial modern tourism stage, inbound tourism was subject to extreme polarization, with Guangdong province taking a fatal and strategic role. Whereas, at the domestic tourism cultivating stage, the domestic tourism development in this nation was polarized spatially, though the landscape of the inbound tourism was hardly transformed (Guangdong the first, Beijing the second and Shanghai the third). When it came to the rapid development stage, Beijing was gradually surpassed by Shanghai in the realm of inbound tourism. In contrast, domestic tourism development was reasonably balanced. By the new normal stage, the landscape of the inbound tourism improved, and the first tier provinces began to take an increasing share in terms of domestic tourist reception capacity. Moreover, China's outbound tourism increased steadily at this stage, with Beijing and Shanghai playing leading roles in the citizens' overseas spending. (3) This research has identified multiple factors underlying the inbound and domestic tourism development in China, including policies, management systems, tourism demand, tourism attractions, economic level, consumption level, industrial development, investment status, traffic conditions, accommodation services, intermediary services and degree of openness.
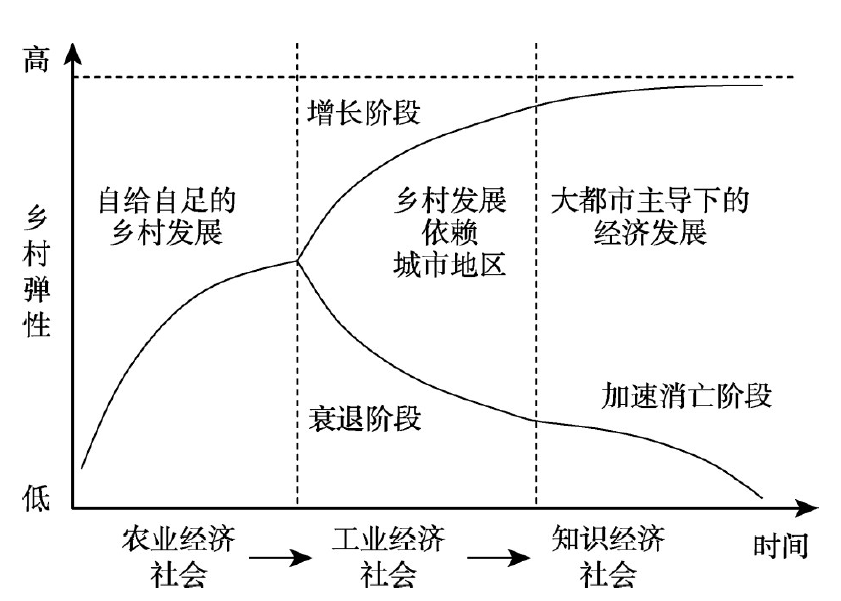
The rural decline which emerged in the process of human development and transformation has become a global trend, and rural revitalization is urgently needed. It is the only way to realize rural revitalization and sustainable development by scientifically and systematically grasping the development and evolution of rural regional systems, revealing the interaction mode of rural system and external development environment, as well as improving the rural resilience to resist and adapt to changes in the external environment. The article analyzes the development and evolution of rural regional systems and rural revitalization from the perspective of rural resilience. The study found that: (1) Rural resilience includes the resilience, adaptability and transformation ability of the rural system to the impact of external disturbances. (2) Rural development evolution differentiation is a comprehensive representation of the interaction between rural regional systems and the dominant factors of external development. In this process, the resilience of rural systems in different regions to resist external development disturbances has been improved or declined. (3) Creating multi-functional villages, implementing rural rectification projects, and cultivating rural social capital play an important role in promoting the construction of rural resilience. The article emphasizes that the rural regional system should be scientifically identified and differentiated implementation plans are formulated to cultivate and enhance rural resilience to achieve balanced function, structure and operation of rural system.
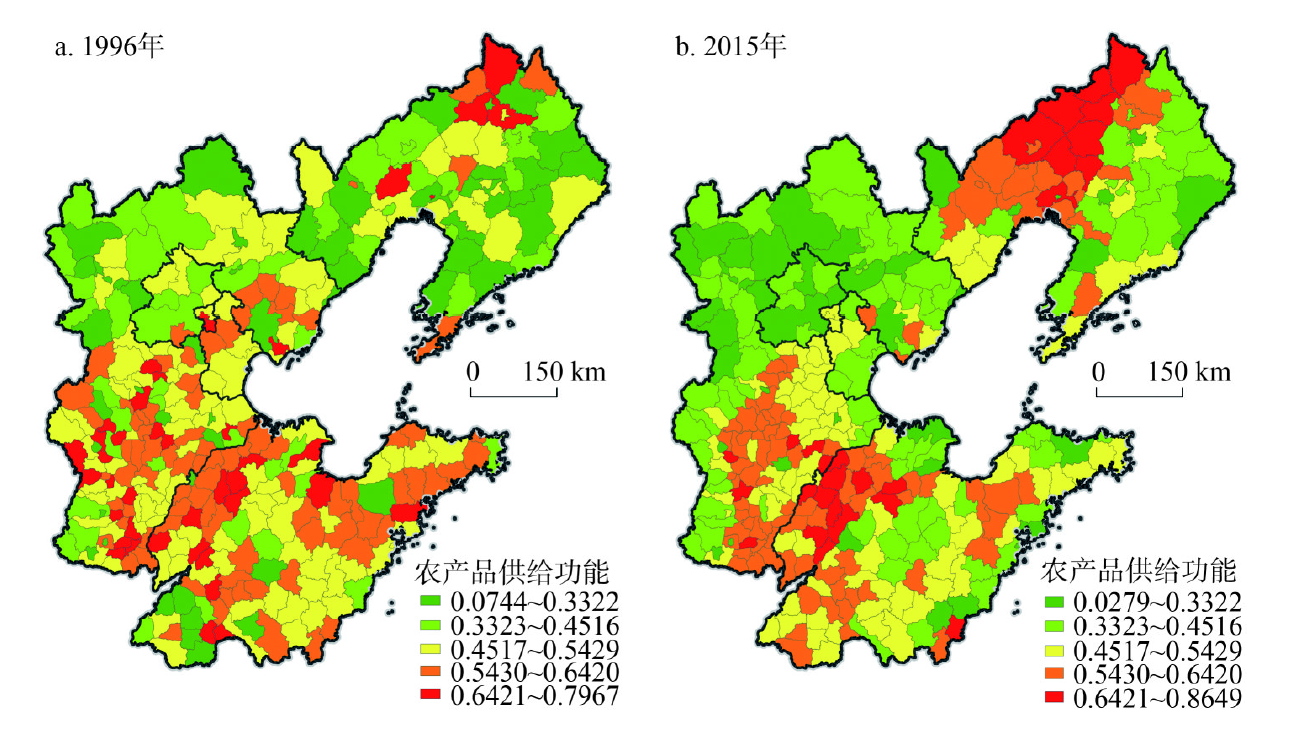
The agricultural regional function is an important scientific problem in agricultural geography research, and it is also the important practical issue related to the national food security and sustainable development of regional agriculture. Taking the Bohai Rim region of China as an example, this paper identified the agricultural regional function as four types including agricultural products supplying function (APF), labor employment and social security function (LEF), ecological conservation function (ECF), and cultural heritage and recreational function (CRF) and their spatial pattern and evolution process were explored. The study also identified the agricultural regional type and the impact factors affecting the four functions using cluster analysis method and spatial econometric model. The results indicate that: Firstly, the degrees of spatial concentration of the APF, LEF and CRF were low, while that of the ECF was high. The spatial distributions of the four functions presented obvious regularity. Secondly, the APF enhanced largely, its center of gravity was further concentrated in plain agricultural areas. The high value areas of the LEF shifted from inland to coastal areas. The ECF of hilly areas further highlighted. Advantage areas of the CRF were concentrating in the municipal districts and their surrounding counties. Thirdly, the leading counties of the APF were distributed in central and southern plains of Hebei province, the impact plain of northwest Shandong, the Jiaolai plain and the west of Liaohe plain. The leading counties of LEF were distributed in piedmont plain of Yanshan and coastal plain of Hebei province, Jiaodong Peninsula and the Yellow River Delta region. The leading counties of the ECF were distributed in Bashang plateau, mountainous region of Yanshan, hilly area of eastern and western Liaoning province, and the surrounding areas of Beijing-Tianjin-Hebei urban agglomeration. The leading counties of the CRF were distributed in the surrounding areas of central-south Liaoning urban agglomerations, Beijing-Tianjin-Hebei metropolitan region and Jinan metropolitan area. Comprehensive counties were distributed in the Huang-Huai plain and hilly areas of central-south of Shandong province. Fourthly, natural factors possessed a significant impact on the formation of the three functions including APF, LEF and ECF, while social and economic factors on the impact of the four functions were quite different. The study reveals the regularity and influence mechanism of the evolution of agricultural regional function, which can provide theoretical basis for scientific guidance of regional division of labor, strengthening of leading function, highlighting regional value and promoting regional coordinated development.
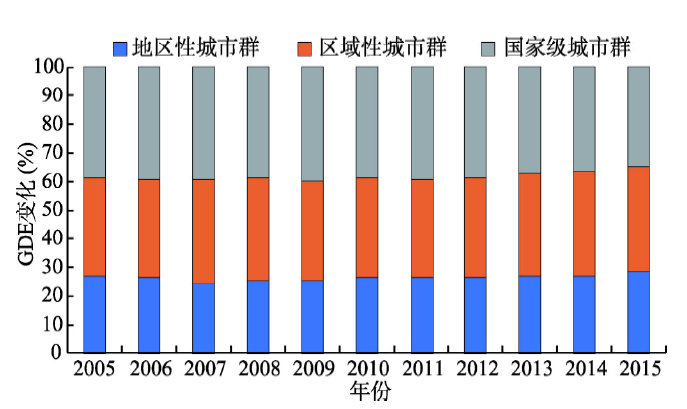
Green development is pivotal to resolving natural environmental constraints, solving national economic transition, and supporting and realizing the United Nations sustainable development goals. It is gradually growing into a crucial guideline for China's ecological civilization construction, "Beautiful China" development, and global economic transition and restructure. Based on a thorough review of the concept of green development, this paper accurately depicts a full picture of China's spatio-temporal patterns of urban green development efficiency (UGDE) in 2005-2015 by using SBM-Undesirable, the Theil index and the Spatial Markov Chain methods. Moreover, the influencing mechanism has been further discussed based on a quantitative analysis of both natural and human factors. Our results demonstrate that: (1) UGDE increased steadily by 10% from 0.475 in 2005 to 0.523 in 2015. And temporally, it shows a pattern of "W"-shaped fluctuated growth. (2) Spatially, UGDE decreased from eastern to central China, and further to western China. Besides, there is an inverted pyramid pattern of "national level > regional level > local level" urban agglomeration in UDGE growth. Moreover, there is a steady urban scale structure from super city to small city in UDGE. (3) There is an evident concentration of cities with high-level and low-level UDGE, indicating a significant influence of path dependence. (4) Quantitatively speaking, compared to natural factors, human factors such as economy size, industry structure, and openness level play a more important role in influencing the UDGE.
Agglomeration externality is an important mechanism for reducing industrial pollution emission. Different agglomeration patterns correspond to different pollution emission behaviors and effects. Based on the theory of agglomeration economies and the industrial data from 285 China's prefecture-level cities, this paper differentiates the agglomeration patterns into different types such as agglomeration density, geographical proximity, specialization, diversity, related diversity, and unrelated diversity from the spatial and organizational perspectives, and investigates the spatial patterns of industrial SO2 pollution intensity and industrial agglomeration levels, and examines the effects of different agglomeration types on industrial SO2 emissions by building econometric models. The main conclusions are as follows: (1) There exists the asymmetric spatial distribution between the industrial SO2 pollution intensity and the industrial agglomeration levels. The pollution intensity is higher in the west, but lower in the east. The levels of agglomeration density, geographic proximity, diversity, related diversity and unrelated diversity are higher in the eastern and central regions, but lower in the western. (2) There is the spatial spillover effect of industrial agglomeration on industrial SO2 pollution. The geographical agglomeration, diversity, and related diversity in neighboring regions have a negative impact on industrial pollution, while specialization has a positive effect. (3) Raising the agglomeration scale and guiding enterprises concentrated in industrial parks can help to reduce industrial SO2 emissions, and promoting the diverse and related industrial agglomeration is conducive to pollution reduction, while unrelated industries agglomeration will increase pollution emissions. (4) The impact of industrial agglomeration on industrial SO2 emissions has a notable spatial heterogeneity. Agglomeration density, geographic proximity, diversity and related diversity play a more significant role in pollution reduction in the central and western regions, while specialization and unrelated diversity are not conducive to pollution reduction in the eastern and central regions; Increasing agglomeration density and reducing diversity and unrelated diversity level are more beneficial to the small cities; Improving the geographic proximity, industrial diversity and related diversity levels are more helpful to the medium- and small-sized cites, but the reduction effect for the large cities goes obviously down because of the crowding effect. (5) To further reduce the intensity of industrial SO2 emissions, it is necessary to take the road of agglomeration, persist on increasing agglomeration density, guide enterprises' centralized layout, improve the level of industrial diversity based on technology association, strengthen the joint prevention and control among neighboring regions, and focus on the industrial linkage and environmental protection cooperation between regions.
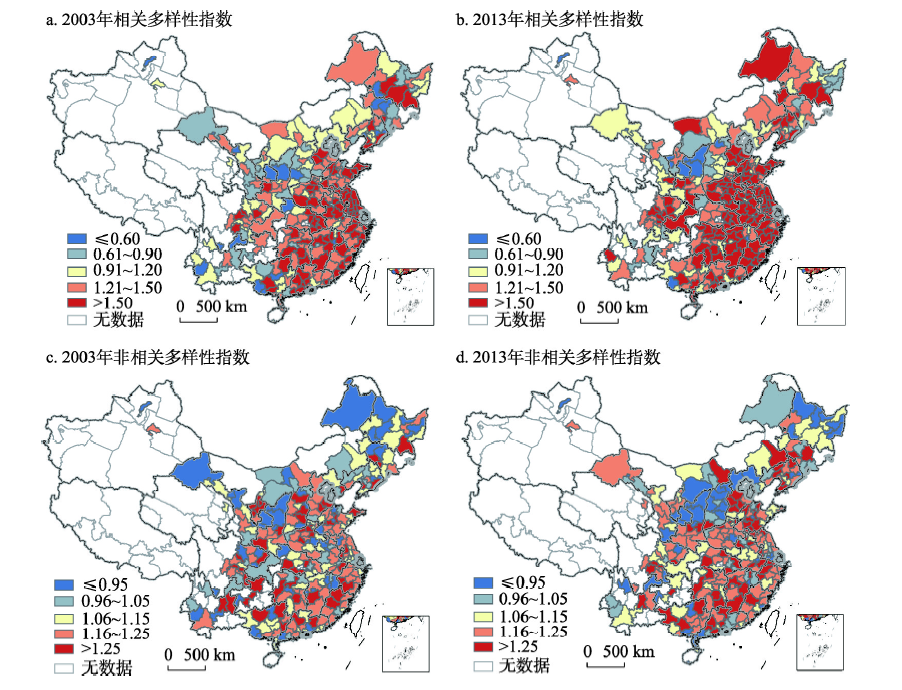
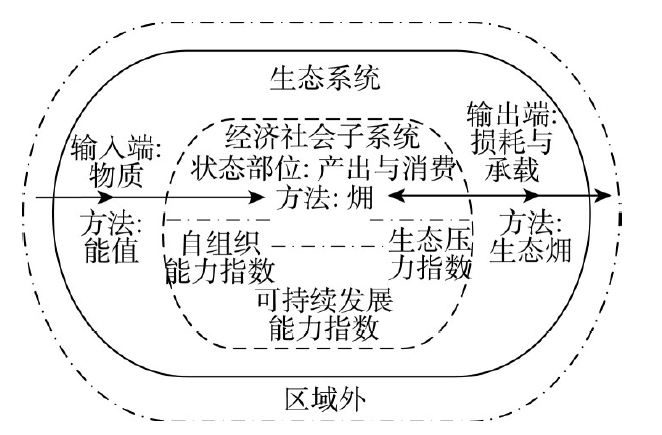
Methods for the evaluation of sustainable development capability are important and highly sought after tools for identifying the synergistic relationship between humans and the environment and guiding scientific decision-making for the implementation of ecological and environmental protection measures. Compared to traditional methods such as ecological footprint, environmental sustainability index, and human development index, emergy analysis and exergy analysis result in smaller errors and are more objective. These two methods can directly convert materials and services into energy units, without evaluation indicators and weight settings, and do not require raw dimensionless data. Exploring the coupling of emergy analysis and exergy analysis can provide a new perspective on and method for the analysis of regional sustainable development capabilities. Based on a literature review, a theoretical analysis framework was constructed. This study proposes an emergy and exergy coupling model for the analysis of sustainable development capability based on a thermodynamic theory. This analytical model has three indices, namely, self-organizing capability index (SO), ecological pressure index (EP), and sustainable development capability index (SC). The emergy and exergy input and output values of 17 typical developed countries in 1985 were screened via meta-analysis to calculate the SO and EP thresholds of the model, based on which sustainable development capability was divided into four stages. The model was tested via a comparative analysis of the sustainable development capability of China and the USA in 1985-2015. The results show that China was in the low self-organizing capacity and low ecological pressure stage before 2005. After 2005, it entered the low self-organizing capability and high ecological pressure stage. It has had low eco-efficiency and scale expansion driving characteristics. The USA is always in the high self-organizing capacity and high ecological pressure stage, and is characterized by high ecological efficiency, and economic and ecological decoupling. These results are consistent with the findings of the World Ecological Footprint Network and World Wildlife Fund, indicating that the proposed model is adaptive and reliable. In addition, the study results indicate that this model can express the ecological efficiency of an economic and social system in terms of "total annual exergy amount used/annual emergy input amount". Moreover, it can express the ecological pressure as "annual exergy loss of an economic and social system/annual eco-exergy produced by an ecosystem." This model connects the entropy path of an economic and social system to the ecosystem. Furthermore, it can identify sustainable development stage and analyze changes in sustainable development level and factors driving these changes. From an anthropological and ecological perspective, the model expresses the ecological efficiency of an economic and social system, evaluates the proportion of ecological space occupied, and can combine macroscopic scale with microscopic efficiency analysis, which is an improvement over conventional methods.
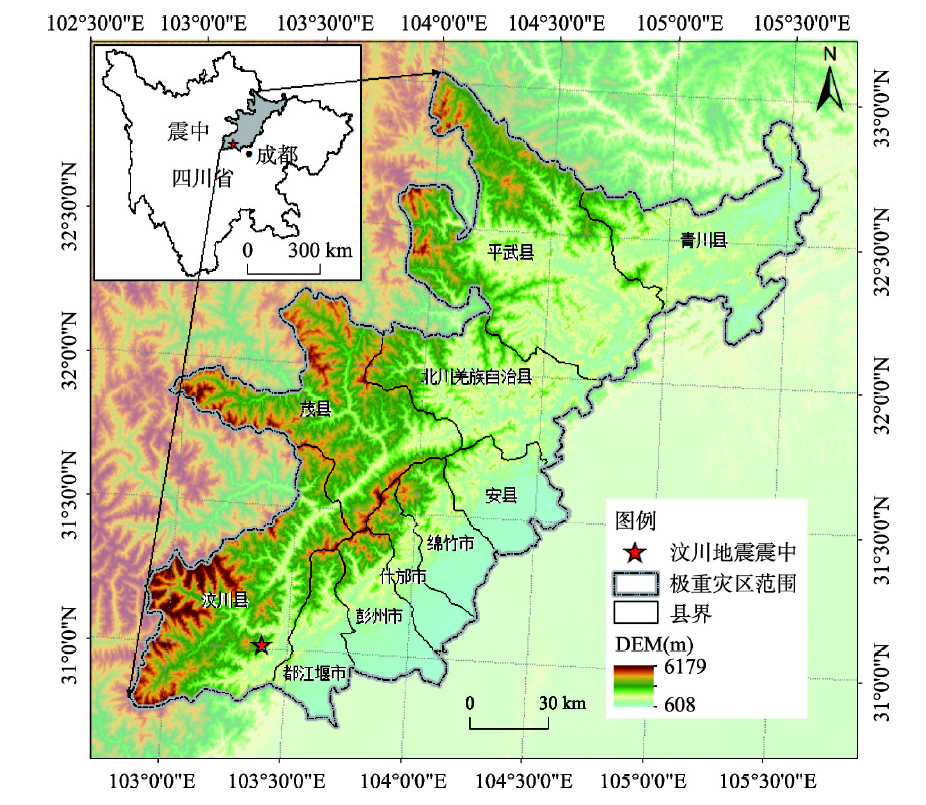
It is of great significance to enhance disaster prevention and response capacity to reveal the post-disaster economic development and recovery process, and to formulate the control policies and recovery methods for post-disaster economic reconstruction according to the economic resilience. Based on the long-term socio-economic data and ARIMA model, this paper calculated the economic resilience index of severely affected area of Wenchuan earthquake, and adopted the improved Variable Return to Scale (VRS) DEA model and Malmquist productivity index to analyze the efficiency and effect of annual post-disaster recovery. The results show that: (1) The economic resilience index of earthquake severely affected area is 0.877. The earthquake caused a short-term economic recession in the affected areas, but the economy returned to its pre-quake state within two years. In addition, the industrial economy is less resilient than agriculture and service industries. (2) The comprehensive economic recovery efficiency of the disaster-stricken area in the year after the disaster is 0.603. The comprehensive efficiency, pure technical efficiency and scale efficiency of the plain hilly area are significantly higher than those of the plateau mountain area. (3) The annual fluctuation of total factor productivity after the disaster was strong, and the economic recovery efficiency declined significantly, resulting in a short-term economic recession. The TFP index returned to steady state after a decline of 33.7% and 15.2% in the two years after the disaster. (4) The significant decline in the post-disaster recovery efficiency is mainly caused by technological changes, and the renewal of production system is the leading factor in determining the economic resilience after the disaster. With the decline in the scale of economic recovery, the long-term economic recovery in the study areas mainly depends on pure technical efficiency, and the improvement of pure technical efficiency is the driving force to maintain the long-term growth of post-disaster economy. Therefore, in view of the differences between the reconstruction of natural conditions and the stage of economic development, the disaster-stricken areas need to change and readjust their economic structures actively. Meanwhile, we should pay attention to updating production system to enhance the level of technological progress, and give full play to the scale effect of large-scale capital, facilities, manpower and other factors investment, so as to enhance the response to the disaster impact of economic resilience and recovery efficiency.
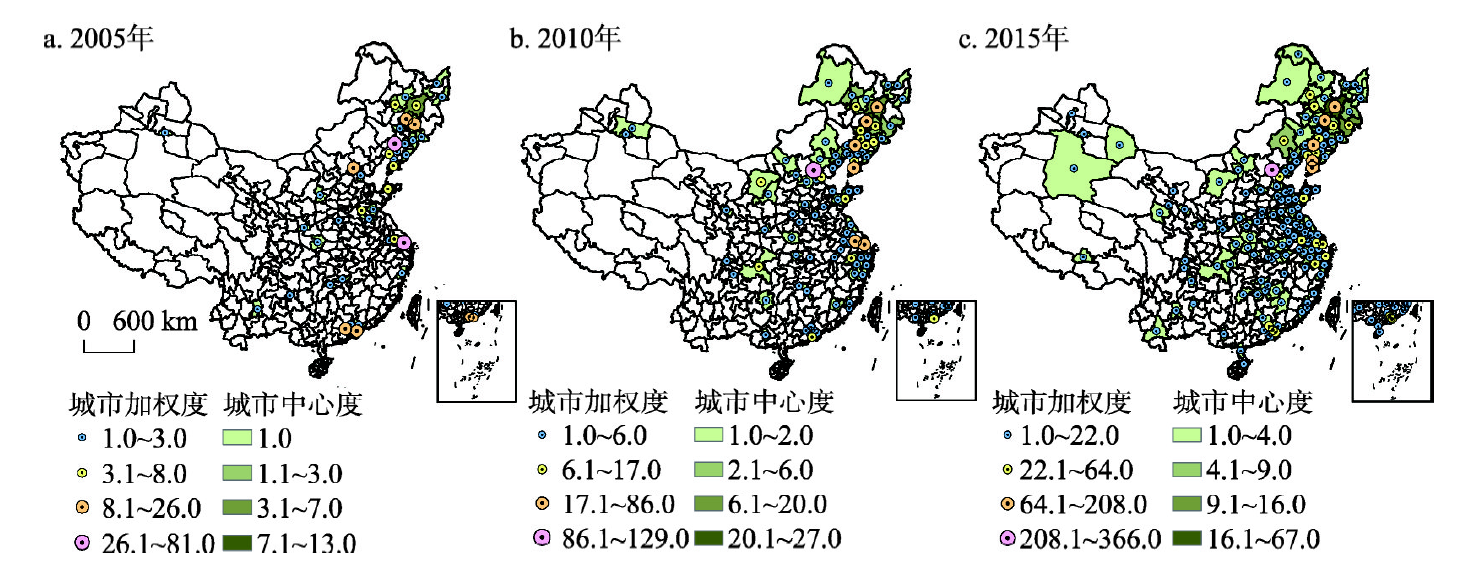
Interurban technology transfer becomes an essential channel for regions or cities to obtain external knowledge. Based on patent transaction data among cities during 2005-2015, this study investigates the interurban technology transfer network of Northeast China, aiming to explore spatial evolution of technology transfer network in this region from national to local perspectives based on social network analysis (SNA). A negative binomial regression analysis further reveals the factors of interurban technology transfer network. The results of the study are as follows: (1) From the national perspective, the interurban technology transfer network of Northeast China presents a core-periphery structure. The spatial pattern of "divergence in the northeast region" and "convergence in the coastal areas" has been formed. (2) From the local perspective, the technology transfer network of Northeast China shows a centripetal contraction situation, and its four hubs, namely, Harbin, Changchun, Shenyang and Dalian, play the role of technology gatekeeper. The interurban technology transfer flows present the characteristic of strengthening nationalization and weakening localization, which are more likely to emerge between the Northeast-Southeast China rather than among the Northeast China. (3) Both path-dependence and path-creation exist in the spatial dynamics of intercity technology flows in Northeast China. From the national perspective, technology flows from Northeast China to the Beijing-Tianjin-Hebei, Yangtze River Delta and Pearl River Delta urban agglomerations with Beijing, Shanghai and Shenzhen as the core respectively, while the local intercity technology transfer in Northeast China presents a mixed diffusing mode including hierarchical, contagious and jump diffusions. In addition, the local network mainly focuses on intra-provincial technology flows which centered on Haibin, Changchun, Shenyang and Dalian. (4) Some drivers, such as geographical proximity, the similarity of industrial structure, economic differences, the similarity of innovation capability, technology absorptive capacity, foreign direct investment, are evidenced to play a significant or determining role in interurban technology transfer of Northeast China.
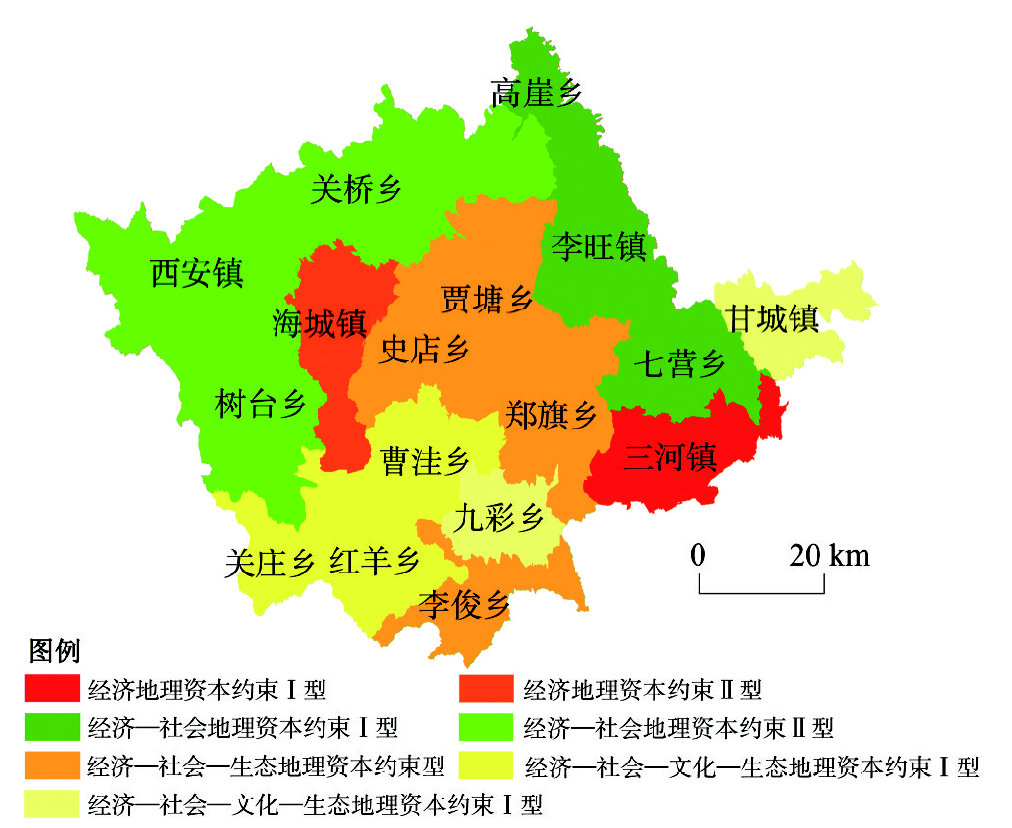
The development of development geography stems from the study of underdeve-lopment and poverty. On the basis of combing the development process, basic theories, analytical models and methods of development geography, and combined with China's academic exploration of regional overall poverty alleviation and localization and poverty reduction of sustainable development, this paper constructs an analytical framework of development geography of poverty in underdeveloped areas, and establishes the "five-in-one" geographical capital index system composed of economic geographical capital, social geographic capital, cultural geographic capital, ecological geographic capital and political geographic capital. The integration method and technical flow of data processing are put forward to analyze the local differentiation of poverty in underdeveloped areas. The results show that: (1) Geographical detection determined the leading geographic capital that plays a role in poverty, and the determinative force of each leading geographic capital on the poverty incidence LA,P ≥ 0.15; (2) Under the action of different dominant geographical capitals, the five single-dimensional geographic capital indexes and their synthetic regional geographic capital indices have obvious local differentiation, and have the characteristics of barrier and time delay; (3) The poor local differentiation can be divided into four types: economic geographical capital constraint, economic-social geographical capital constraint, economic-social-ecological geographical capital constraint, and economic-social-cultural-ecological geographical capital constraint; (4) Based on the characteristics of development, we tap the local dynamics and put forward the targeted countermeasures and models of different types to alleviate local poverty. Under the background of rural vitalization and the 2020 poverty alleviation shift, it is necessary to focus on the comprehensive research on spatial differentiation, spatial diffusion and spatial integration of poverty in less developed areas, so as to provide development geographical solutions for localization and poverty reduction of sustainable development.
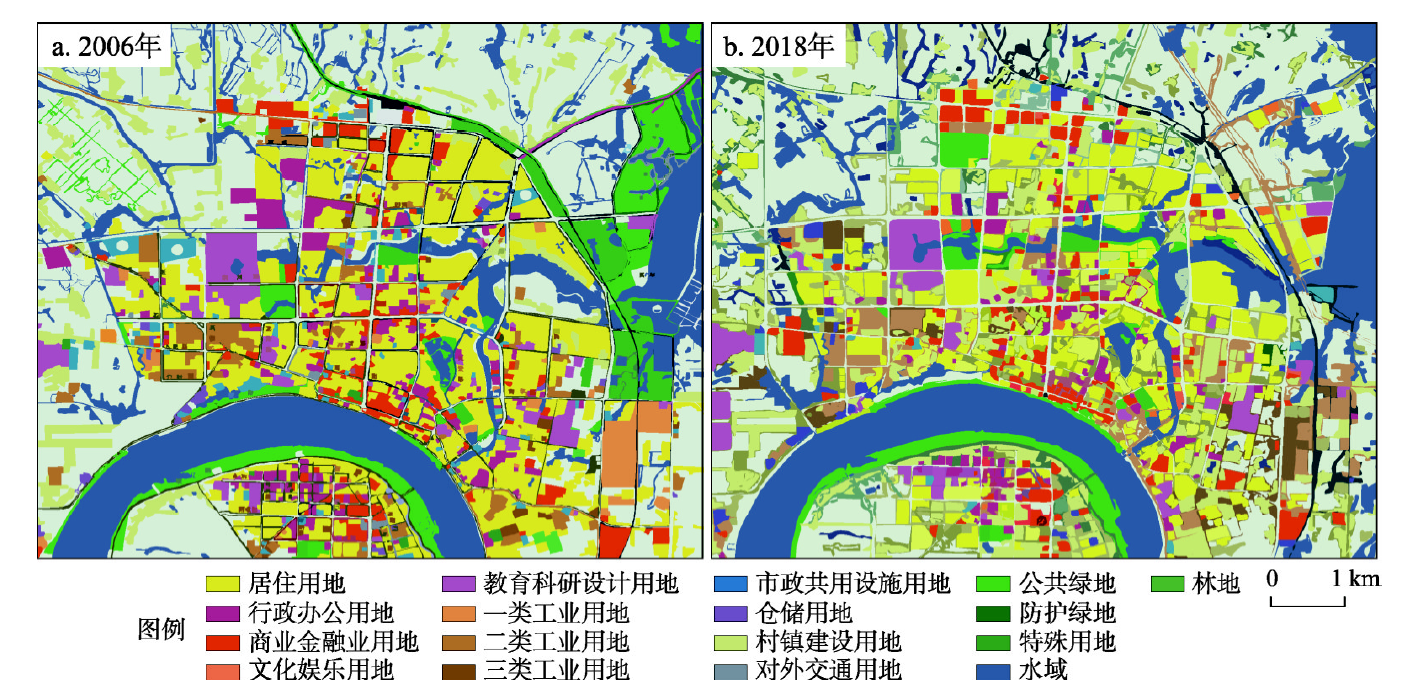
Sponge city construction (SCC) is regarded as one of the effective ways to solve the urbanization problems in China, such as waterlogging, water pollution, water shortage and heat island. Since 2015, a total of 30 pilot cities had been set up as sponge cities for providing the models of a nationwide SCC in the future. Nevertheless, the studies about the SCC mainly concentrated on its concept, planning and goal in some pilot cities, few are known about the changes of the ecological effects under the SCC. As the first city in China to accept the sponge city concept and put it into practice, the Changde city, Hunan province, with the Chuanzi River catchment as the study area, provides the ideal area to evaluate the ecological effects under the SCC in China due to a longer SCC history over the period of 2004-2019. In this study, the ecological effects under the SCC in this catchment were analyzed based on field investigation and the comparsion of the measured data of hydrology, vegetation, and temperature before and after the SCC. The results showed that the SCC effectively alleviated the waterlogging in the Changde city, but some waterlogging sites still presented at the different areas in the catchment under the rainstorm. Meanwhile, the water quality in the Chuanzi River had been generally improved from bad Ⅴ to Ⅲ grade, but there was periodically deterioration due to the pollutants enrichment in the water during the winter seasons, which were the results from both closed water system and low temperature environment. In addition, the biodiversity in the catchment had significantly increased, but it also showed some existing problems at the same time including single plant species, few plants with environmental purification functions, incomplete ecosystem and poor management. Besides, the SCC had alleviated the heat islands in summer in the Changde city to some extents. As a result, the SCC over the period of 2004-2019 in the Changde city has significantly improved the ecological effects at the Chuanzi River catchment, which provides an important ecological basis for the socio-economic development and the improvement of the living environment in this area, and provides the reference for the reasonable evaluation on the SCC effects in other pilot cities in China.
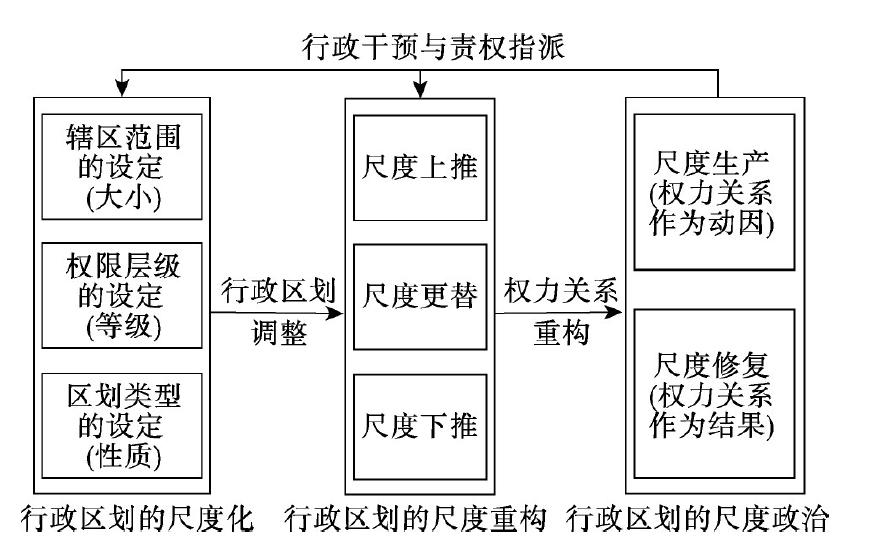
Administrative adjustment is a hot topic in many sub-disciplines of Chinese human geography, such as administrative regional geography, historical geography and economic geography. However, with most of the research focusing on the summarization of types, processes, impacts and practices based on inductive methods and case studies, few have proposed a general theoretical framework to explain the co-evolution of administrative adjustment and power relations. This paper tries to narrow this gap by developing a heuristic theoretical model of administrative adjustment based on the perspective of "politics of scale" and proposing a typology of rescaling and the dialectics of politics of scale in administrative adjustment. Specifically, we argue that there are mainly three types of "rescaling" in administrative adjustment, i.e. the change of order in administrative hierarchy, the transformation of territorial border or size, and the emergence of new institutional arrangement based on various administrative divisions. The "politics of scale" in administrative adjustment mainly includes two supplementary processes, i.e. the political production of scale (administrative division) and the scalar fix of administrative power relations. In both processes, the strategies of up-scaling, down-scaling and rescaling are adopted by various agencies at different levels of administrative regions. We also point out that the rescaling and politics of scale in administrative adjustment are synthetical, dynamic and dialectical. First, a specific process of administrative adjustment is associated with transformations in different forms of scale. For example, establishing a municipal city usually includes both scaling-up process in terms of county becoming city and scaling-down process since the new city only incorporates part of the original region. Second, administrative division is dynamic both as the outcome of power struggling and as the foundation of future power relations. Some forms of administrative adjustment recurred in the history. Third, similar to the uncertainty principle in physics, there is a contradiction between the size of administrative region and the degree of control of that region. As a result, the political agents tend to adopt scalar strategies to run contrary to their relative position within the scalar hierarchy, i.e. the powerful agents at higher level of administration tend to adopt down-scaling strategies and the powerful agents at lower level of administration tend to adopt up-scaling strategies; however, the tendency of scalar strategies would be to the opposite for the weak agents. This paper may not only advance the research on administrative division, but also enrich the theories of "politics of scale" which are mainly proposed based on Western practices and cases.
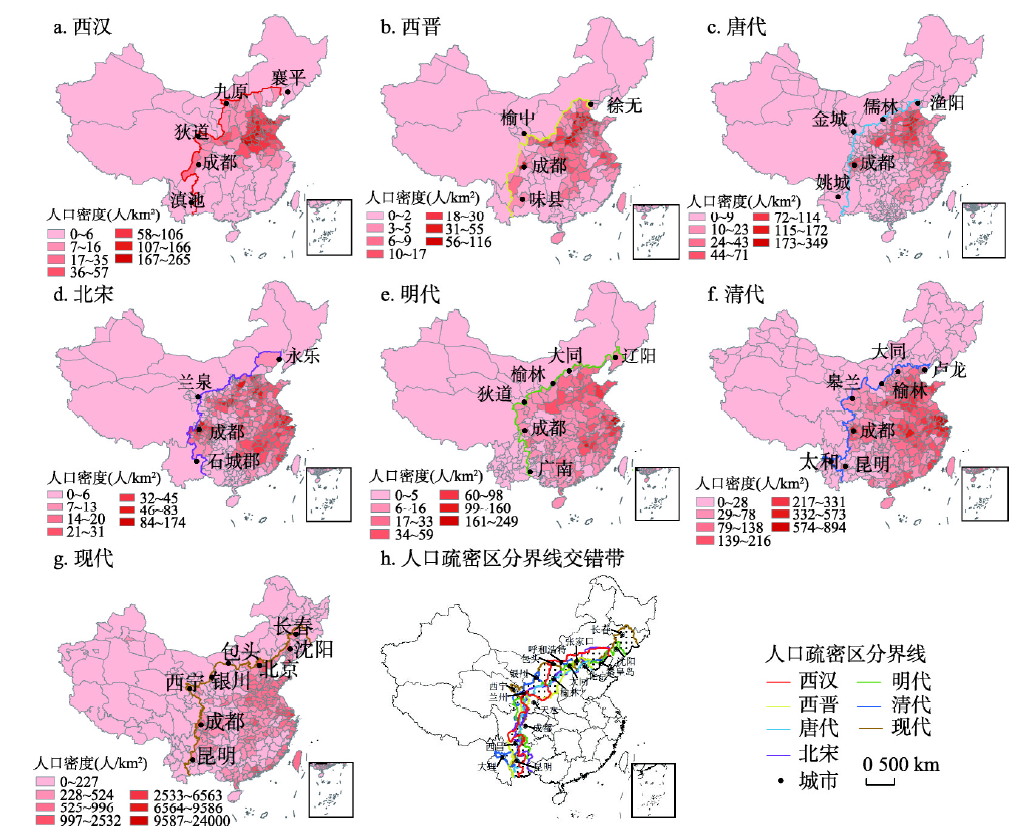
By the methods of historical temporal section and modern spatial analysis, this paper analyzes the change of population distribution in China since the past 2000 years ago, such as the Western Han Dynasty (the representative year A.D. 2), the Western Jin Dynasty (A.D. 280), the Tang Dynasty (A.D. 742), the Northern Song Dynasty (A.D. 1102), the Ming Dynasty (A.D. 1460), the Qing Dynasty (A.D. 1820), and the present (A.D. 2010). It is found that China demographic borderlines dividing sparsely and densely populated areas are the borderlines which divide farming and pastoral areas, and the pattern of China's population distribution depends on the spatial differentiation of China's farming and pastoral areas. Therefore, theoretically the fitting curve of sparse-dense borderlines of China's population distribution in various times can be seen as the fitting curve of the farming-pastoral ecotone. The history has proved that China's farming-pastoral ecotone is an arc-shaped belt, so it can not be fitted by straight line but by arc-curve. Shenyang-Tianshui-Dali Arc is a function fitting line of the ecotone; Shanhaiguan-Lanzhou-Fangchenggang Arc is a fitting of the inner edge curve of the ecotone, which is a farming-pastoral borderline when the empire's rule was not so strong; Shenyang-Lanzhou-Xishuangbanna Arc is a fitting of the outer edge curve of the ecotone, which is another farming-pastoral borderline when the empire’s rule was very strong. As for Aihui-Tengchong Line, theoretically, it cannot fit the arc-shaped farming-pastoral ecotone, but coincidentally, because of being the tangent of Shenyang-Tianshui-Dali Arc, it can also depict the macro pattern of China's population distribution. China's demographic borderline dividing sparsely and densely populated areas is of geographical significance: first, the line is an farming-pastoral borderline of historical China; second, it, along with the coastline, encircles the "National Core Area" of China, in term of political geography; third, it, to the greatest extent, distinguishes the natural and human geographical differences existing in the northwestern and southeastern China.
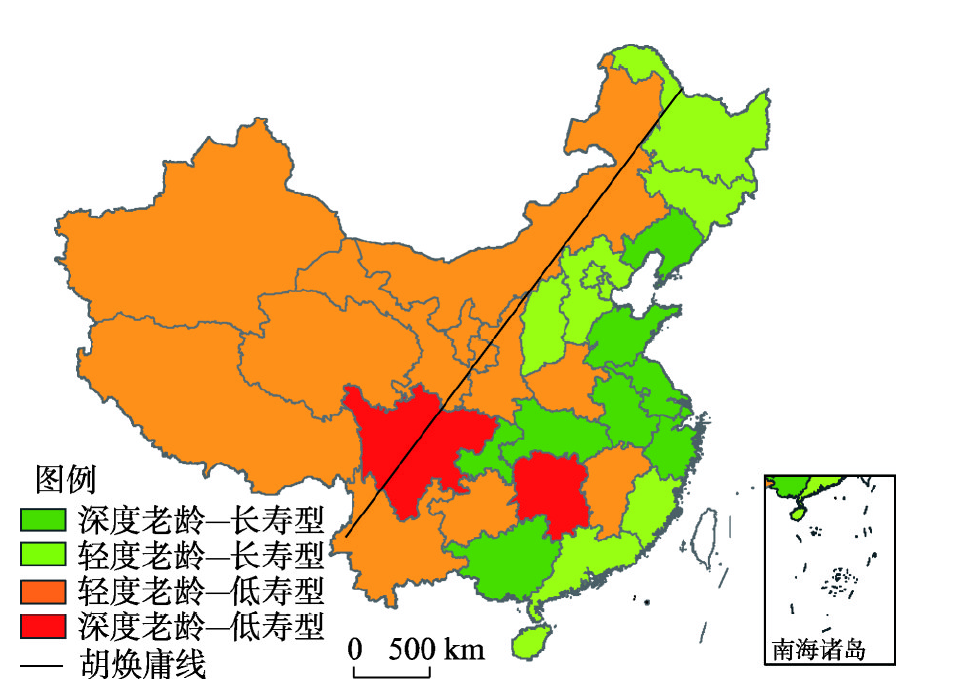
Based on the Sixth National Census and annual China Statistical Yearbook, the paper characterizes the spatial patterns and variation features of the "quantity" and "quality" of China's aging and its mechanism over the past 30 years or more by using spatial autocorrelation, Sullivan healthy life expectancy measurement model, and geographical weighted regression. The results are shown as follows: (1) Overall, the development of "quantity" of aging is not coordinated with that of "quality", and there are spatial differences between them. (2) In terms of "quantity", the figure of aging in the southeast half of "Hu Huanyong Line" is higher than that in the northwest half, but the change of growth rate has a phased feature. There are high and low value agglomeration areas at the aging level. The high-value agglomeration area expands from the coastal area to the inland area, while the low-value agglomeration area located in the northwest of China is gradually shrinking. (3) In terms of "quality", the figure of the southeast half of "Hu Huanyong Line" is better than that of the northwest half, and the eastern coastal provinces enjoy far higher figures than other regions. (4) In terms of "quality" characteristics represented by life expectancy, the figure of the life expectancy and the healthy life expectancy are not synchronized, and there are gender differences and morbidity expansion effect. Compared with the central and western regions, the eastern region has higher life expectancy and healthy life expectancy. (5) From the perspective of formation mechanism, the formation of the "quantity" pattern of aging is affected by the interaction between natural and migrating population variations, with the birth rate being the major element. As for "quality", differences in natural environment and uncoordinated development of social environment are significant factors affecting life expectancy, and economic development and the health and medical services progress are the main driving forces for greater longevity.
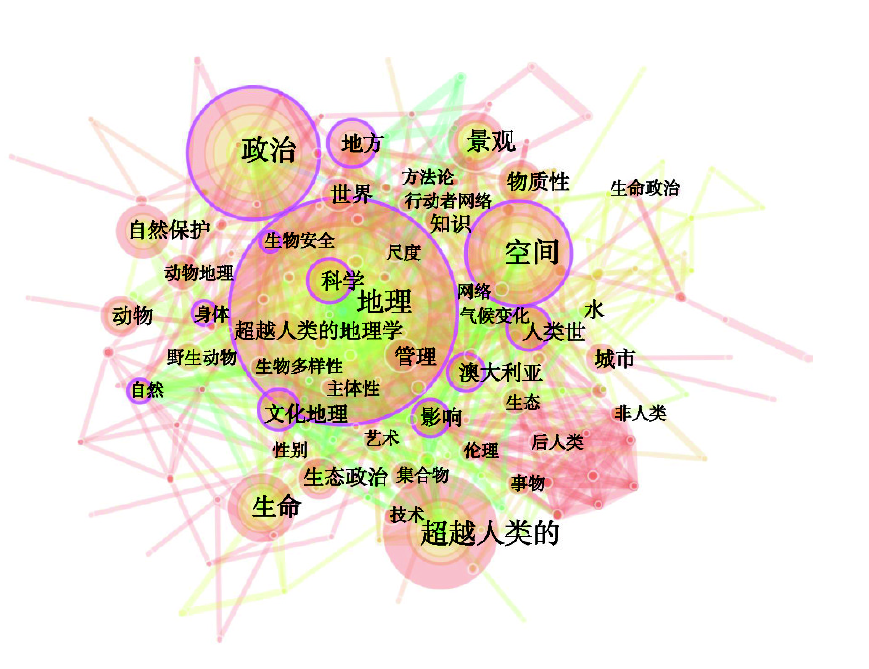
Along with the growing public awareness of the impossibility of separating nature from society and the difficulty of dividing the world neatly into spaces of 'human' and 'non-human', more-than-human geographies become increasingly popular in exploring the human-nonhuman assemblages in Western countries. However, existing literature demonstrates that the investigation of more-than-human geographies has received insufficient attention from non-Western countries, including China. Based on a systematic analysis of journal papers published in the Core Collection of Web of Science over the last 15 years, this article is dedicated to introduce the more-than-human geographical thoughts and approaches into China. The software Citespace has been used to analyze a total of 298 journal papers published from 2002 to 2017 in the Core Collection of Web of Science, among which the main themes can be generalized into five categories: new animal geographies and natural conservation, urban culture and political ecology, materiality and commodity economy, body and life health, climate change and environmental issues. New animal geographies have usually been understood as comprising the mainstream of more-than-human geographies, while the last two topics have been regarded as new fields. This article first investigates the core views of three philosophical and theoretical ideas which inspired the development of more-than-human geographies and explained how these insights influence the associated thoughts and approaches. Moreover, to show more details about what kinds of assemblages more-than-human geographies are interested in, this article introduces the content of each category with classical case studies. Finally, the primary contributions and critiques of more-than-human geographies are also presented. China's rich natural products and multiple social cultures, as well as the rapid development of science and technology mean that there is a potential for Chinese geographers to provide more interesting and vivid investigations for more-than-human geographies in the Chinese context.