
Close×
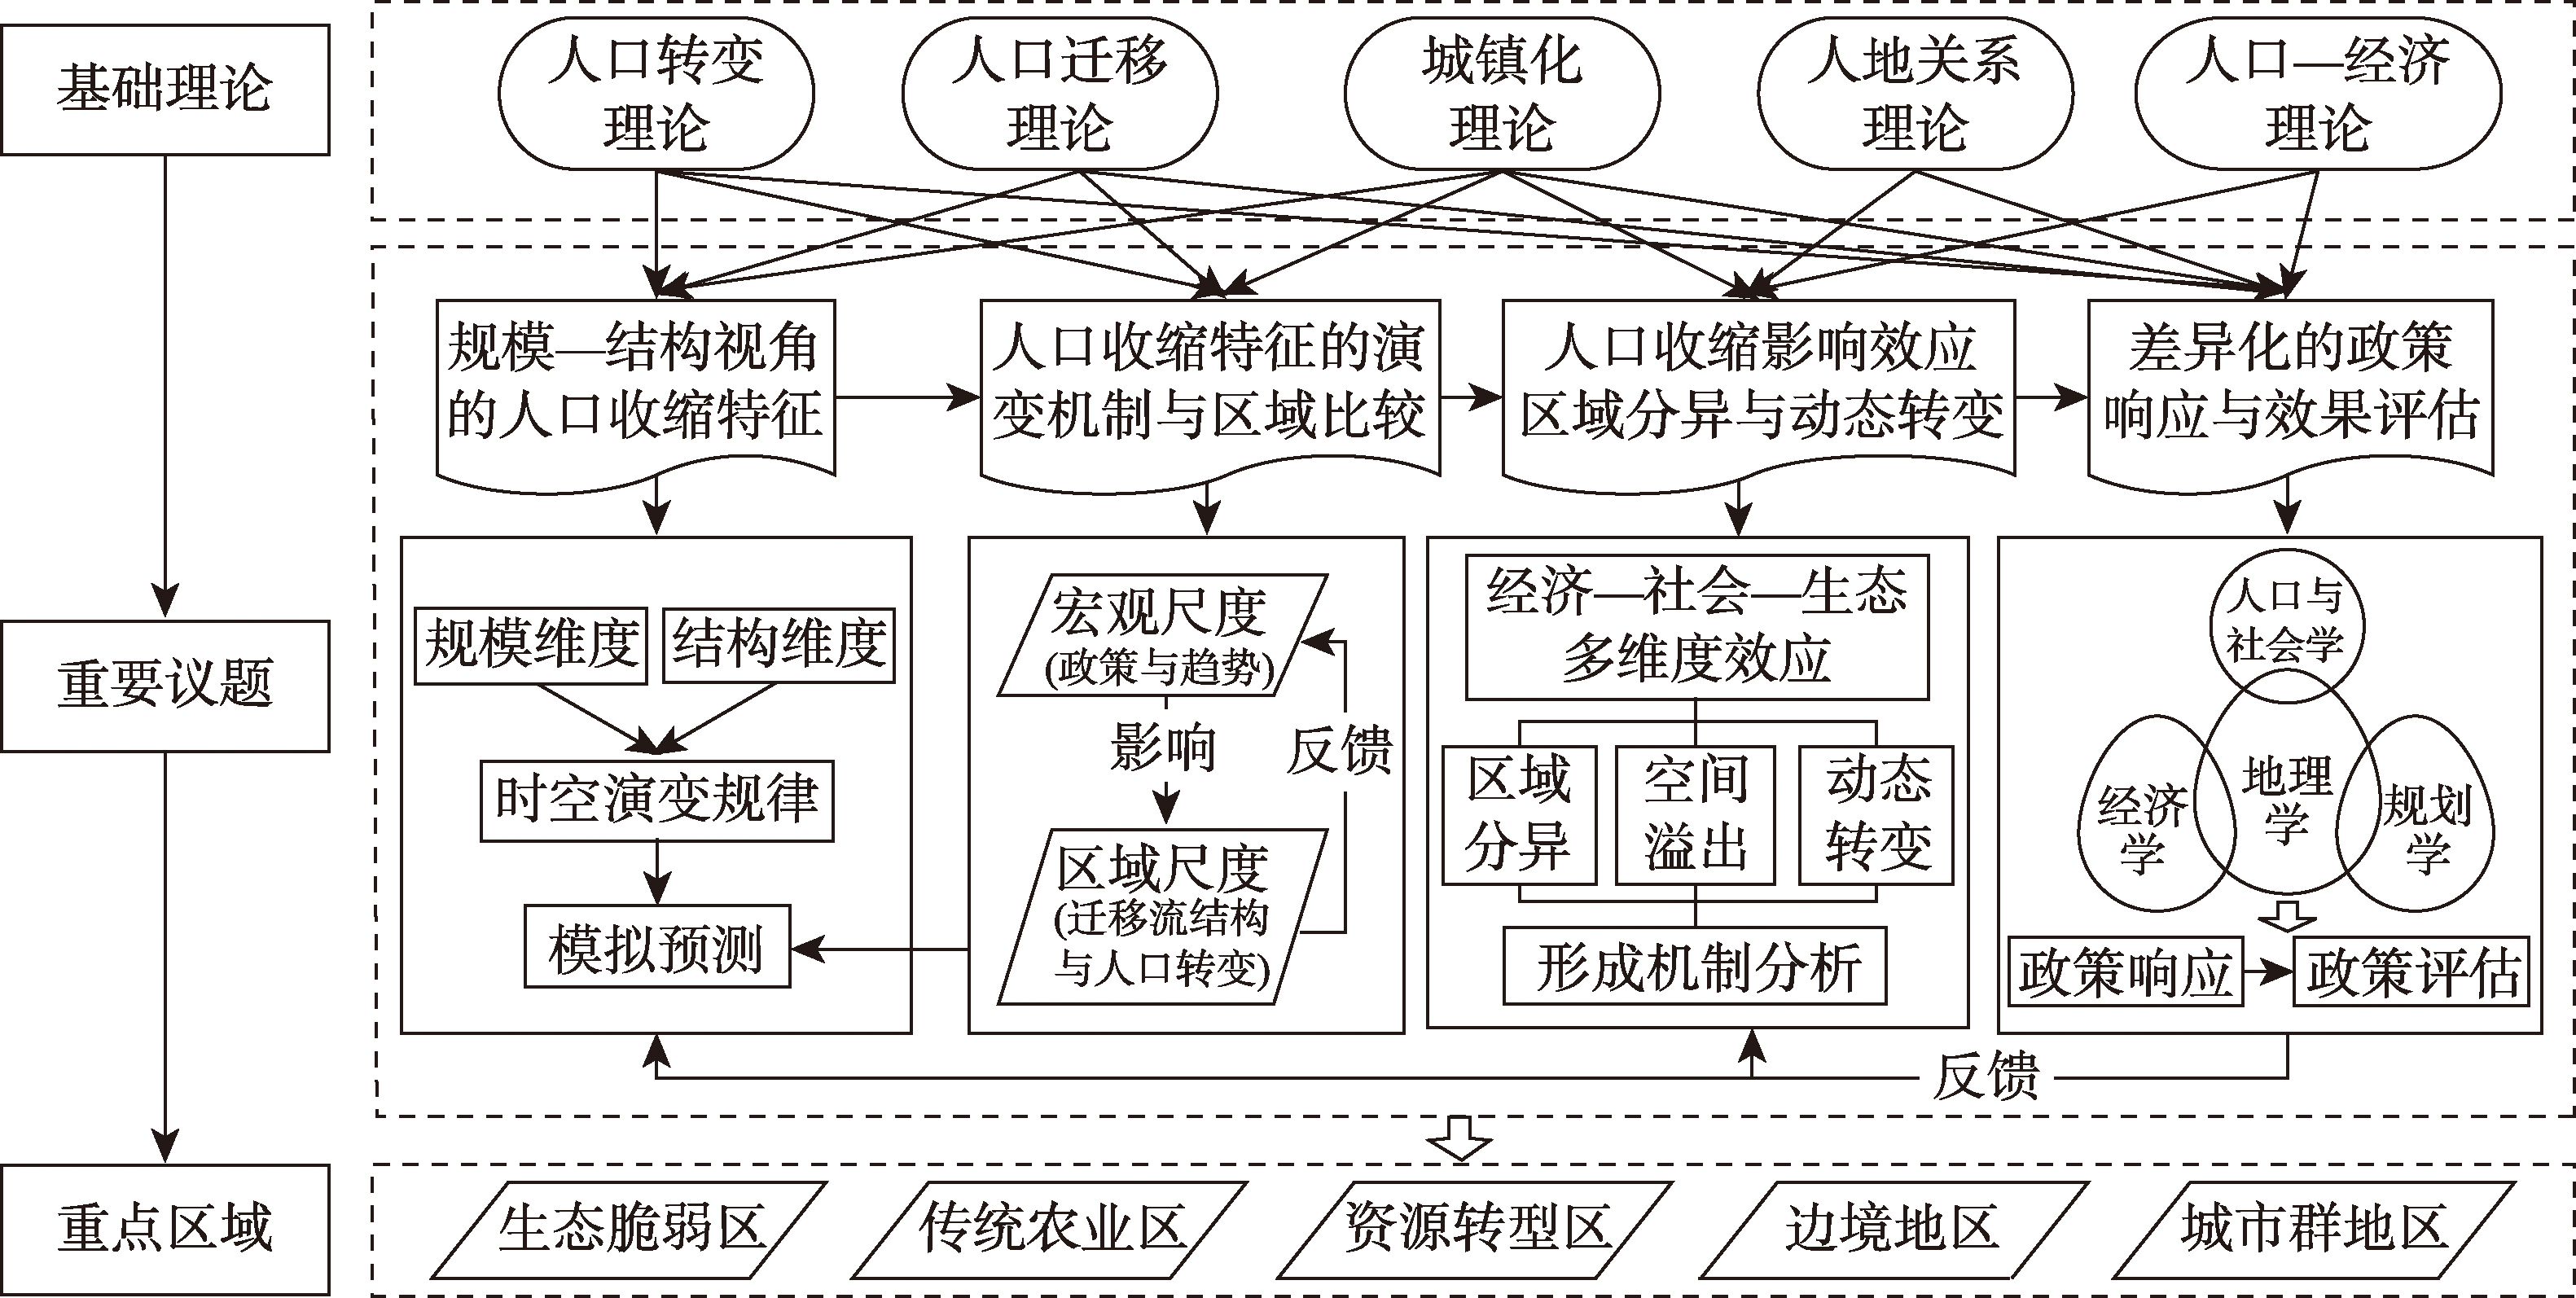
Population shrinkage is found across regions in China and may strongly impact the country's future sustainable economic and social development. Due to its marked regional differences, a geographical perspective is crucial to understanding population shrinkage. This paper defines population shrinkage, reviews current geographical research on the issue, and discusses future research directions concerning its evolutionary patterns, influencing factors, effects on regional development, and policy responses. The findings are as follows: (1) Based on existing research on the scale of population shrinkage, more in-depth analysis of its characteristics and evolutionary patterns should be conducted from a structural differentiation perspective, as well as making better predictions of future regional-scale population shrinkage patterns. (2) To improve understanding of the mechanisms underlying regional population shrinkage, the interplay between macro-level and regional-level factors should be considered. Population shrinkage mechanisms should be analyzed from both structural and dynamic perspectives, with greater emphasis on identifying differences in their evolutionary mechanisms across regions with varying developmental backgrounds. (3) More research attention should be directed toward exploring the effects of population shrinkage on regional sustainable development in terms of economic, social, environmental, and other key dimensions. Regional and urban-rural differentiation characteristics of these effects should be analyzed, exploring how they may transform dynamically over time. (4) Further in-depth discussion is needed on the related key issues of population shrinkage in different regions, including ecologically fragile areas, traditional agricultural areas, resource-based regions, border regions, and city cluster regions. Differentiated strategies to address population shrinkage in these regions should be explored, alongside strengthening the evaluation of policy implementation effects. Our results offer implications for future research on population shrinkage from a geographical perspective and facilitate dialogue between geography and other disciplines engaged in population shrinkage research.
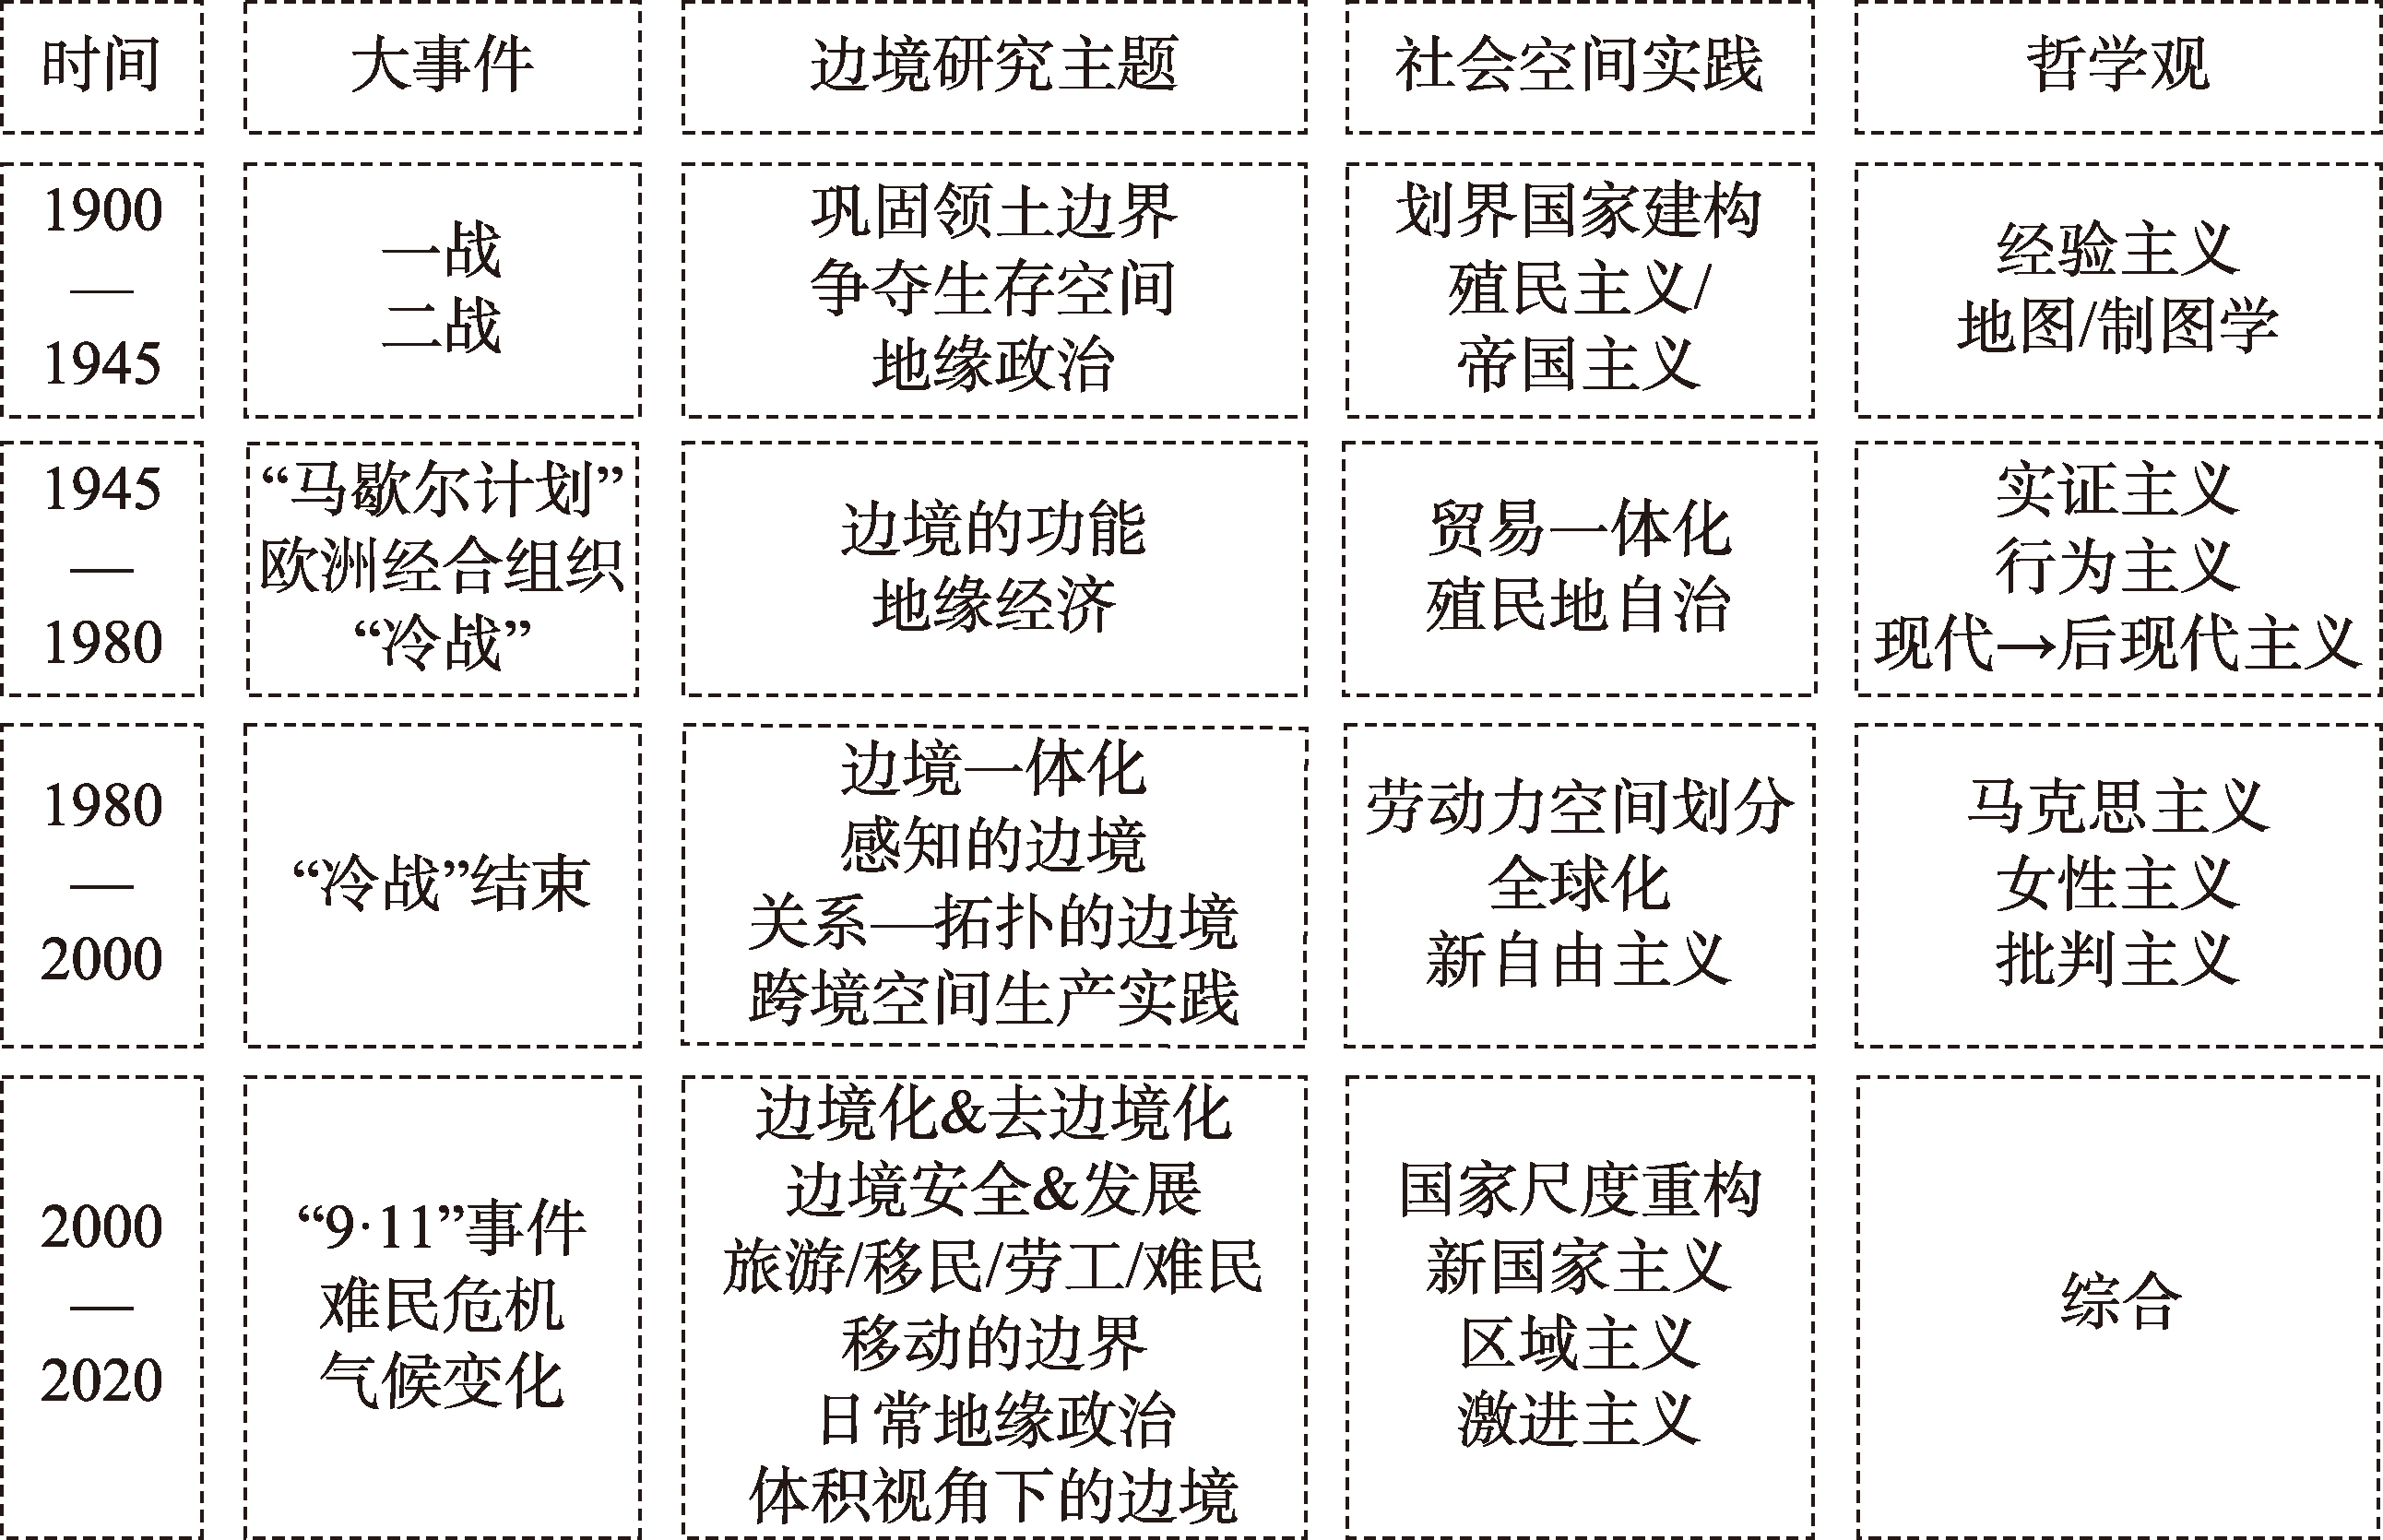
The "volumetric turn" represents a novel theoretical perspective in political geography, surpassing the limitations of traditional two-dimensional spatial cognition. This paradigm reconceptualizes borders as dynamic, three- or even four-dimensional volumetric spaces, incorporating dimensions of height, depth, thickness, and temporality. It places a central focus on the intricate interactions between power, technology, diverse actors, and the material environment. By deconstructing the cognitive frameworks and discursive structures surrounding volumetric borders, this study moves beyond traditional approaches that are confined to planar demarcations, static control mechanisms, and state-centric paradigms. It systematically develops a cognitive framework for understanding volumetric borders, identifying five essential characteristics: verticality, multidimensional fluidity, spatio-temporal elasticity, calculability, and material agency. The paper further explores border governance theories and practices within five key geographical domains—airspace, maritime zones, land territories, subterranean spaces, and extraterritorial zones—through a volumetric lens. With China's complex and evolving geopolitical landscape as the backdrop, volumetric border studies not only offer an innovative theoretical framework for analyzing multidimensional cross-border interactions but also provide critical insights for the advancement of modern border governance systems, especially in regions such as the South China Sea, the Tibetan Plateau, and Belt and Road partner countries.
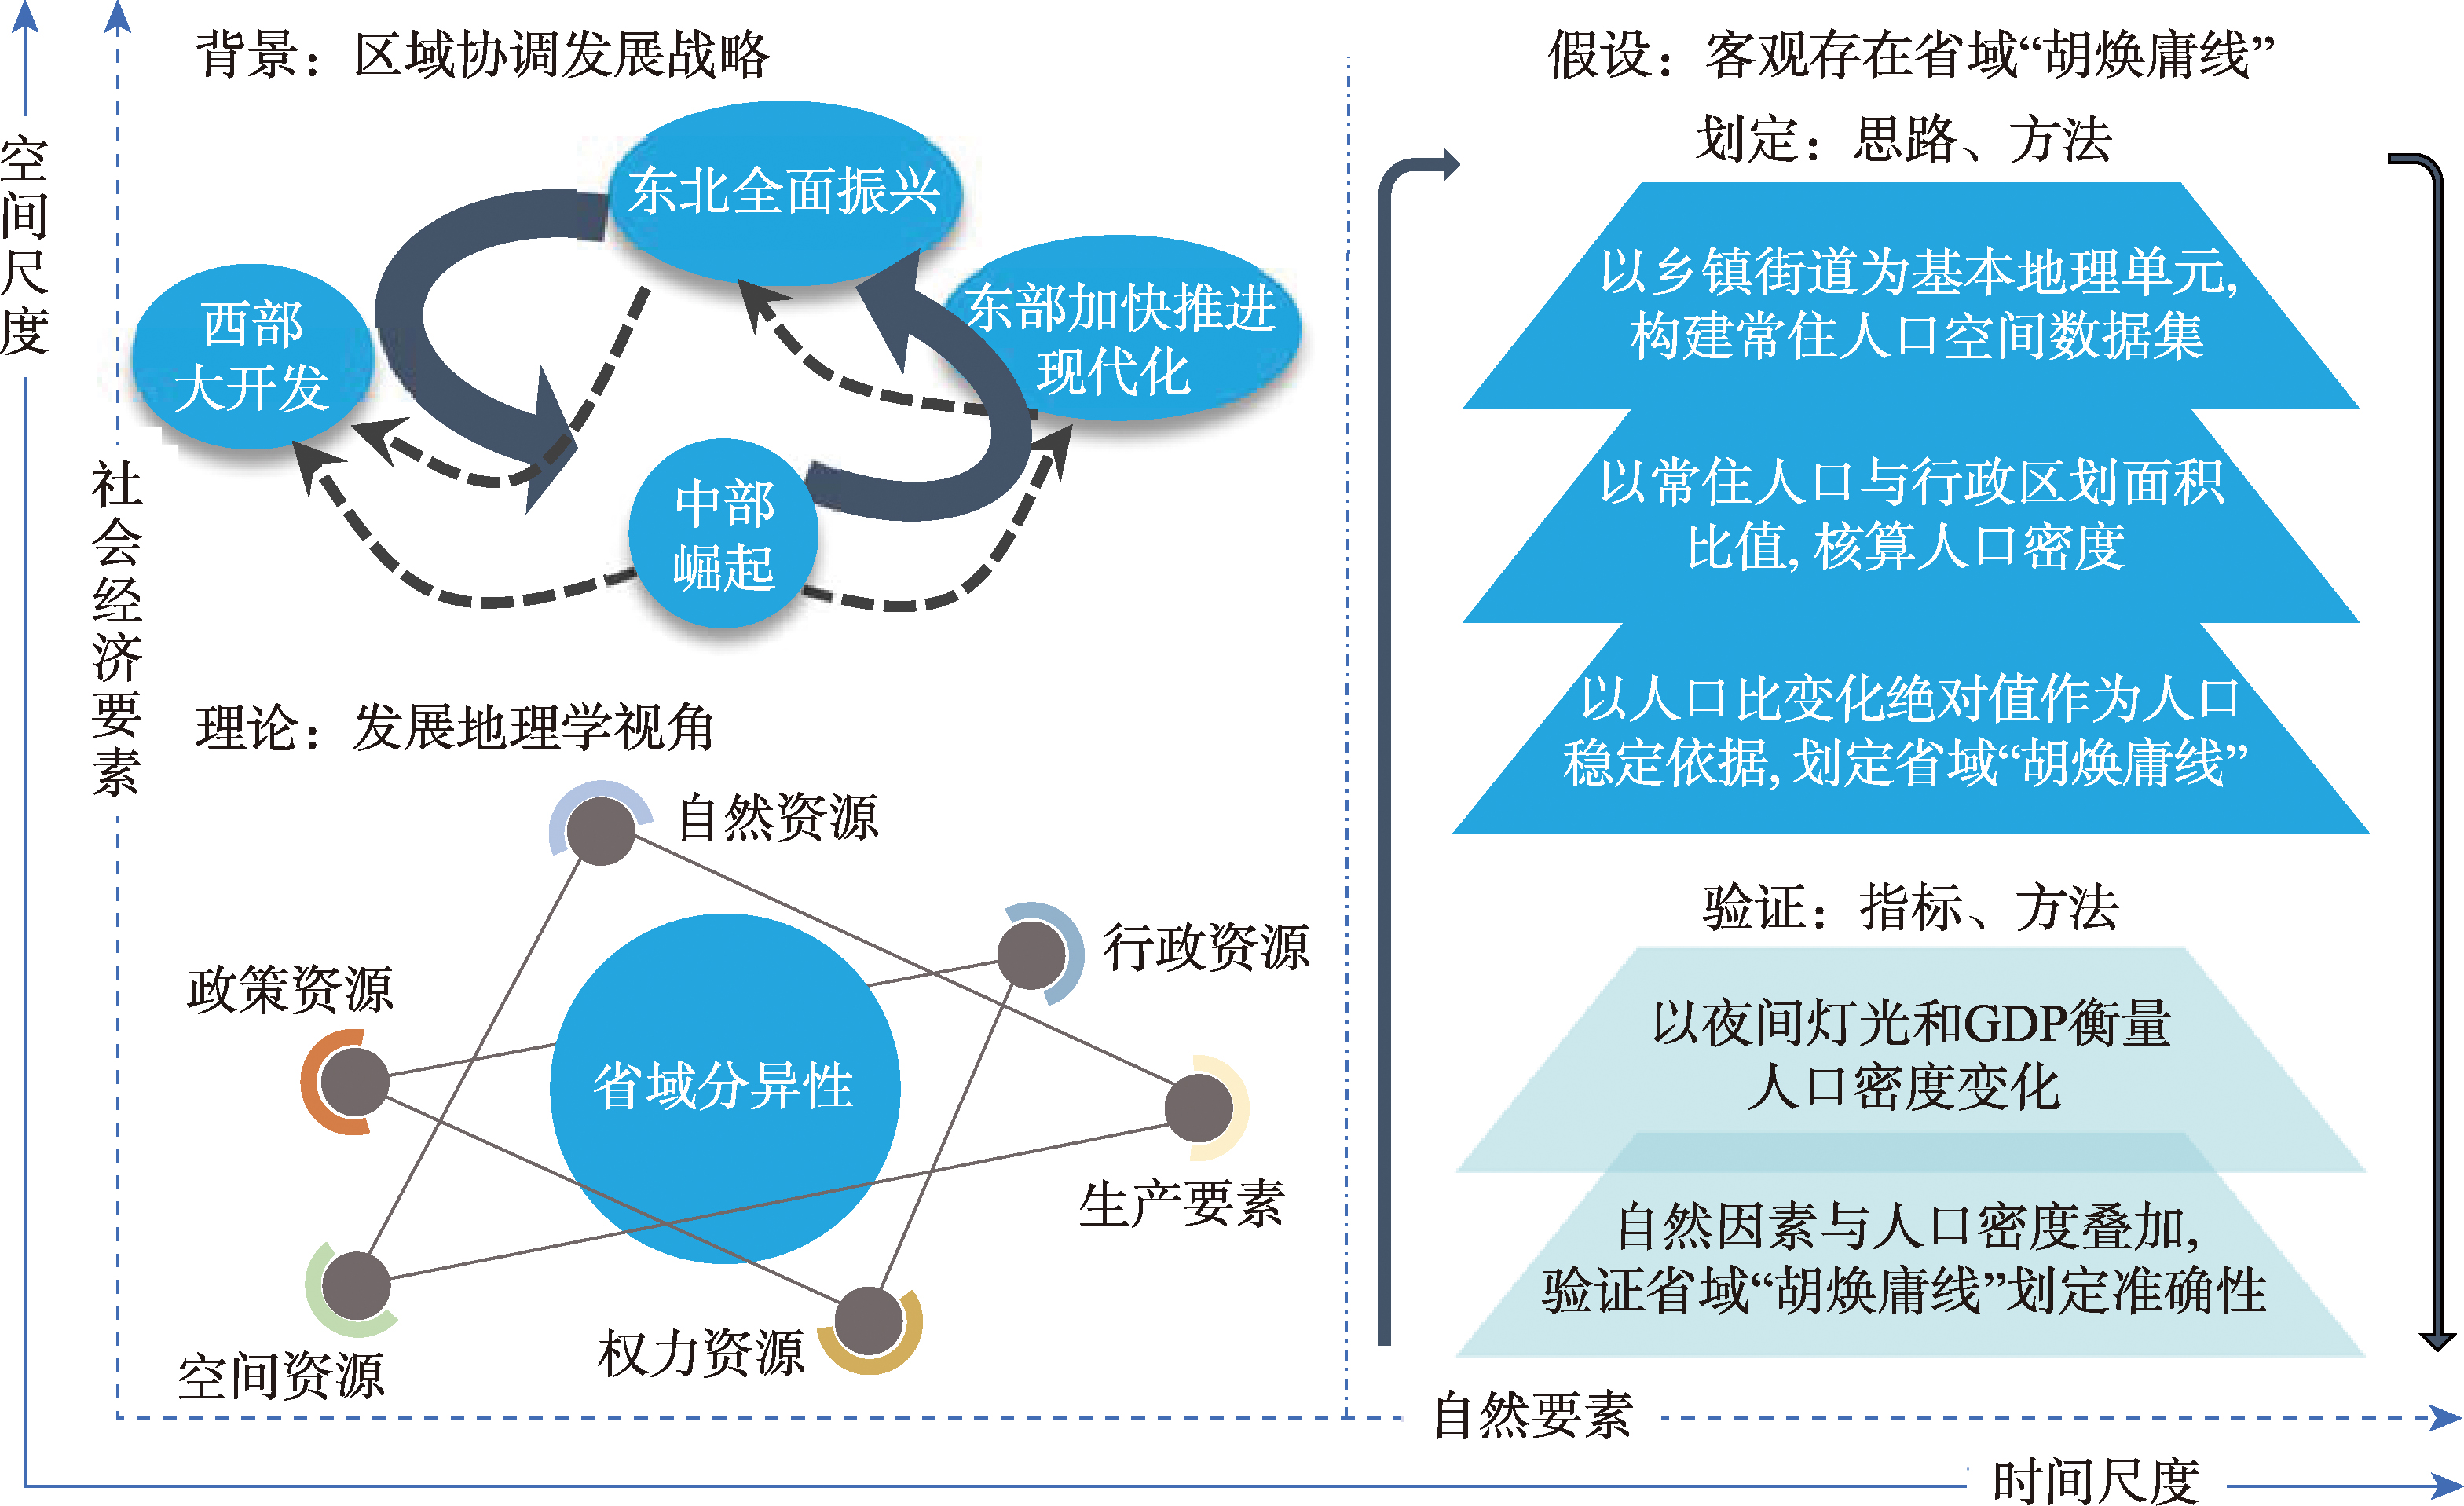
The Hu Line is a comprehensive geographical boundary that reflects regional development disparities. From the perspective of development geography, this study proposes a provincial-scale Hu Line hypothesis. Selecting Ningxia (western China), Heilongjiang (northeastern China), Hubei (central China), and Beijing (northern China) as case studies, we constructed spatial datasets of resident population from 2000 to 2020. By calculating cumulative population percentage and cumulative area percentage, we delineated provincial Hu Lines using the absolute value of population ratio changes. The existence and applicability of these provincial Hu Lines were further validated using nighttime light data, regional gross domestic product (measuring population density variations), elevation, river network density, and NDVI. The results show that: (1) The Hu Line in Ningxia, Heilongjiang, and Hubei exhibits a linear configuration, whereas in Beijing, it forms a distinct "O"-shaped pattern. The absolute difference in population meets specific threshold criteria, and the verification results demonstrate consistency with both socioeconomic and natural factors. (2) Provincial Hu Lines reflect scale-dependent patterns of regional disparities, providing new evidence for implementing regional coordinated development strategies.
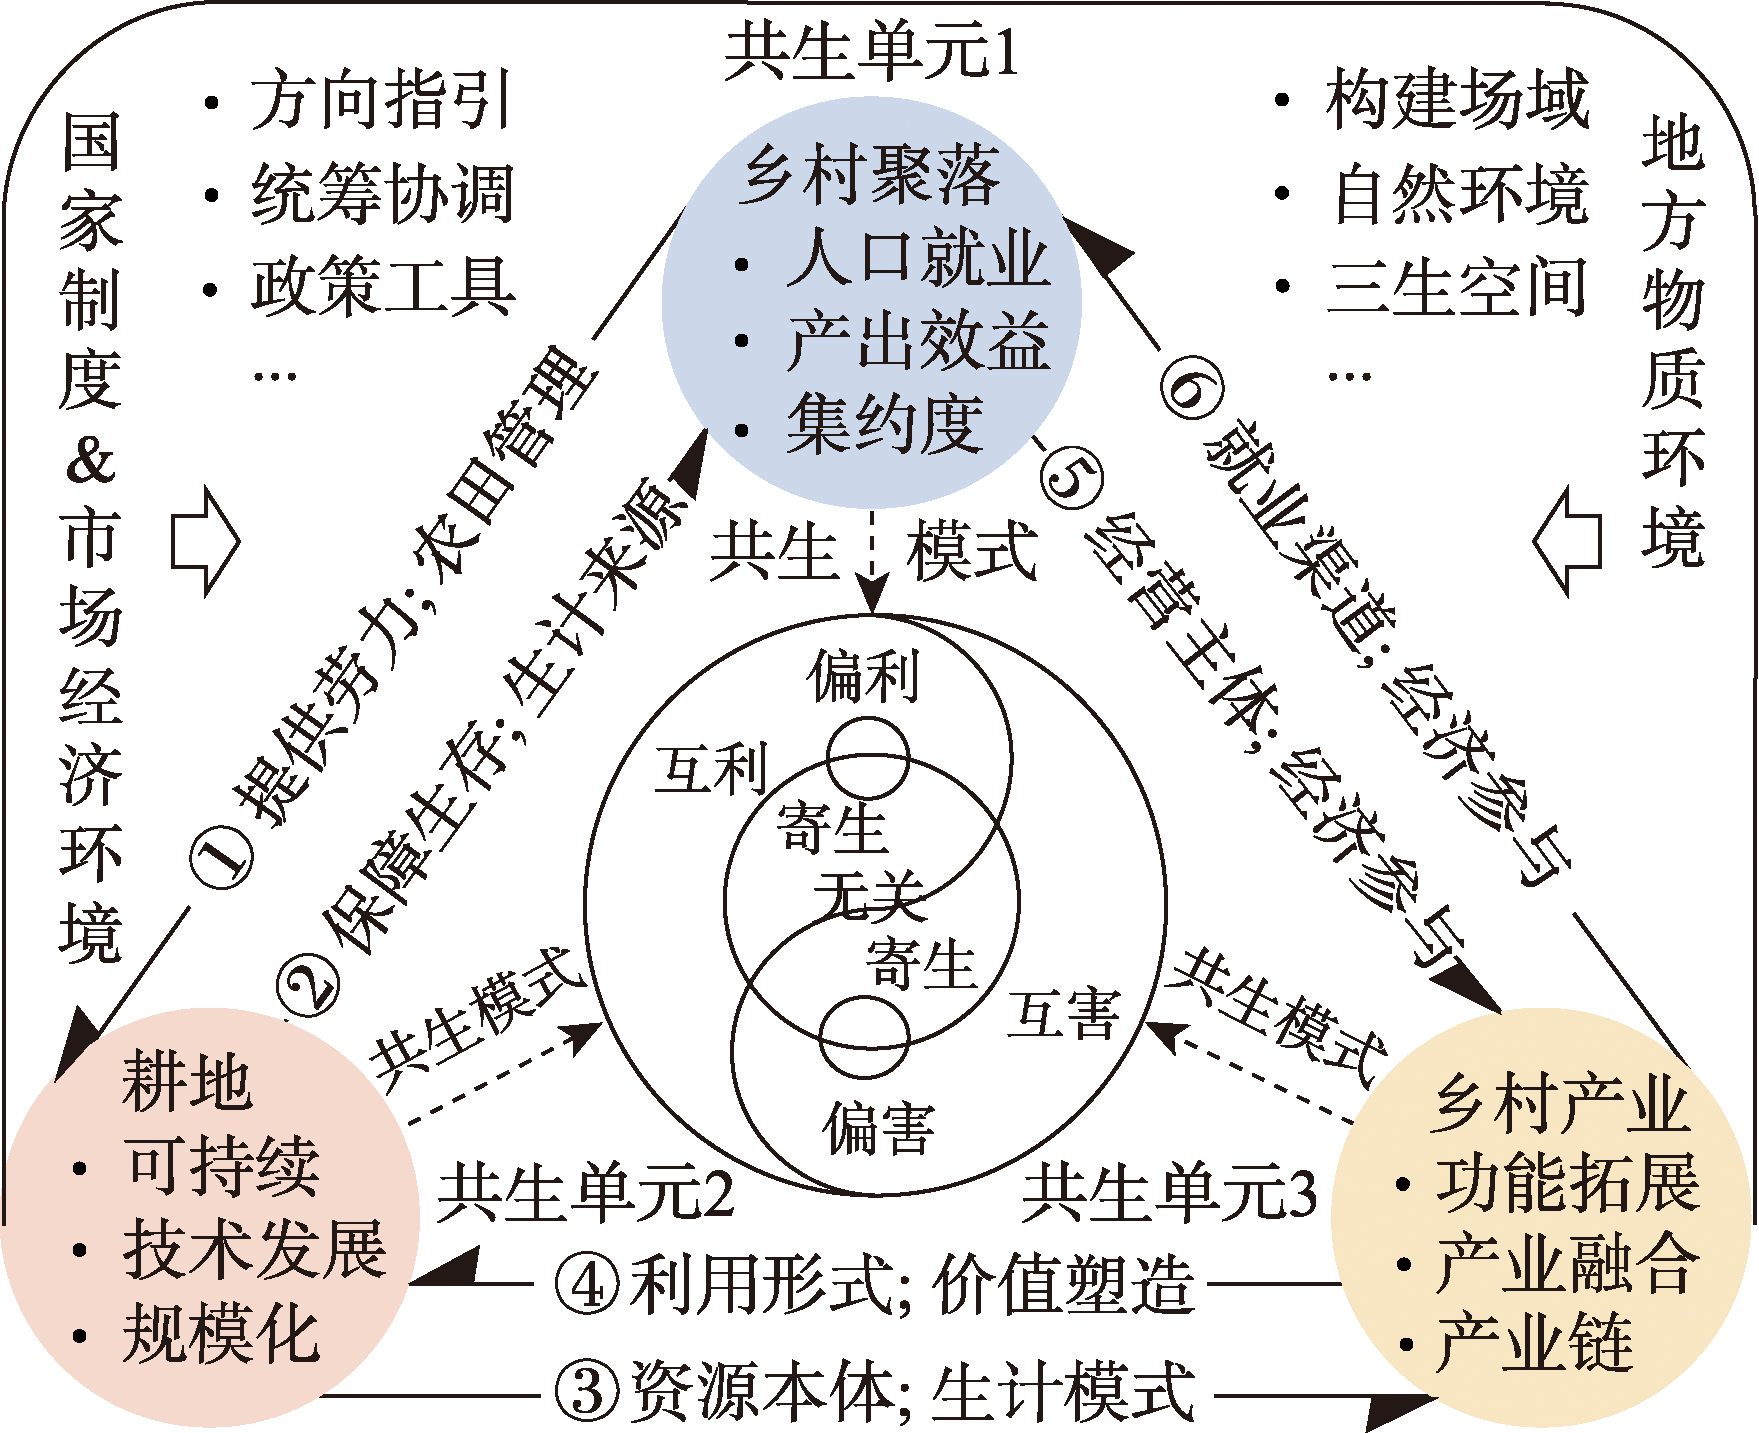
Within the context of comprehensive rural revitalization, mutualistic symbiosis among rural settlement, cropland, and industrial subsystems represents a critical mechanism for addressing multifaceted challenges in rural development. This paper introduces the symbiosis theory to construct the tripartite symbiosis framework, model and evaluation index system of "rural settlement-cropland-industry". This paper analyzes the spatio-temporal evolution of the "rural settlement-cropland-industry" tripartite symbiosis system in China and its nine major agricultural regions from 2000 to 2020, and summarizes its evolution rules, and mutualistic symbiosis mechanism. The study found that: (1) During the 21-year period, the symbiosis units indices of China's rural settlements and industries exhibited a continuous upward trend, while cropland exhibited an initial increase followed by decline. Meanwhile, the symbiosis environmental capacity of all three elements showed a continuous downward trend. (2) In 2000, the symbiosis pattern of "rural settlement-cropland-industry" in rural China was dominated by mutual harm symbiosis and settlement parasitism, which showed a differentiation trend. By 2020, mutual harm symbiosis and cropland & industry partial harm patterns had become common issues in the nine agricultural regions. In terms of region-specific issues, the Northeast China Plain, Northwestern China arid and semiarid regions, the Sichuan Basin and its surrounding regions are dominated by the cropland parasitism pattern. The Huang-Huai-Hai Plain, Qinghai-Tibet Plateau, Yunnan-Guizhou Plateau, and Southern China are dominated by settlement parasitism. The Loess Plateau and the Middle-lower Yangtze Plain are dominated by industrial parasitism. (3) Transformation of symbiosis relationships drives transitions in tripartite symbiosis patterns. However, evolutionary pathways do not invariably advance toward mutualistic symbiosis, with regressive shifts prevalently observed. Advancing mutualistic symbiosis within the "rural settlement-cropland-industry" tripartite system holds practical significance for comprehensive rural revitalization.
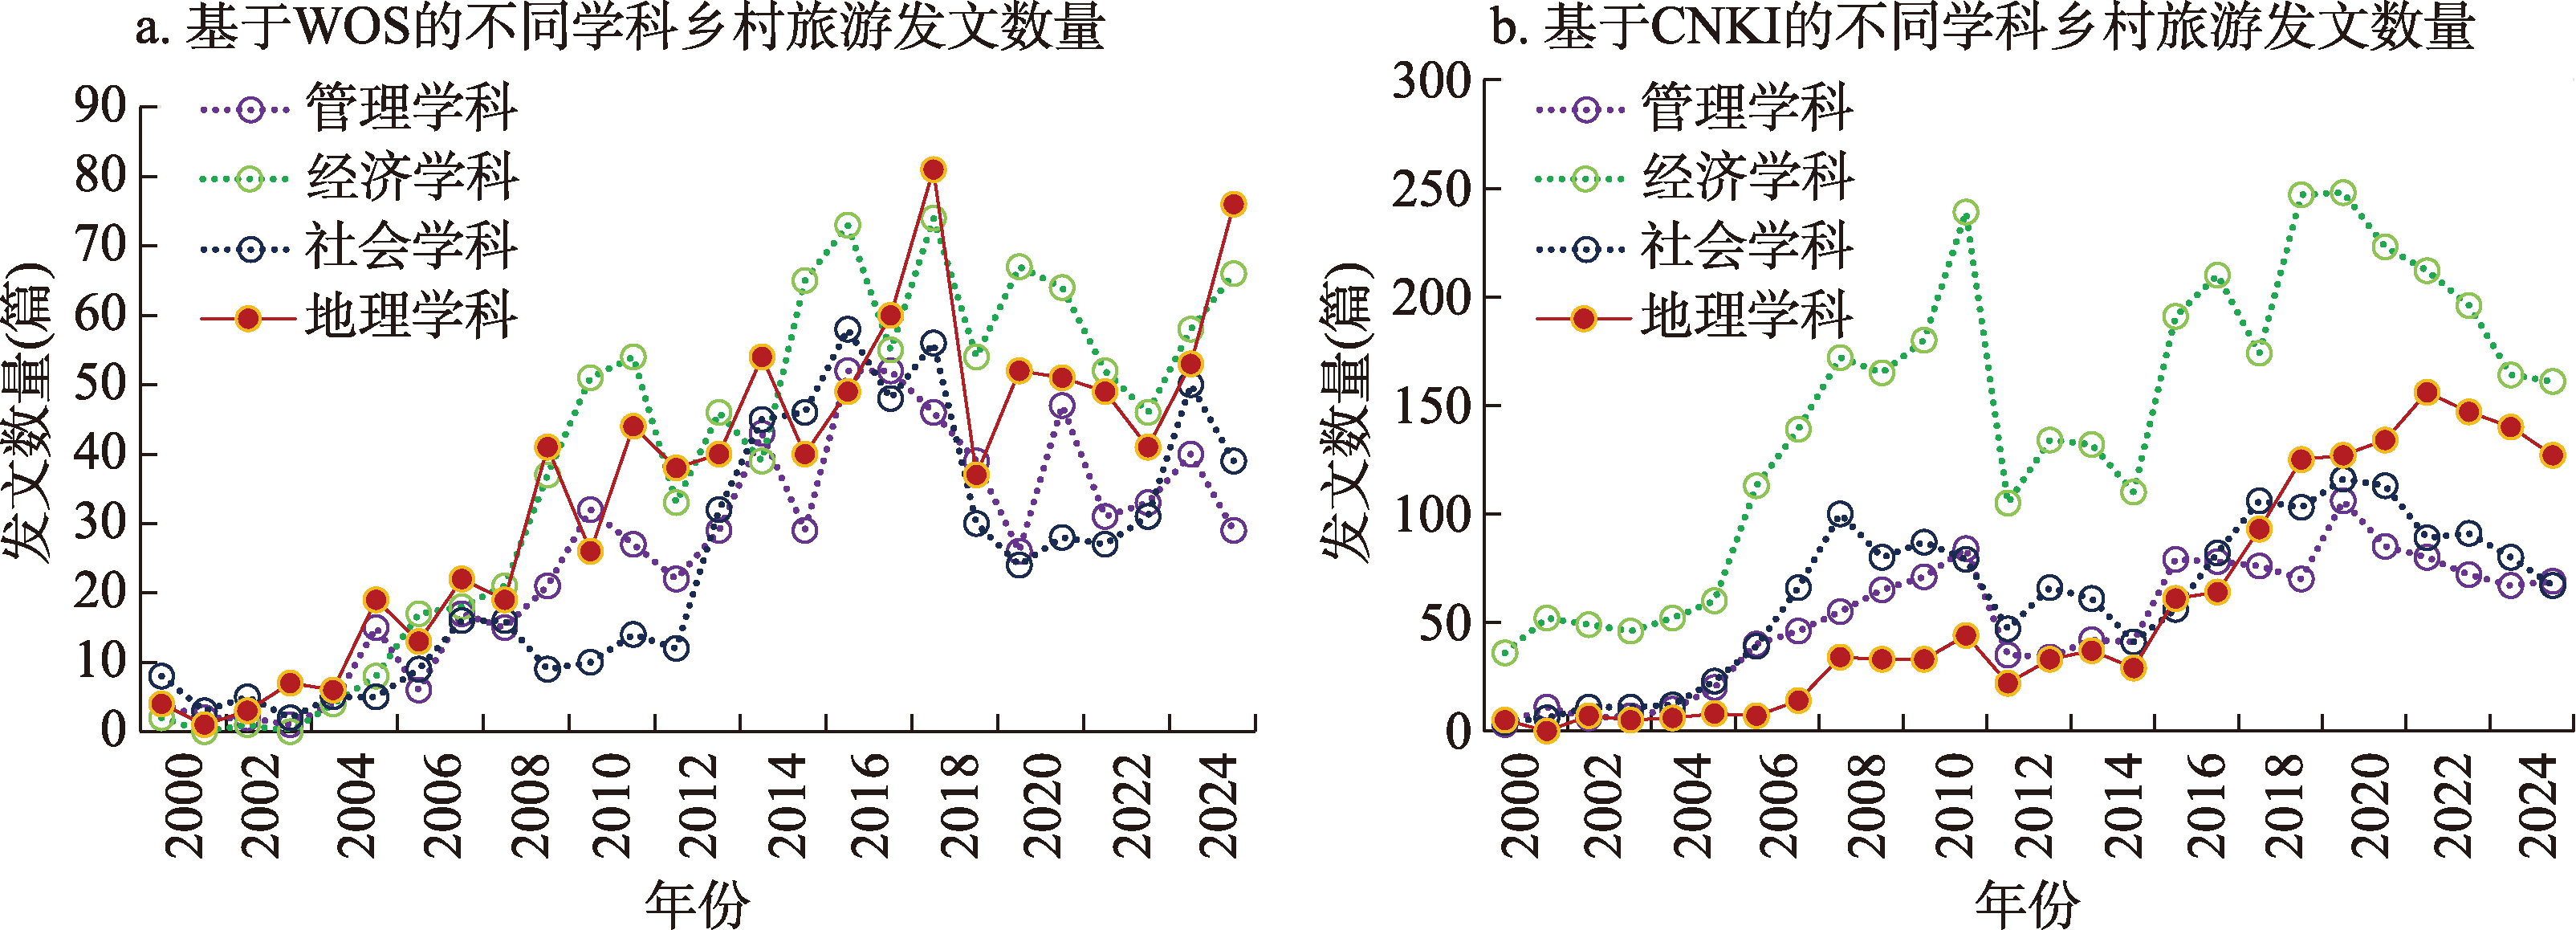
The comprehensive nature of rural tourism and the diversity of rural areas have generated increasingly diversified patterns of supply and demand, leading to marked differences across disciplines in their points of departure, research priorities, and policy recommendations concerning rural tourism development. Using bibliometric and comparative analysis methods, this study examines multidisciplinary understandings of rural tourism development and related geographical research agendas through an analytical framework of "differences in disciplinary focus → comparison of development logics → prospects for integrated research". The findings are as follows. First, in the English-language literature indexed in the Web of Science database, publication trends in rural tourism research are broadly similar across management, economics, sociology, and geography, indicating relatively balanced multidimensional attention to rural tourism development. In contrast, the Chinese-language literature indexed in CNKI shows that studies from an economic perspective account for the largest share, geography-related research has grown rapidly, and studies from the perspectives of management and sociology remain relatively limited. Second, research on rural tourism development in these four disciplines involves four core dimensions: tourism products, tourism stakeholders, tourism space, and development goals. However, the underlying logics of rural tourism development differ substantially across disciplines. Geography, with its emphasis on comprehensiveness and regional differentiation, can draw on multidisciplinary perspectives such as organizational management, product supply and demand, and socio-cultural impacts to construct a development framework that couples competitiveness with satisfaction, economic attributes with economic benefits, equity with inclusiveness, and differentiation with agglomeration. Third, geographical research on rural tourism should be further deepened in relation to product innovation, stakeholder coordination, spatial organization, response strategies, and theoretical development. While giving full play to the distinctive strengths of geography, future research should strengthen interdisciplinary exchange, integration, and innovation, thereby better empowering the high-quality development of rural tourism.
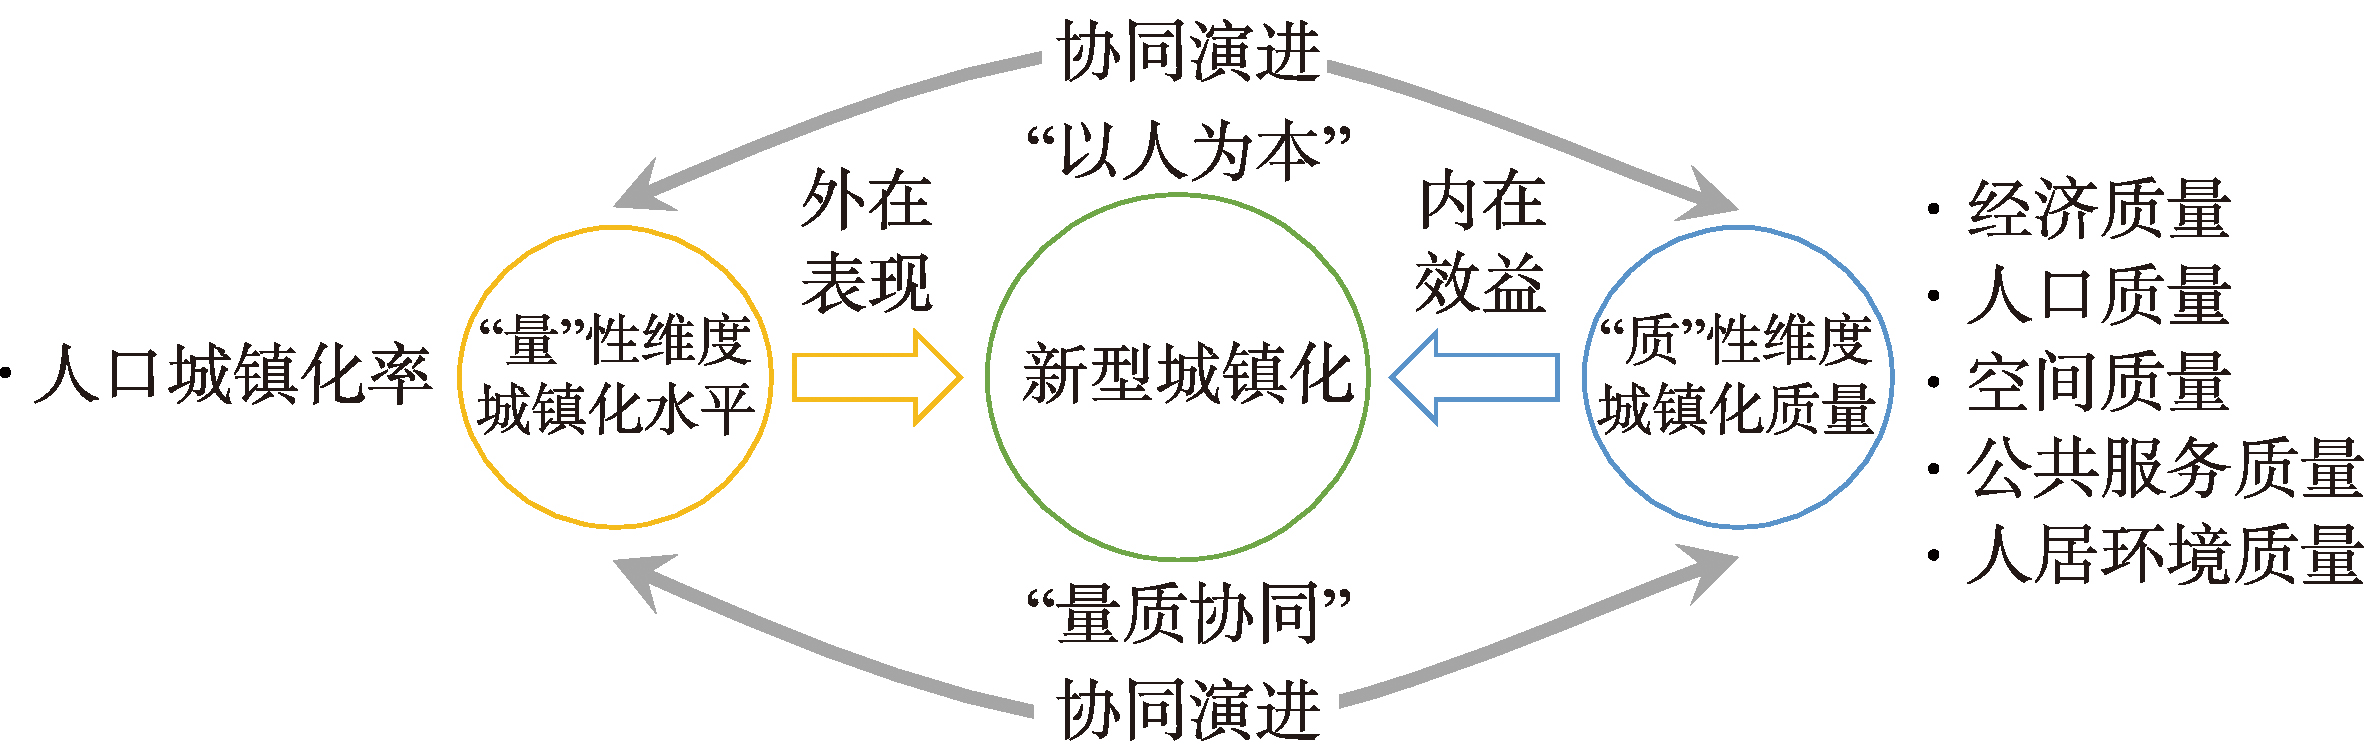
The people-oriented new-type urbanization emphasizes the synergistic improvement of level and quality. This study, based on a quantity-quality synergy perspective, constructs a unified theoretical framework integrating these two dimensions. Focusing on the Yangtze River Economic Belt (YREB) from 2000 to 2022, this study comprehensively examined its new-type urbanization using methods including the entropy method, kernel density estimation, and a synergy evolution model, with driving mechanisms revealed by a Geodetector. The results indicate: (1) Both the urbanization level and quality in the YREB have continuously increased, with the level rising from 32.54 to 61.64 and quality from 43.47 to 67.93. However, the urbanization level remains below the national average and exhibits significant regional disparities. (2) The spatial pattern reveals a hierarchical gradient characterized by "downstream leading, middle stream in the middle, and upstream lowest". While central cities demonstrate radiating effects, siphoning effects persist in major southwestern cities, and the northern downstream area lag relatively. (3) The synergistic evolution of urbanization level and quality significantly improves, transitioning from a polarized state of "quality lag" and "level imbalance" towards coordinated development. (4) The urbanization development patterns have shifted from crude to optimal and imbalanced types. The downstream region is dominated by the optimal type, while the midstream and upstream areas primarily exhibit the imbalanced, highlighting a significant potential for level improvement. (5) New-type urbanization in the YREB is driven by the synergistic effects of natural endowment, government regulation, and market adjustment, forming a tripartite system where "Innovation+" plays a particularly crucial role. This research provides a scientific basis for promoting new-type urbanization construction and high-quality development.
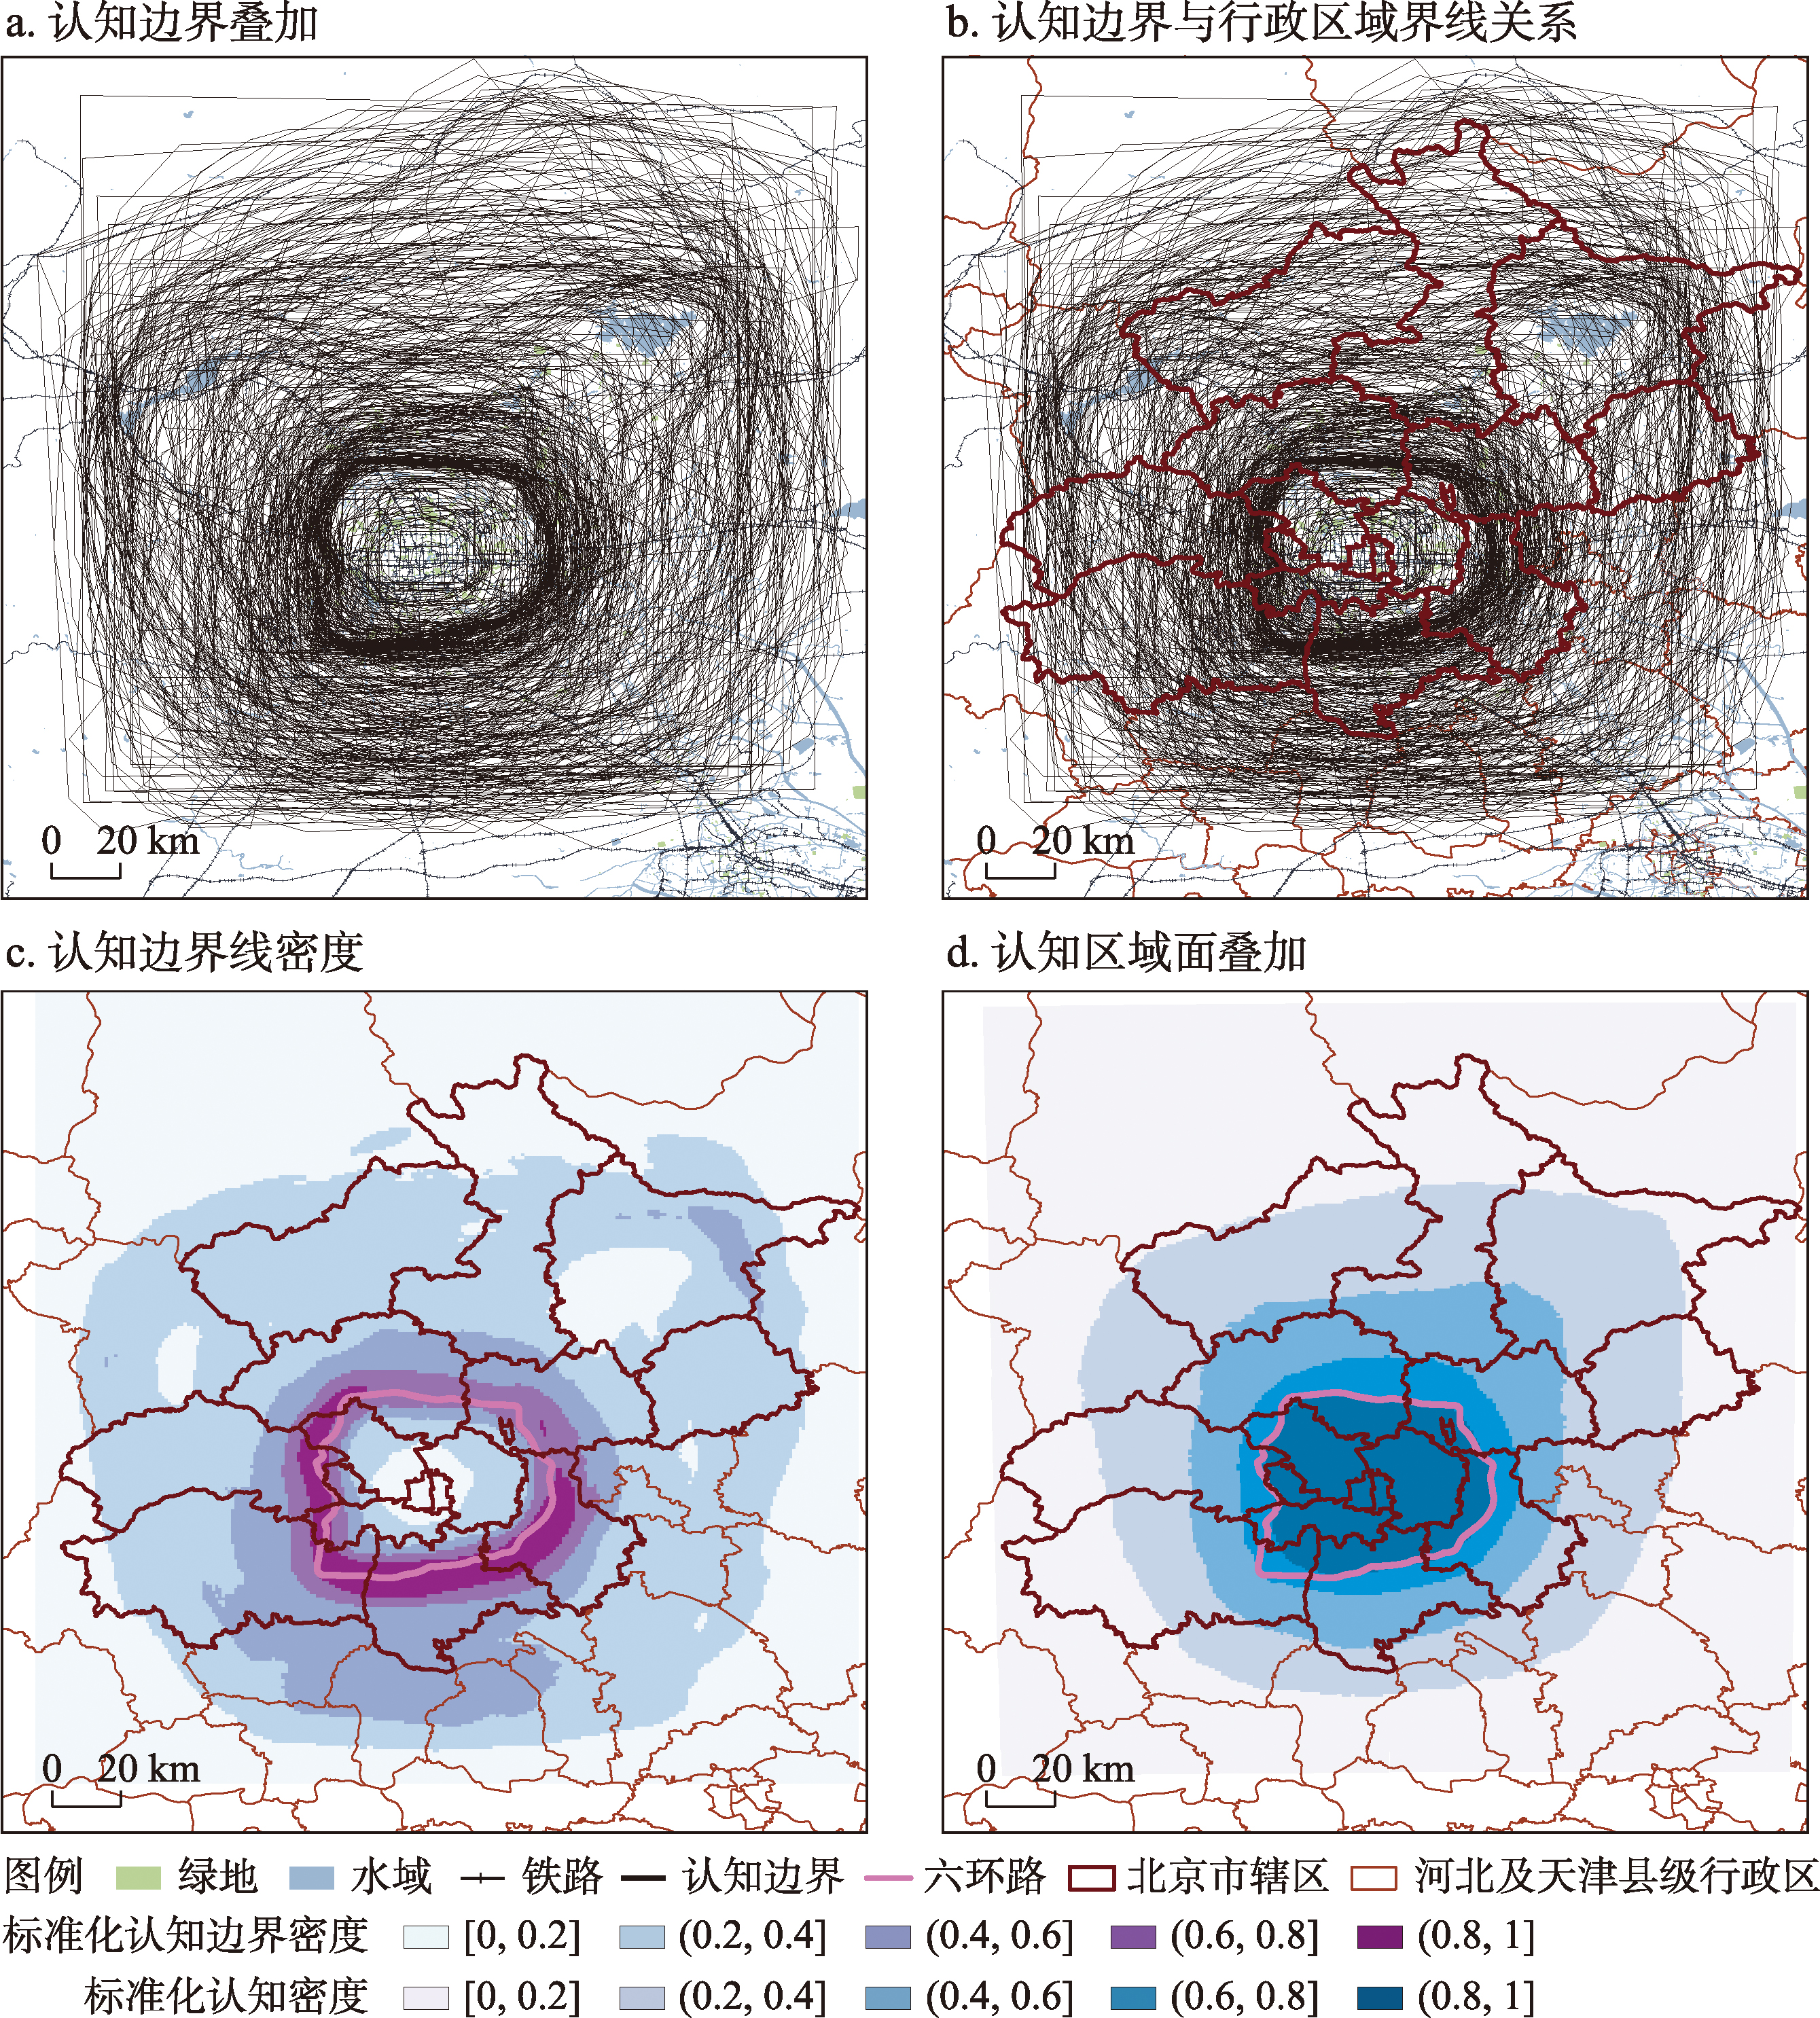
With the advancement of China's new urbanization strategy, urban boundaries-both as instruments of spatial governance and as key research subjects in urban geography-have attracted growing attention from scholars and practitioners. Most previous studies define urban boundaries from top-down perspectives, using administrative divisions, functional zones, or physical areas, while neglecting the perceived boundaries of urban residents formed through everyday life experiences and the spatial information and governance implications embedded within them. Drawing on hand-drawn mental maps collected in Beijing, this study examines how residents perceive the city's spatial extent and compares these perceived boundaries with official administrative ones, using indicators such as boundary density, inclusion proportions, area distortion index (ADI), centroid distortion index (CDI), and Hausdorff distance. Combining this spatial analysis with semi-structured interviews and socio-demographic data, this study further explores how both geographic and individual factors shape the discrepancies between perceived and administrative boundaries. The results show that, first, residents' perceived boundaries differ substantially from administrative boundaries in terms of spatial extent, core area locations, and directional deviation. Second, the perceived boundaries exhibit typical concentric structures, with divergent perceived patterns between central-city and suburban residents. Third, as a social construct rooted in institutional contexts and regional environments, the perceived boundaries reflect spatial disparities in development levels, public resource allocation, and identity recognition. These disparities call for corresponding responses and adjustments in future urban governance practices.
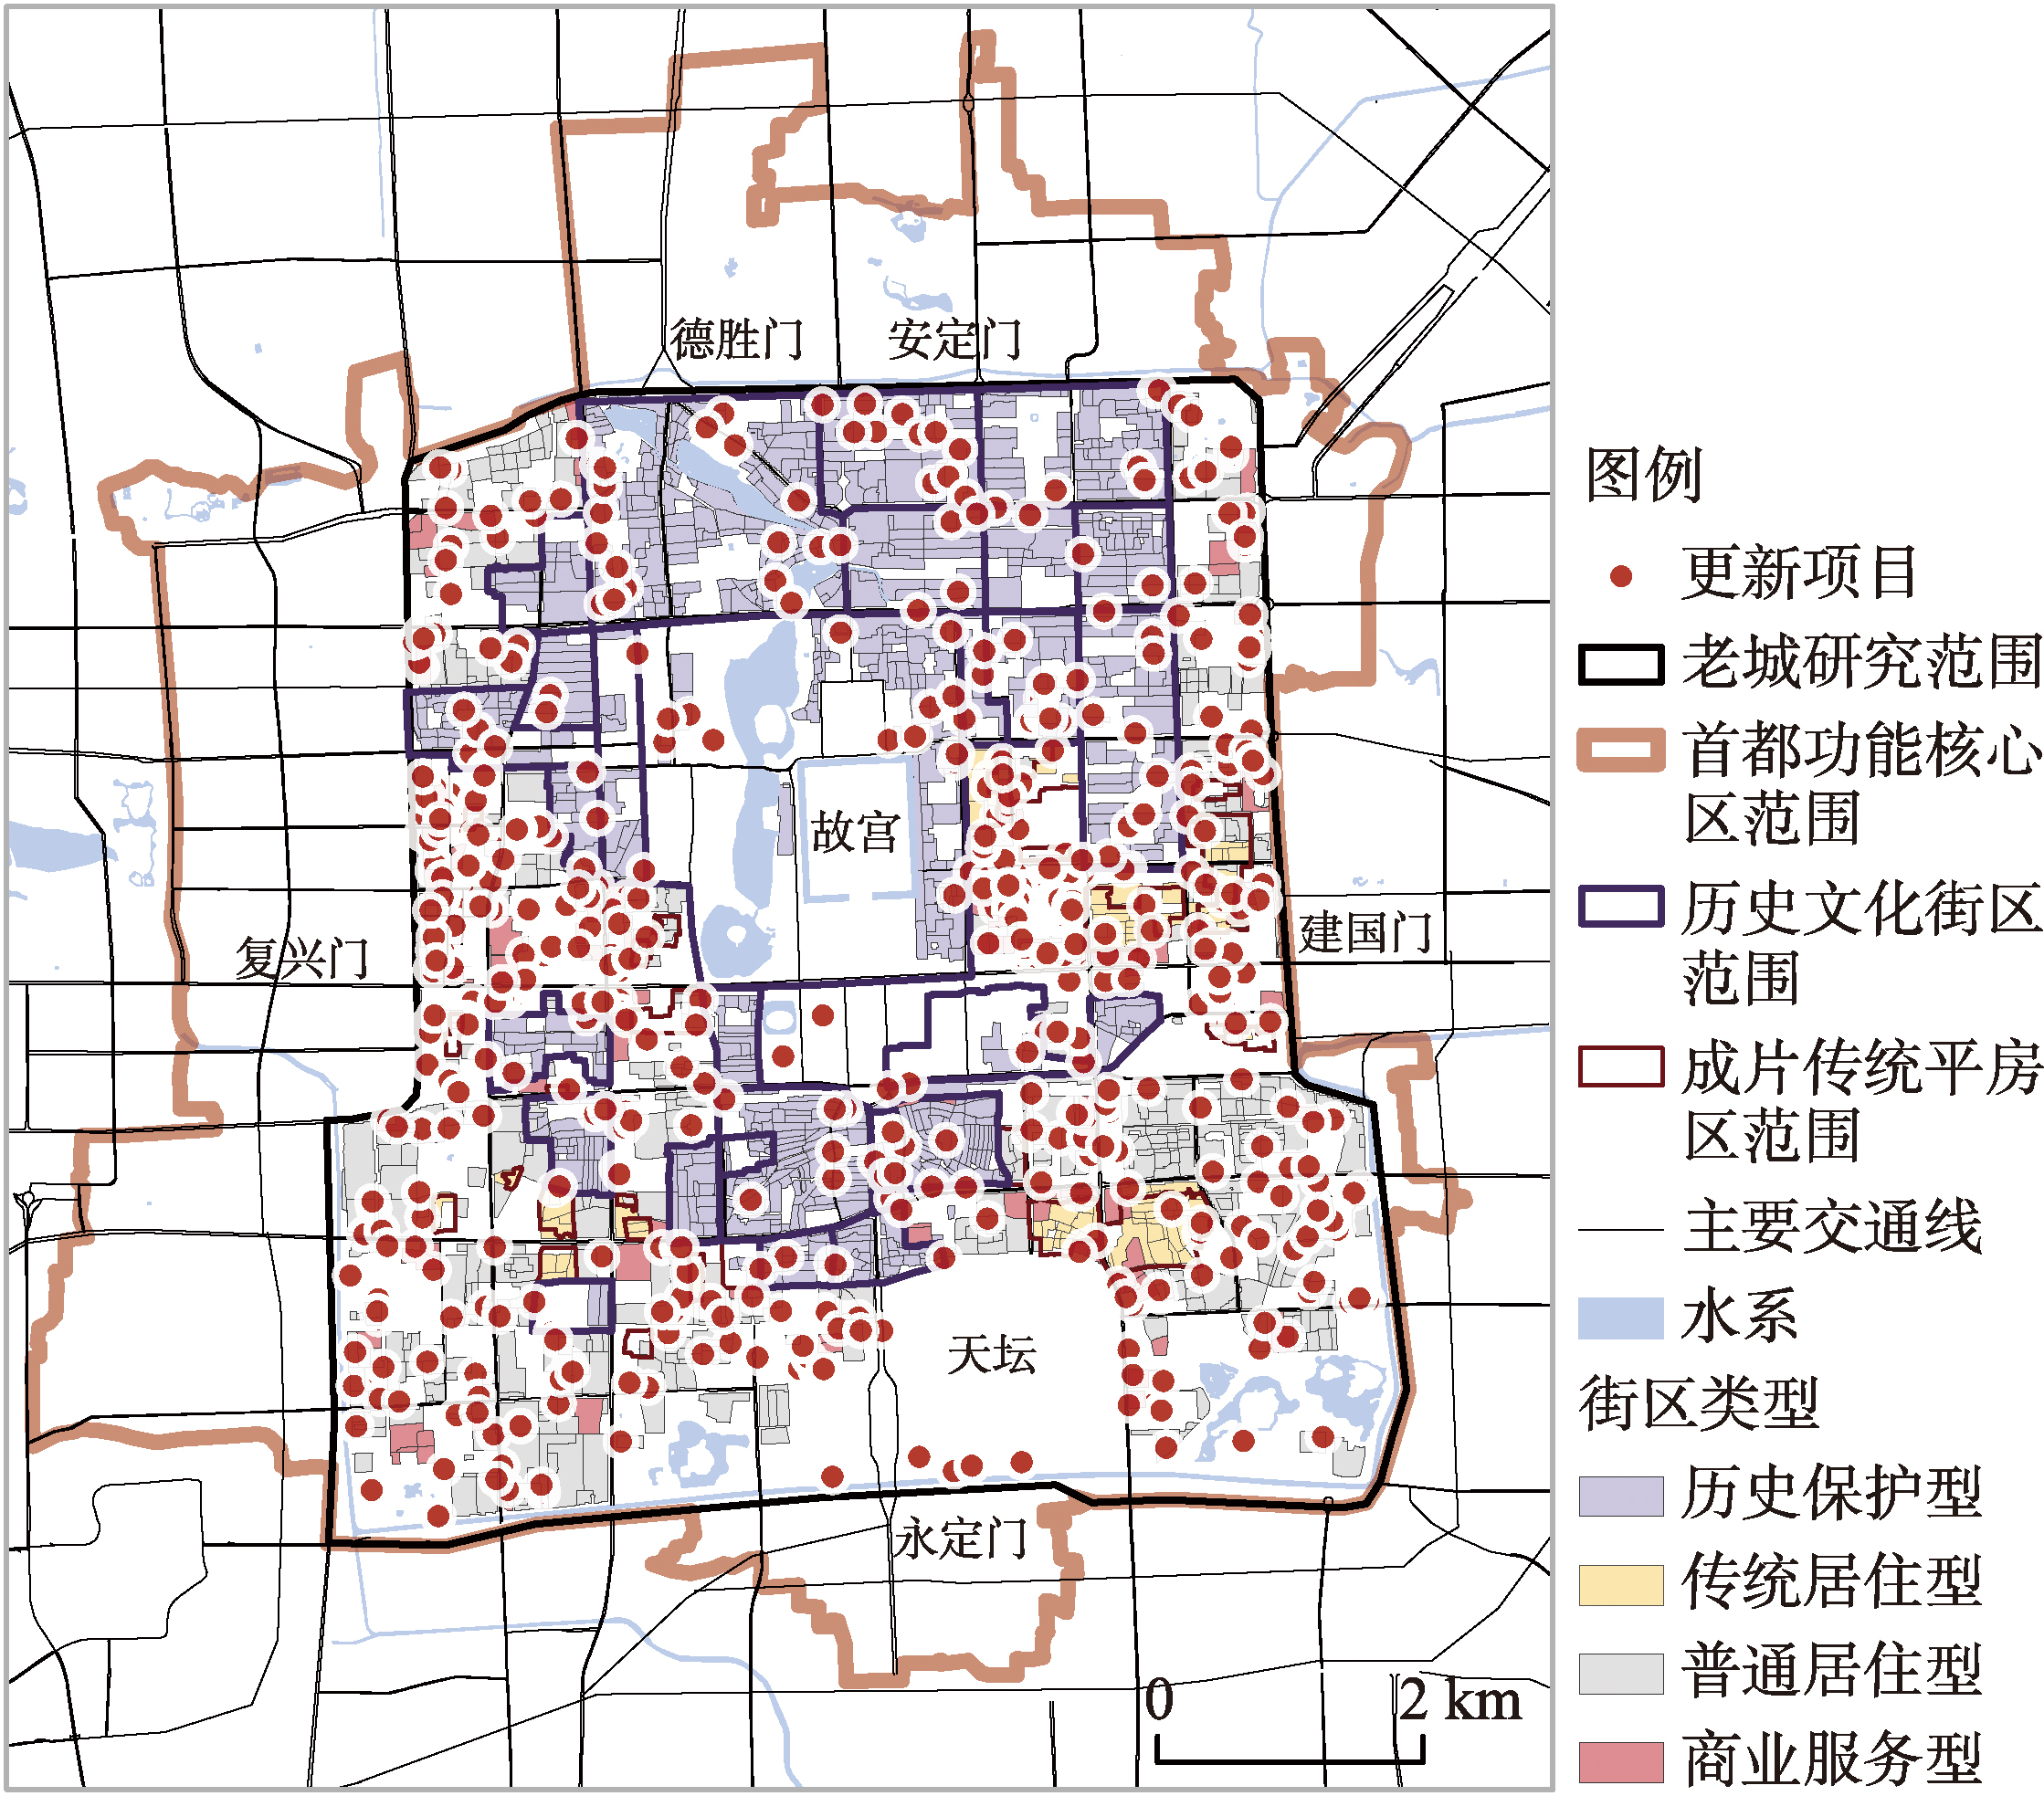
As an important spatial carrier of historical and cultural heritage resources, and an area with dense old blocks and communities, Beijing's old city faces complex issues of efficiency and equity in its regeneration process. The study investigates the relationship between urban regeneration and gentrification within the context of preserving old cities, using a multi-period difference-in-differences (DID) model and bivariate Moran's I index based on Baidu Huiyan population portraits and construction permit data for Beijing's old city from 2019 to 2023, to analyze the causal link and spatial differentiation of this relationship in the old city. The results confirm that: (1) There exists a causal relationship between regeneration projects and gentrification in Beijing's old city, as evidenced by the increased proportion of high-income and high-consumption populations during and after the project implementation. (2) Regeneration projects in historical protection areas show a significant positive correlation with gentrification, indicating that the unique historical resources within the "purple line" continue to attract gentrifying groups, which remains the primary cause of gentrification in the old city; (3) Regeneration projects in Beijing's old city show limited spatial spillover effects. No spillover effect is observed in historical and cultural districts, while "high-high" clustering areas for gentrification emerge in business districts such as Wangfujing and Financial Street near the "purple line." This indicates that the gentrification effect in the old city is influenced by multiple factors such as proximity to historical cultural resources, land value, and the strictness of protection policies, with the greatest concentration of effects occurring in commercial areas near the "purple line." The findings contribute to revealing the relationship between regeneration projects and gentrification in Beijing's old city, expanding the theory of urban regeneration for Chinese modernization, and providing theoretical support for improving the protection and regeneration strategies of Beijing's old city, as well as for the refined management and effect evaluation of urban regeneration.
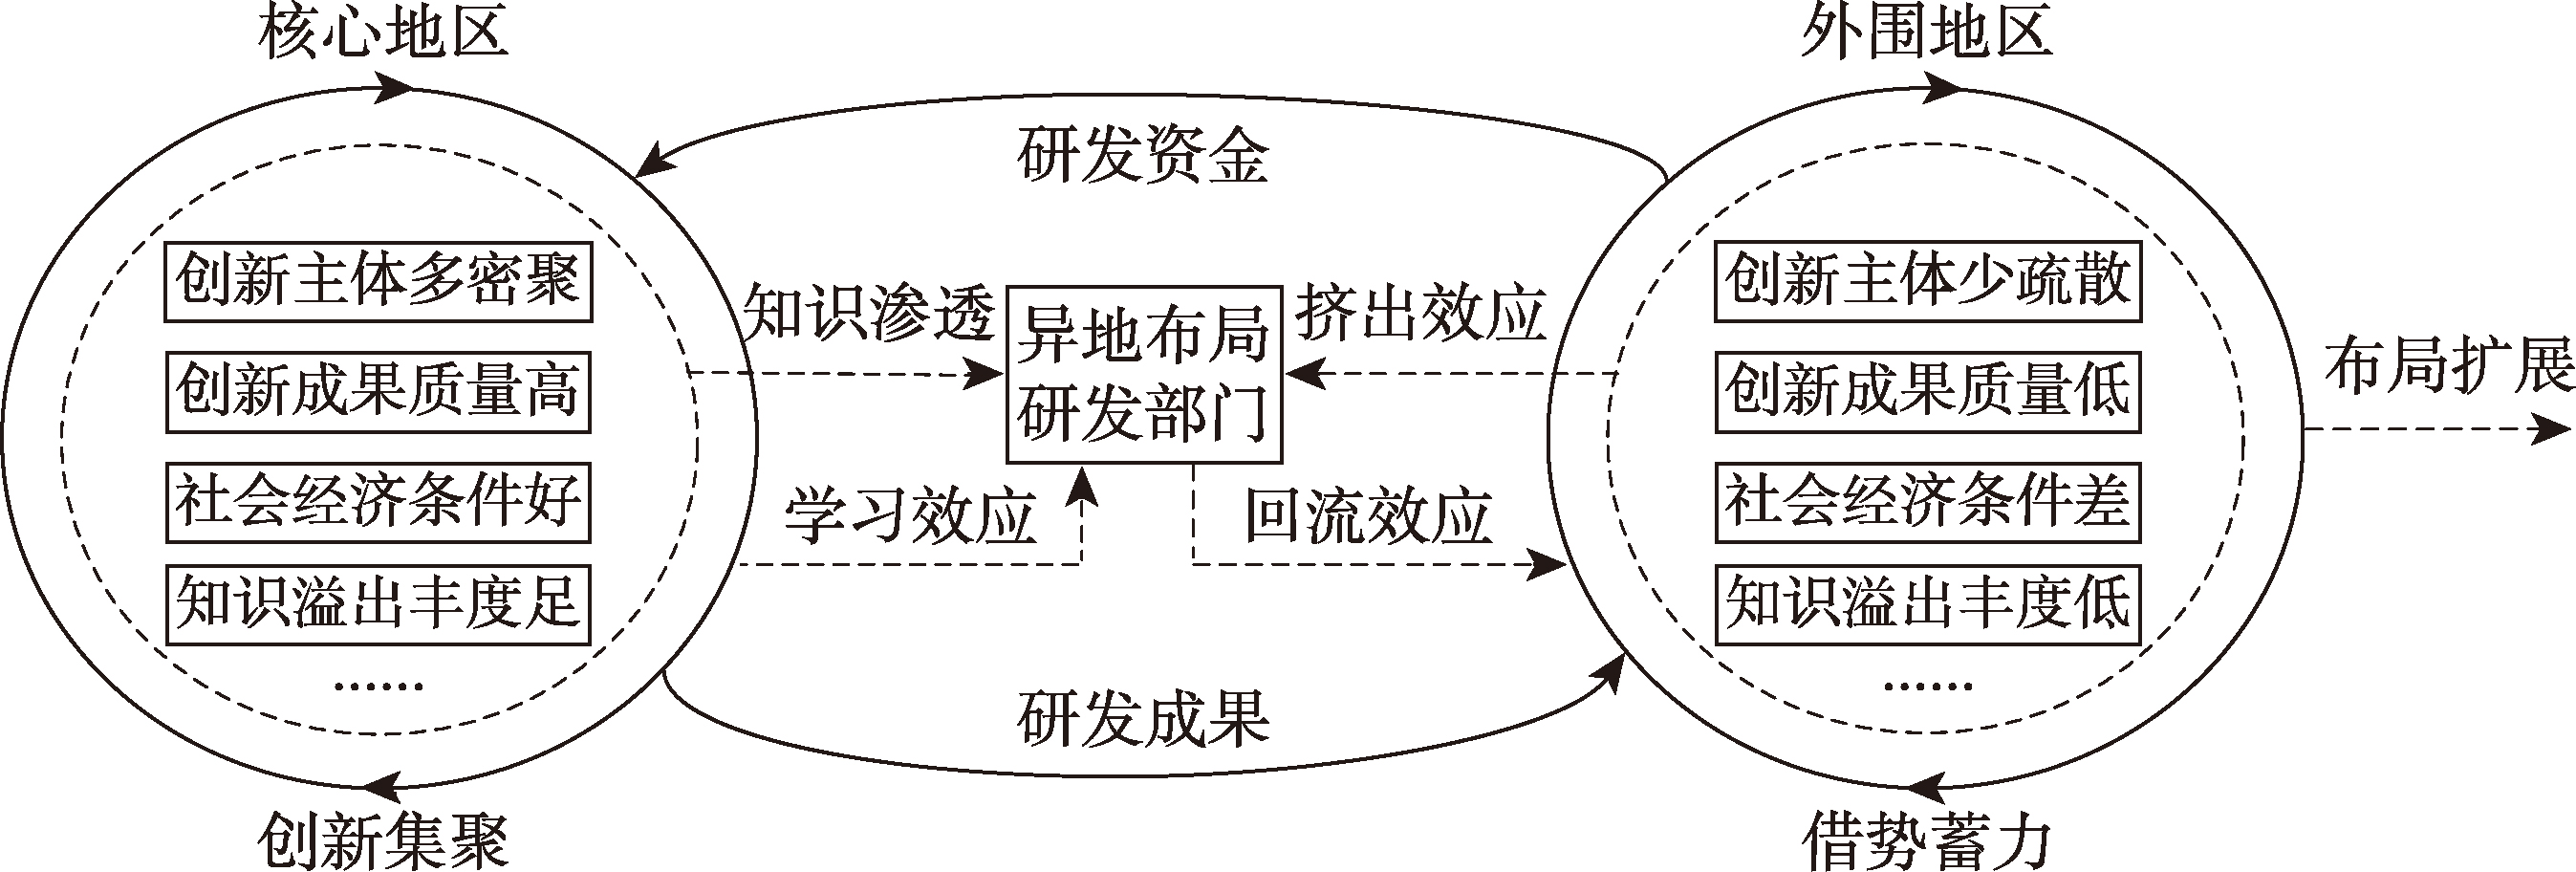
High-tech enterprises in peripheral regions can break free from the "agglomeration shadow" by establishing off-site R&D departments, thereby tapping into the innovation resources of central regions to fuel their development. This serves as an effective strategy for such enterprises to offset their geographical disadvantages. Taking the Beijing-Tianjin-Hebei urban agglomeration as an example, this paper uses the data of high-tech enterprises based in Hebei province and their R&D departments from 2005 to 2022 to analyze the spatio-temporal characteristics and influencing factors of the layout of off-site R&D departments. The research finds that: (1) From a spatial layout perspective, the expansion of off-site R&D departments in the Beijing-Tianjin-Hebei urban agglomeration has undergone a phased evolution from momentum-leveraging exploration, stable reliance, initial leap to accelerated expansion. At the national level, it has gradually changed from the early agglomeration model centered on Beijing and Tianjin to a decentralized and long-distance distribution across the country, forming a distinct gradient distribution pattern. Statistics indicate that about 50% of off-site R&D departments are concentrated in megacities, 24% are situated in provincial capitals, and 6% are located in regions with a higher level of trade freedom. (2) From a network structure perspective, within the urban agglomeration, the layout network of off-site R&D departments has evolved from a Beijing-led "center-periphery" model to a "one primary, one secondary, and one gateway" framework, with Beijing-Tianjin and Shijiazhuang serving as its main axes. At the national level, the layout of off-site R&D departments has formed a butterfly-shaped radiation network, with Beijing-Tianjin as the core nodes. Meanwhile, the Yangtze River Delta and Chengdu-Chongqing region act as the eastern and western wings, and the Pearl River Delta and Hainan as key southern nodes. (3) In terms of industrial characteristics, off-site R&D departments are predominantly concentrated in the technology service industry, with their numbers across sectors declining progressively from the eastern region to the central, western, and northeastern regions. Among them, industries with a relatively high relocation rate of R&D departments mainly include those with rapid technological iteration—such as the computer and communication equipment manufacturing industries, and those oriented toward energy abundance, such as the electricity and thermal power production industries. (4) The layout of off-site R&D departments is significantly affected by the crowding-out and facilitating effects emanating from urban resource elements, agglomeration economy, institutions, and infrastructure.
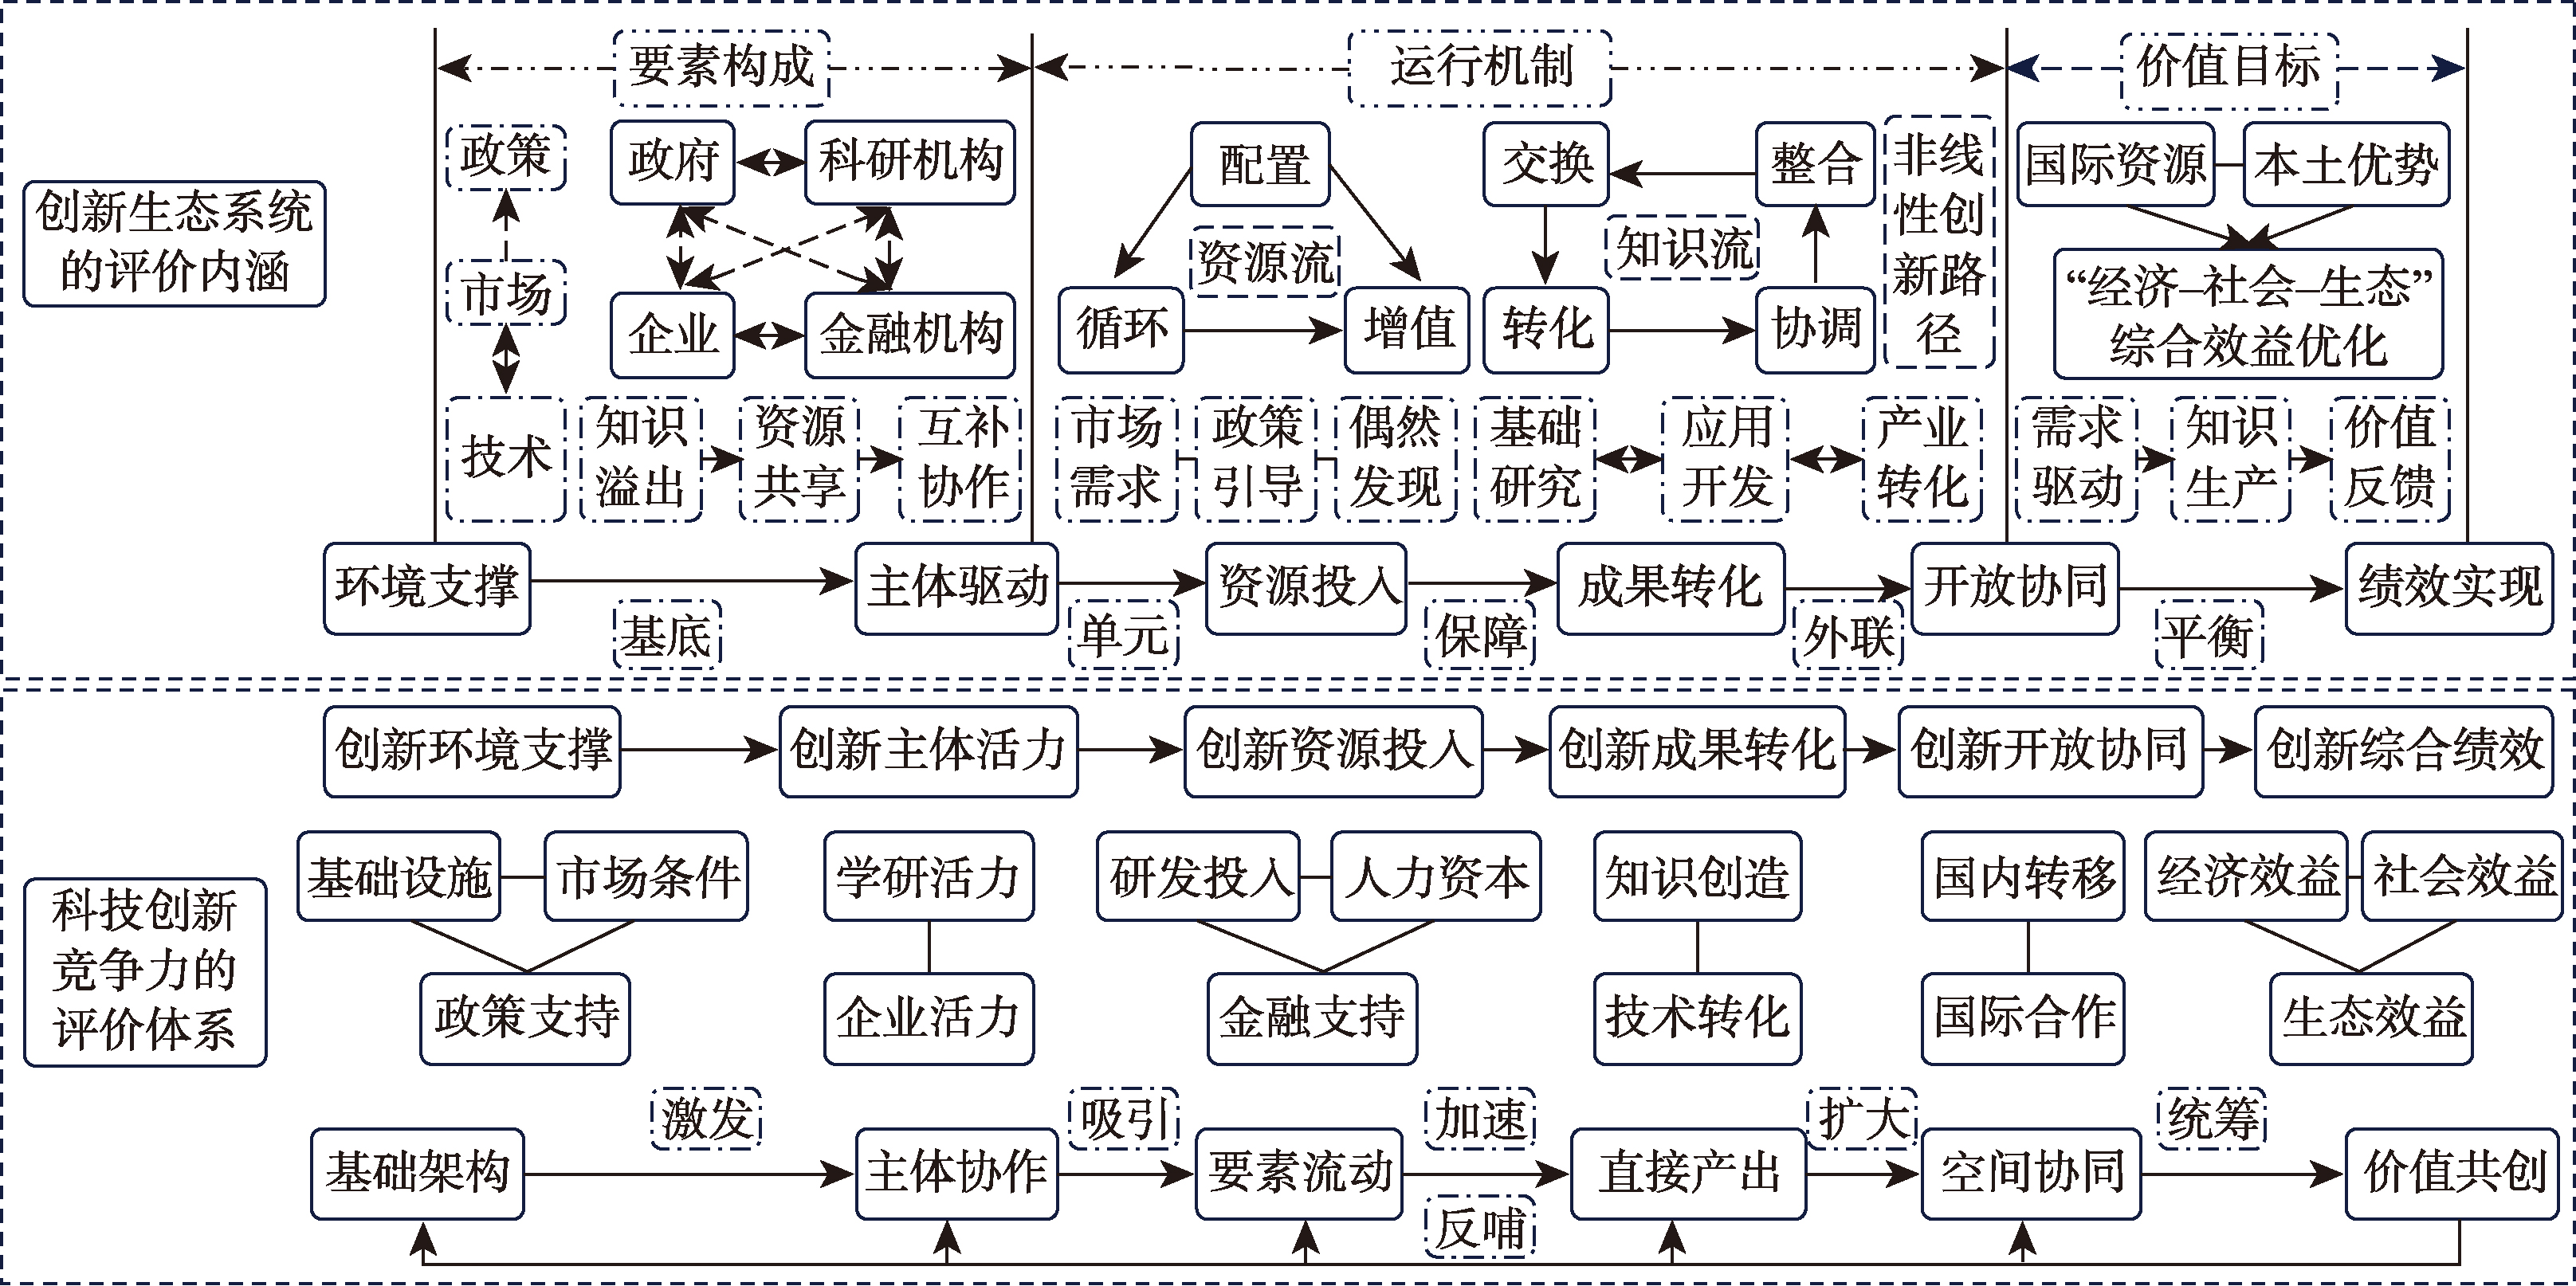
Developing a multidimensional, coordinated evolution model for technological innovation systems is crucial for optimizing the spatial layout of national innovation systems and fostering high-quality regional development. Grounded in innovation ecosystem theory and integrating the practical features of technology-driven regional innovation, this study constructs a comprehensive evaluation system for science and technology innovation competitiveness, encompassing components such as environmental support, agent-driven initiatives, resource input, achievement transformation, open collaboration, and comprehensive performance. Using the vertical-horizontal grading approach, it systematically assesses regional innovation from dimensional orientation and overall performance perspectives. By applying an improved coupling coordination degree and the Panel Vector Error Correction Model, the research clarifies the mechanisms underlying the coordinated evolution and formation mechanism of this phenomenon. Research reveals that science and technology innovation competitiveness demonstrates a multidimensional, differentiated evolutionary pattern. Key dimensions such as environmental support, resource input, achievement transformation, and comprehensive performance exhibit sustained growth, whereas agent-driven initiatives and open collaboration follow an "initial stability-then-decline" trajectory. Since 2013, its growth has decelerated, revealing a dual regional trend of "gradient convergence with localized breakthroughs". Overall, these elements are in moderate coupling and transitional coordination, evolving in a pattern of "eastern leadership with central-western catch-up and northeastern imbalance". In the short term, dimensions mutually promote and constrain each other; long-term dynamic equilibrium is achieved via cumulative causality and reverse error correction mechanisms. By integrating regional-external collaboration, temporal-spatial dimensions, and direct-indirect channels, this study systematically clarifies the formation mechanisms of this multidimensional coordinated evolution, providing a decision-making foundation for optimizing the overall efficiency of the national innovation system.
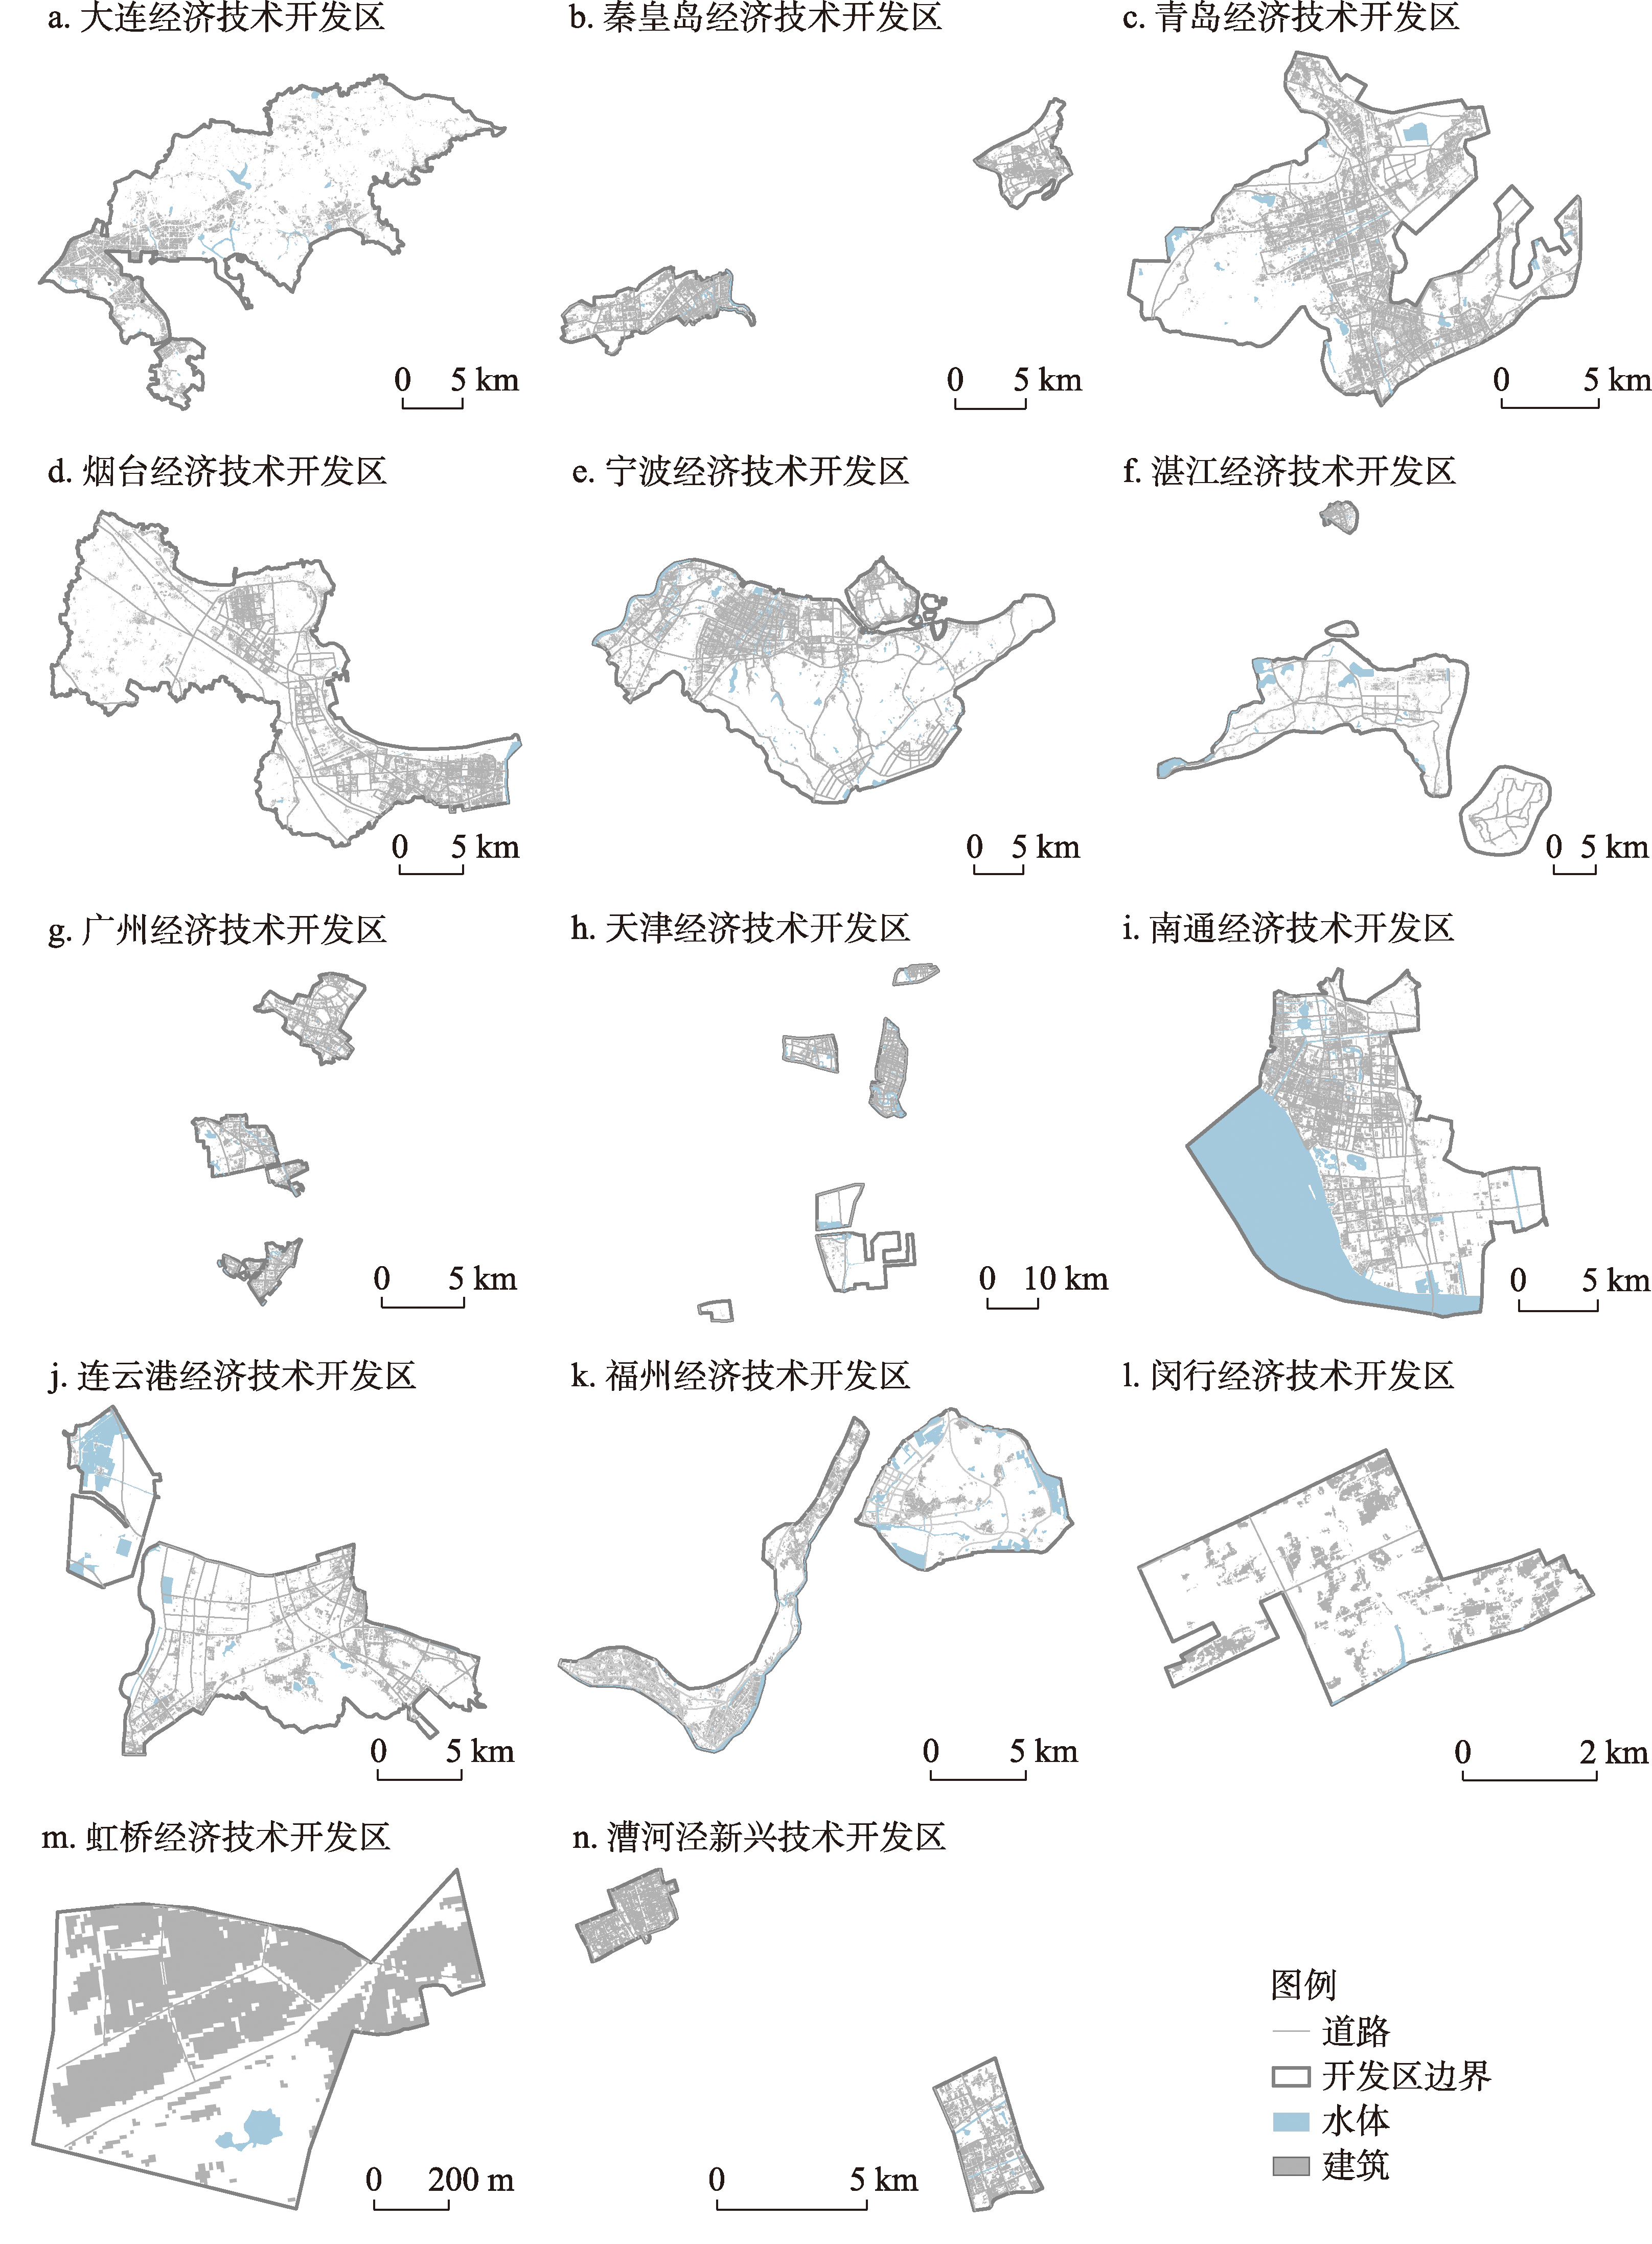
As a crucial vehicle for industrial development, development zones have been tasked with the dual policy mission of developing both local competitive industries and emerging industries through practical exploration, reflecting the characteristics of both path dependence and path creation. Given their higher degrees of industrial concentration, policy focus, and openness to foreign trade, the industrial evolution of development zones may exhibit unique characteristics compared to other regions. Based on this, taking the first batch of national economic and technological development zones (ETDZs) as examples, this paper uses multi-source data such as the 1998-2013 industrial enterprise database, and employs methods including logistic models to examine the typical facts, influencing mechanisms and their heterogeneity effects of industrial evolution in development zones. The results show that: (1) During the study period, a total of 534 new (competitive) industries (hereafter "new industries") emerged across the 14 ETDZs, with the proportions of path-dependent and path-creation new industries fluctuating around 45% and 55%, respectively. This suggests an evolution pattern dominated by path creation and supplemented by path dependency. In quantity, technology-intensive industries are the most numerous (326) and labor-intensive industries are the fewest (96). Regionally, Ningbo, Dalian, Tianjin, and Guangzhou ETDZs generated the most new industries, and the same ETDZ could experience different industrial evolution paths at different periods. (2) Leading industry policies contribute to path dependence of industrial evolution in development zones, while foreign-invested enterprises promote path creation. In terms of heterogeneity, the former significantly promotes the path dependence trend of labor- and technology-intensive industries, while the latter has a positive effect on the path-creation of capital- and technology-intensive industries. (3) Regarding the transmission mechanism, leading industry policies promote path dependence through agglomeration effects, while foreign-invested enterprises promote path-creation through innovation effects. However, such innovation effects have not effectively spilled over to domestic enterprises in the same industry. This paper contributes special-scale empirical evidence to evolutionary economic geography, challenges the established understanding that regional industrial evolution is predominantly characterized by path dependence, and offers important policy implications for the industrial transformation and upgrading of development zones.
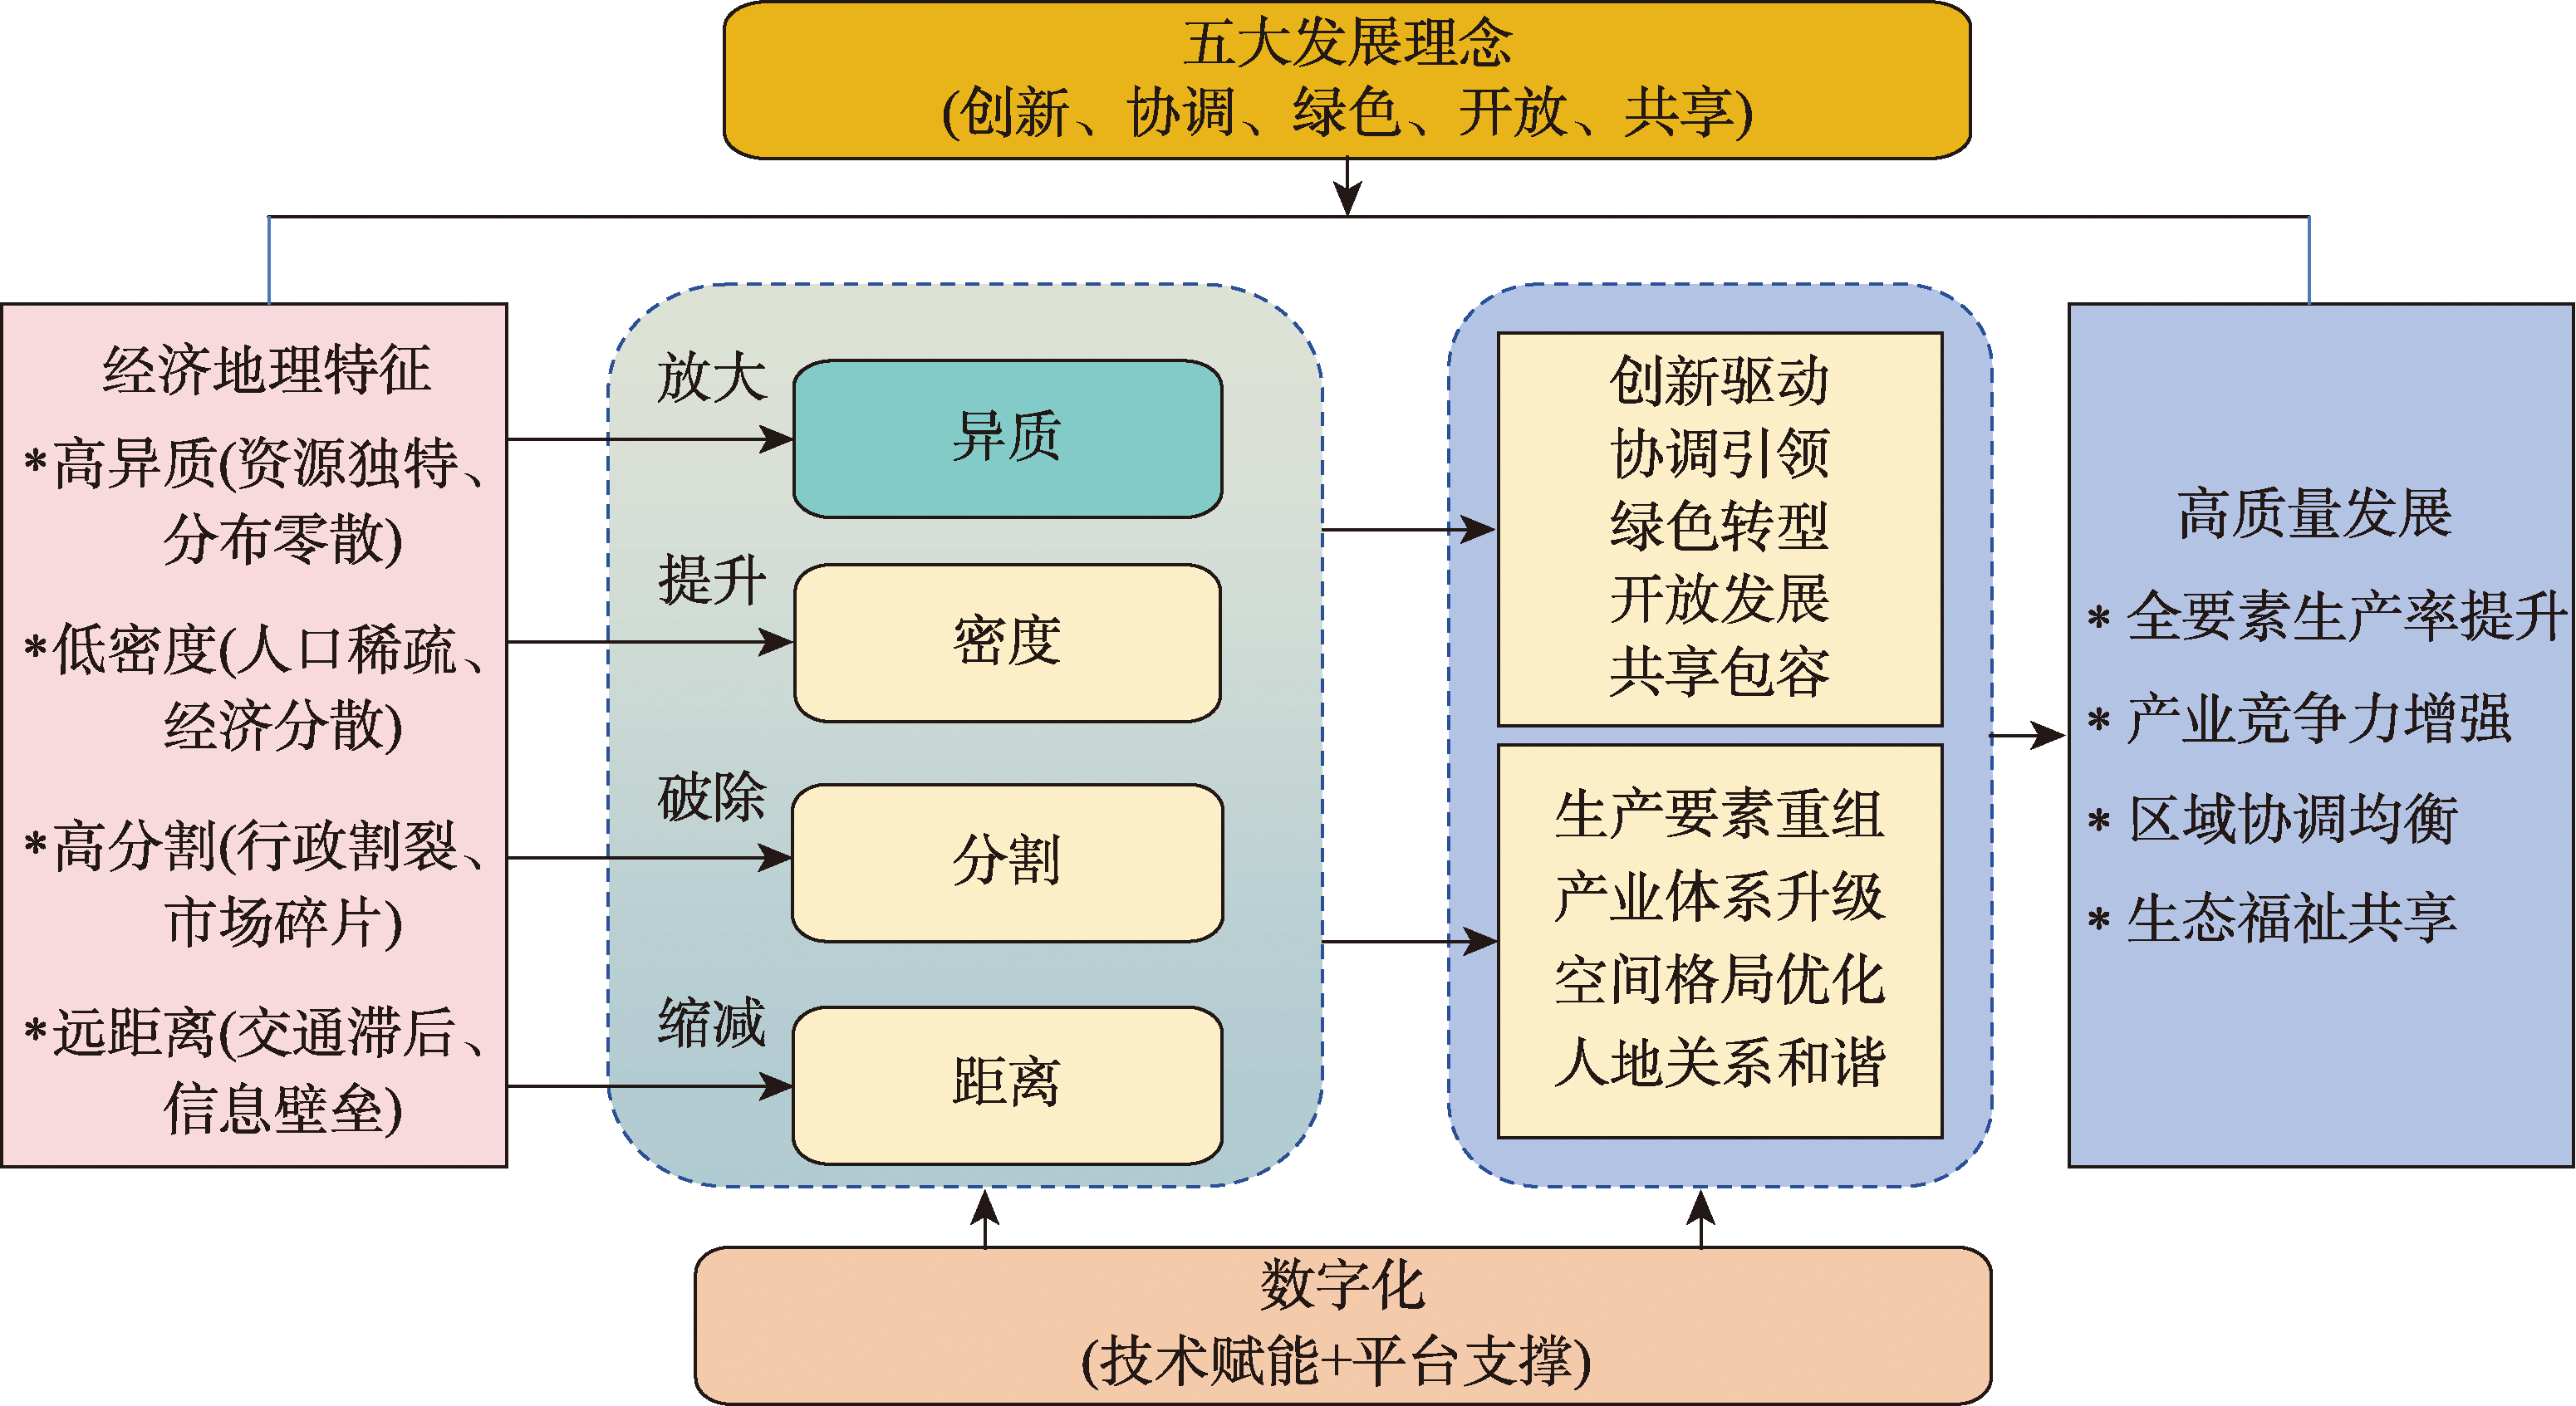
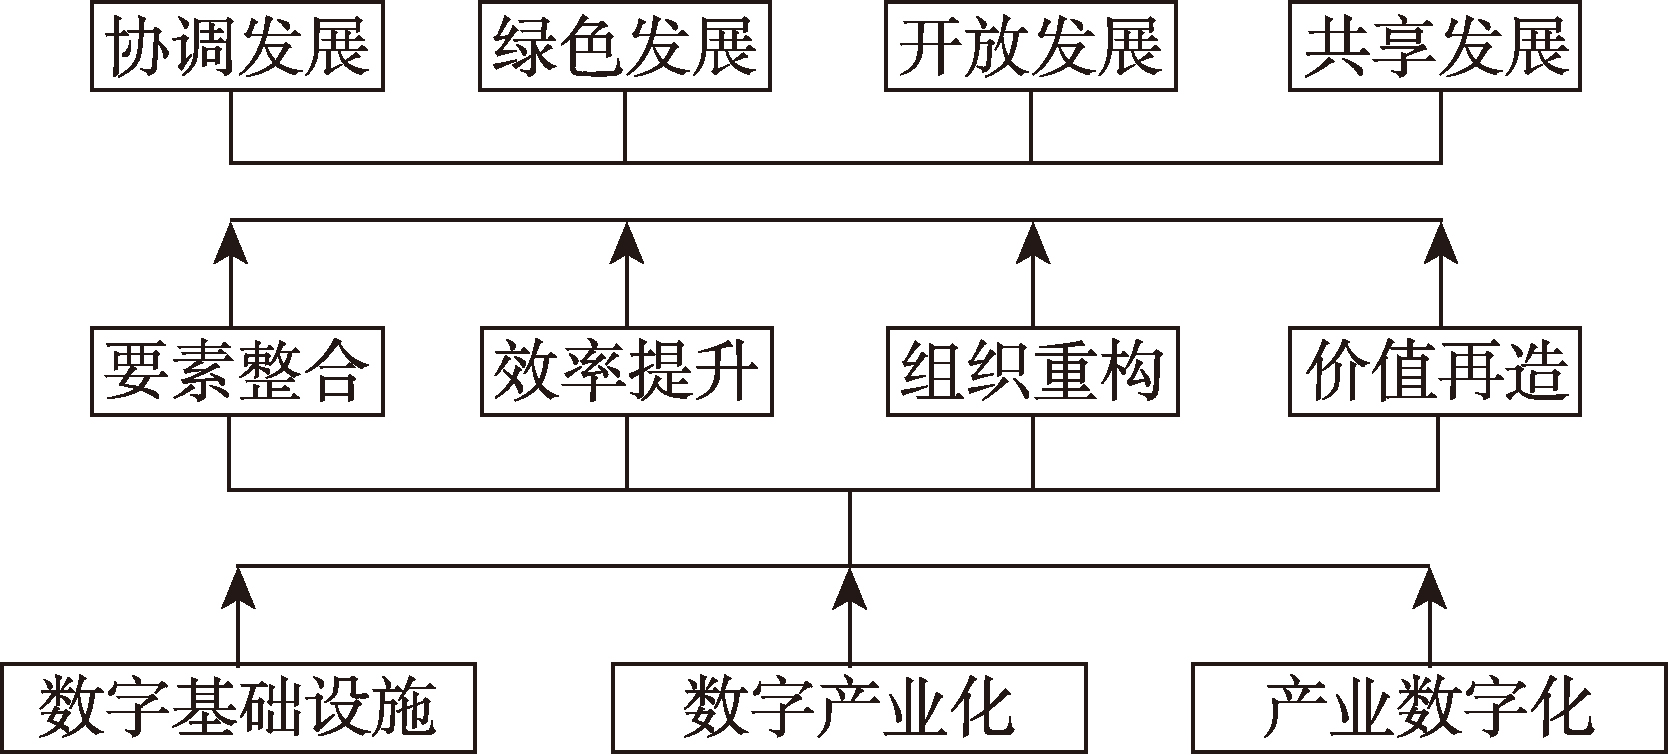
Underdeveloped regions represent critical and challenging areas for China's pursuit of high-quality development. Achieving high-quality development in these regions necessitates not only a differentiated development approach rooted in local conditions but also the strategic embrace of opportunities presented by digitalization to foster leapfrog advancement. This paper applies classic models of spatial economics to identify the economic and geographical characteristics of underdeveloped regions, elucidating the mechanism through which digitalization empowers their high-quality development. Focusing on the Wuling Mountain Area as a case study, we explore nuanced development pathways for such regions. Our key findings include: (1) Economic geographical features such as "long distances, high fragmentation, low density, and high heterogeneity" significantly impede the high-quality development of underdeveloped regions. (2) Digitalization and intelligent technologies are instrumental in reshaping economic geographical patterns by mitigating distance, overcoming fragmentation, enhancing density, and amplifying heterogeneity. This transformation, coupled with strategies centered on innovation-driven growth, coordinated leadership, green transformation, open development, and inclusive sharing, facilitates the reorganization of production factors, the upgrading of industrial systems, the optimization of spatial layouts, and the harmonization of human-land relationships, thereby propelling high-quality development in underdeveloped regions. (3) For the Wuling Mountain Area, the pivot to high-quality development hinges on overcoming long-distance constraints to foster integrated development, breaking through low-density limitations to promote agglomerated development, eliminating high-fragmentation barriers to achieve coordinated development, averting homogeneous competition to ensure differentiated growth, and accelerating digital empowerment to drive integrated progress.
The high-quality development of national integrated transportation corridors serves as a critical foundation for building comprehensive national transport network and supporting the strategy of becoming a country with strong transportation network. During the "15th Five-Year Plan" period (2026-2030), the construction of China's comprehensive national transport network will enter an optimization phase. However, assessment research on transportation corridors in existing studies remains relatively underdeveloped. Based on the scientific connotation and key attributes of transportation corridors, this paper constructs a six-dimensional evaluation index system, encompassing convenience, efficiency, greenness, intelligence, safety, and openness. By integrating GPS data, raster data, and socio-economic statistical data, and employing the entropy-weighted TOPSIS method, the development level and spatial patterns of 21 national integrated transportation corridors are quantitatively evaluated. The results indicate that: (1) Current development of national transport corridors exhibits a three-tier gradient characteristic aligned with the hierarchical differentiation of "main axis-corridor-channel", particularly in the dimensions of convenience, efficiency, and intelligence. (2) Significant regional variation exists, with corridors in the eastern region generally outperforming those in the central and western regions, especially in terms of intelligence and openness. (3) Internal differences among main axes are mainly reflected in efficiency, while for corridors and channels, they are evident in intelligence and openness. A 10% improvement in the efficiency of the Guangdong-Hong Kong-Macao and Chengdu-Chongqing main axis could lead to a 7.14% optimization in its overall development level. (4) The 21 transportation corridors can be categorized into pioneering, consolidation, and foundation-strengthening types, with a quantitative ratio of 1.75:2.5:1. Corridors requiring foundational enhancement are concentrated in western, northern, and border regions.
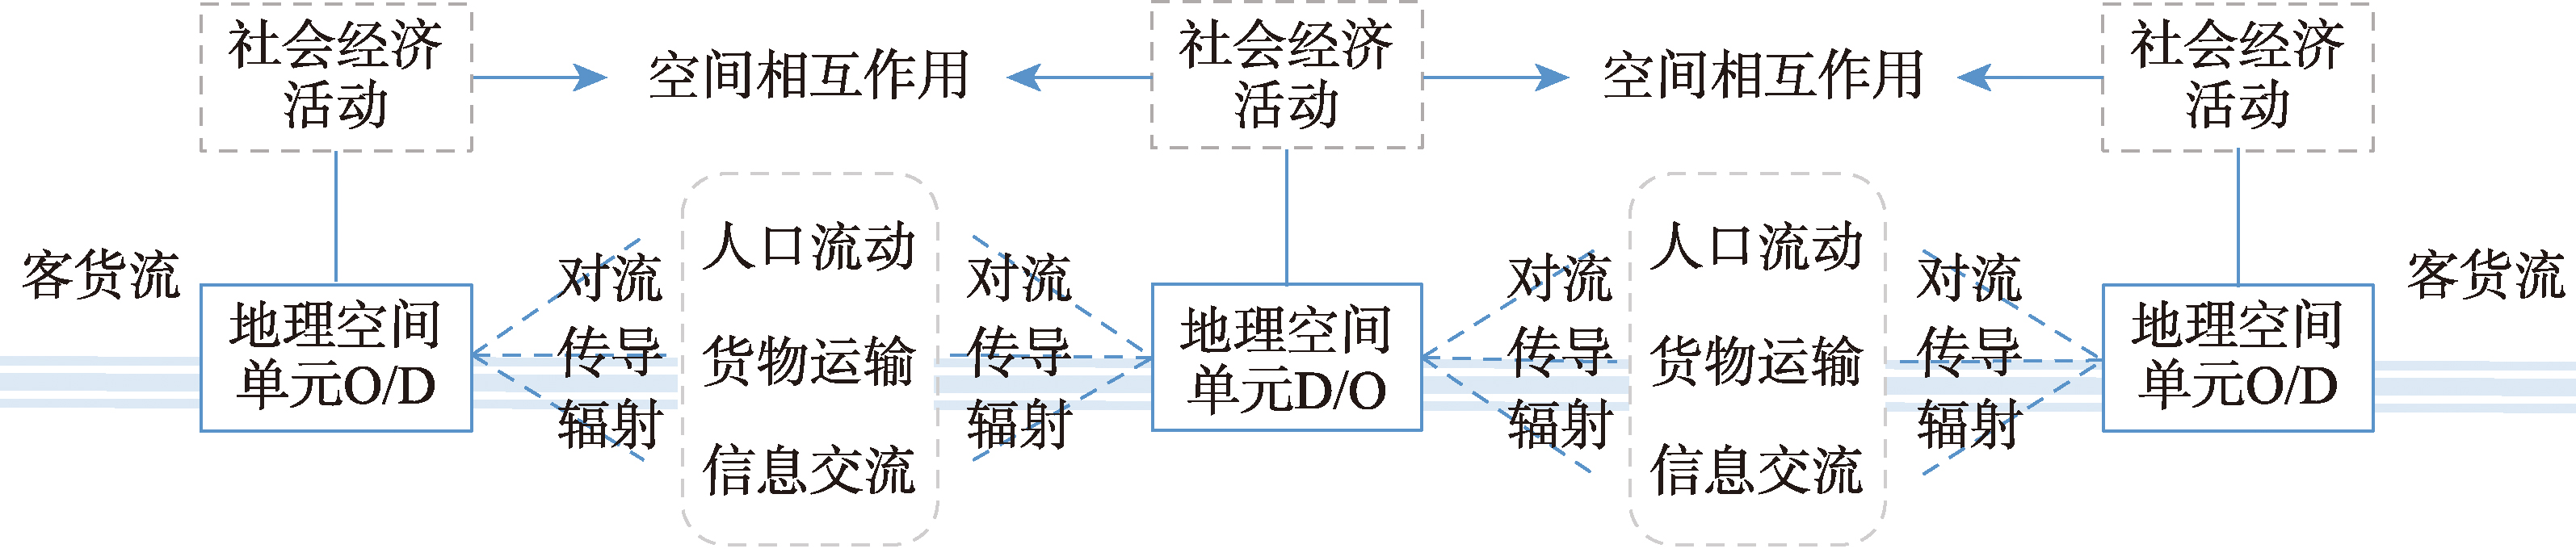
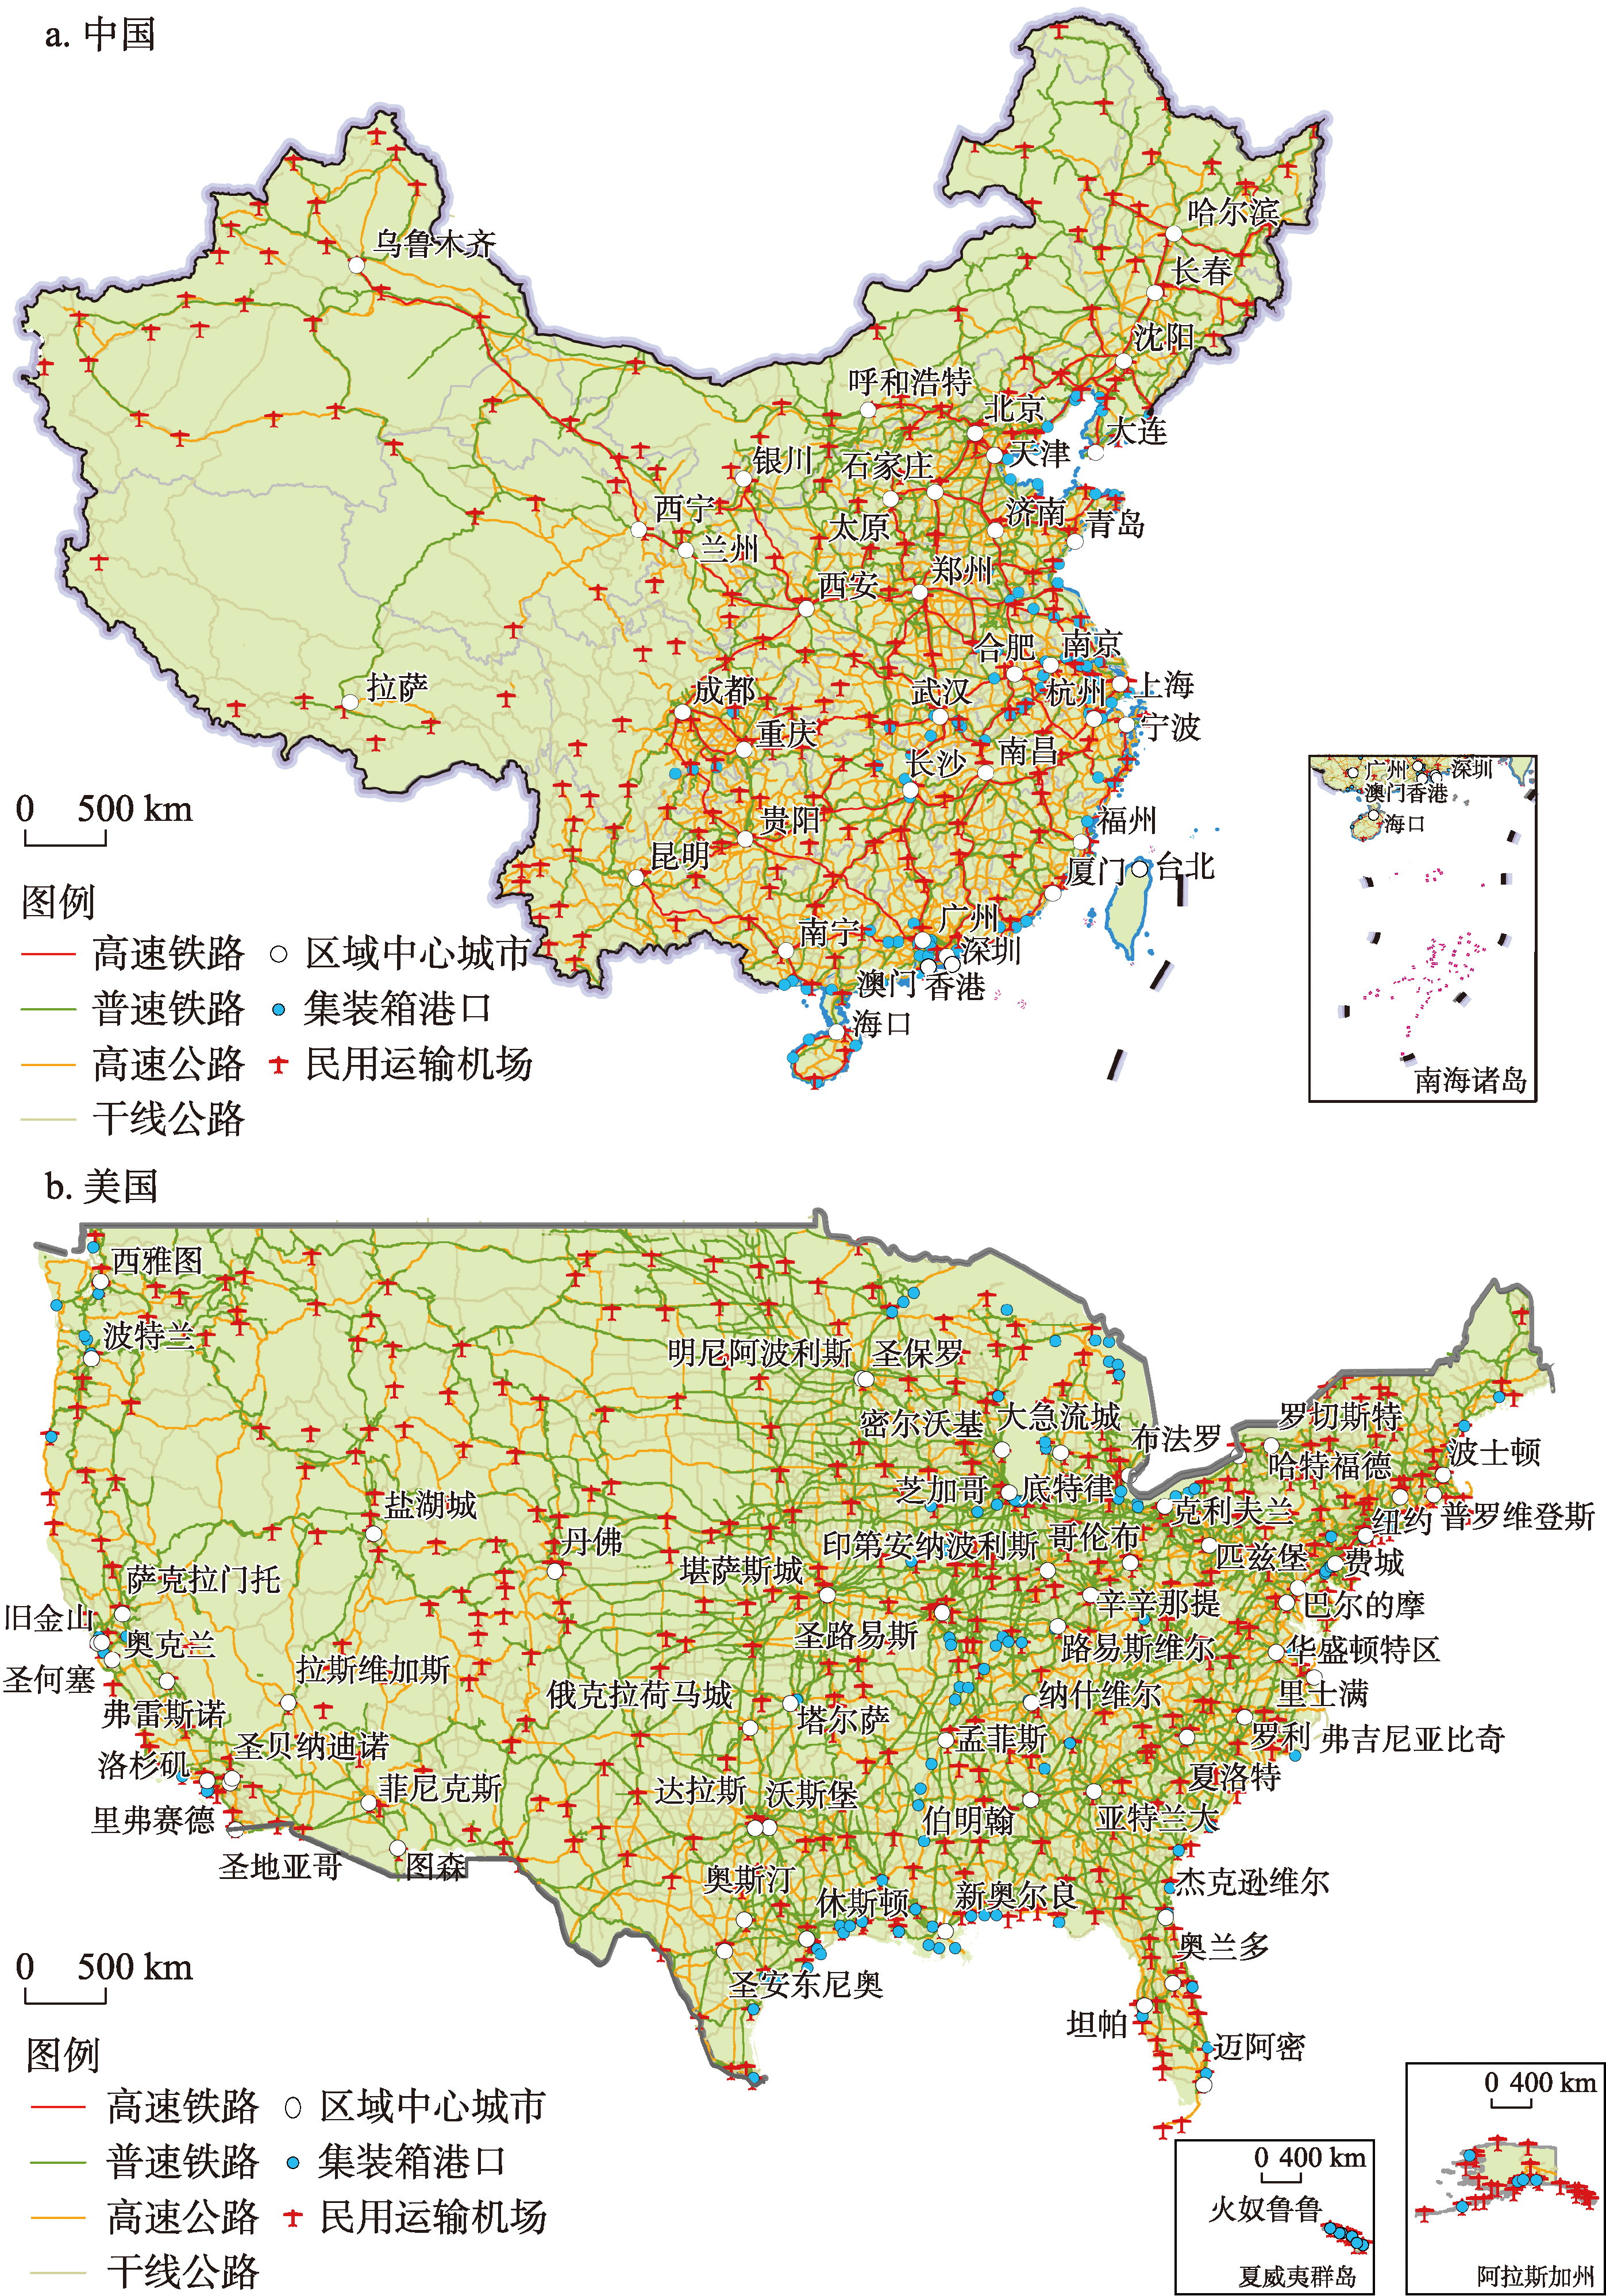
Transport superiority and the spatial patterns of socio-economic development shaped by transport infrastructure are fundamental to national competitiveness, and they exhibit significant variations across countries at different developmental stages. Taking the transport infrastructure networks of China and the United States as typical cases, this paper develops a transport superiority evaluation method applicable to cross-country comparison. It systematically examines both the divergences and similarities in the spatial distribution of transport superiority between the two countries, and further investigates its influence on the spatial organization of socio-economic activities. Results indicate that both China and the United States exhibit evident spatial disparities in the distribution of transport superiority, generally presenting a macro pattern of gradual decline from coastal to inland areas and forming agglomeration zones with distinct superiority. Then, China exhibits a higher level of transport superiority and a more prominent agglomeration trend in its spatial distribution than the United States. Moreover, its transport infrastructure network demonstrates more remarkable service levels and spatial efficiency in supporting the nation's territory, population, and economy. Under the transport superiority shaped by transport infrastructure, the socio-economic spatial organization patterns of the two countries share common features such as spatial organization patterns of sea-land interaction, effectively hierarchical spatial levels, core-periphery efficiency spaces, and corridor diffusion-correlation structures. The spatial patterns of transport superiority and its socio-economic outcomes are shaped by a combination of factors, including the long-term accumulation of transport infrastructure, the stage of national development, the distribution of socio-economic elements, and the underlying conditions of natural location and topography. For China, the policy implication is that a maturing model of national territory development should focus on enhancing functionality and efficiency. Key priorities include optimizing the national development axis-belt structure, consolidating territorial agglomerations at a stable scale, and fostering both sustainable and effective spatial systems alongside spatial cascading mechanisms.
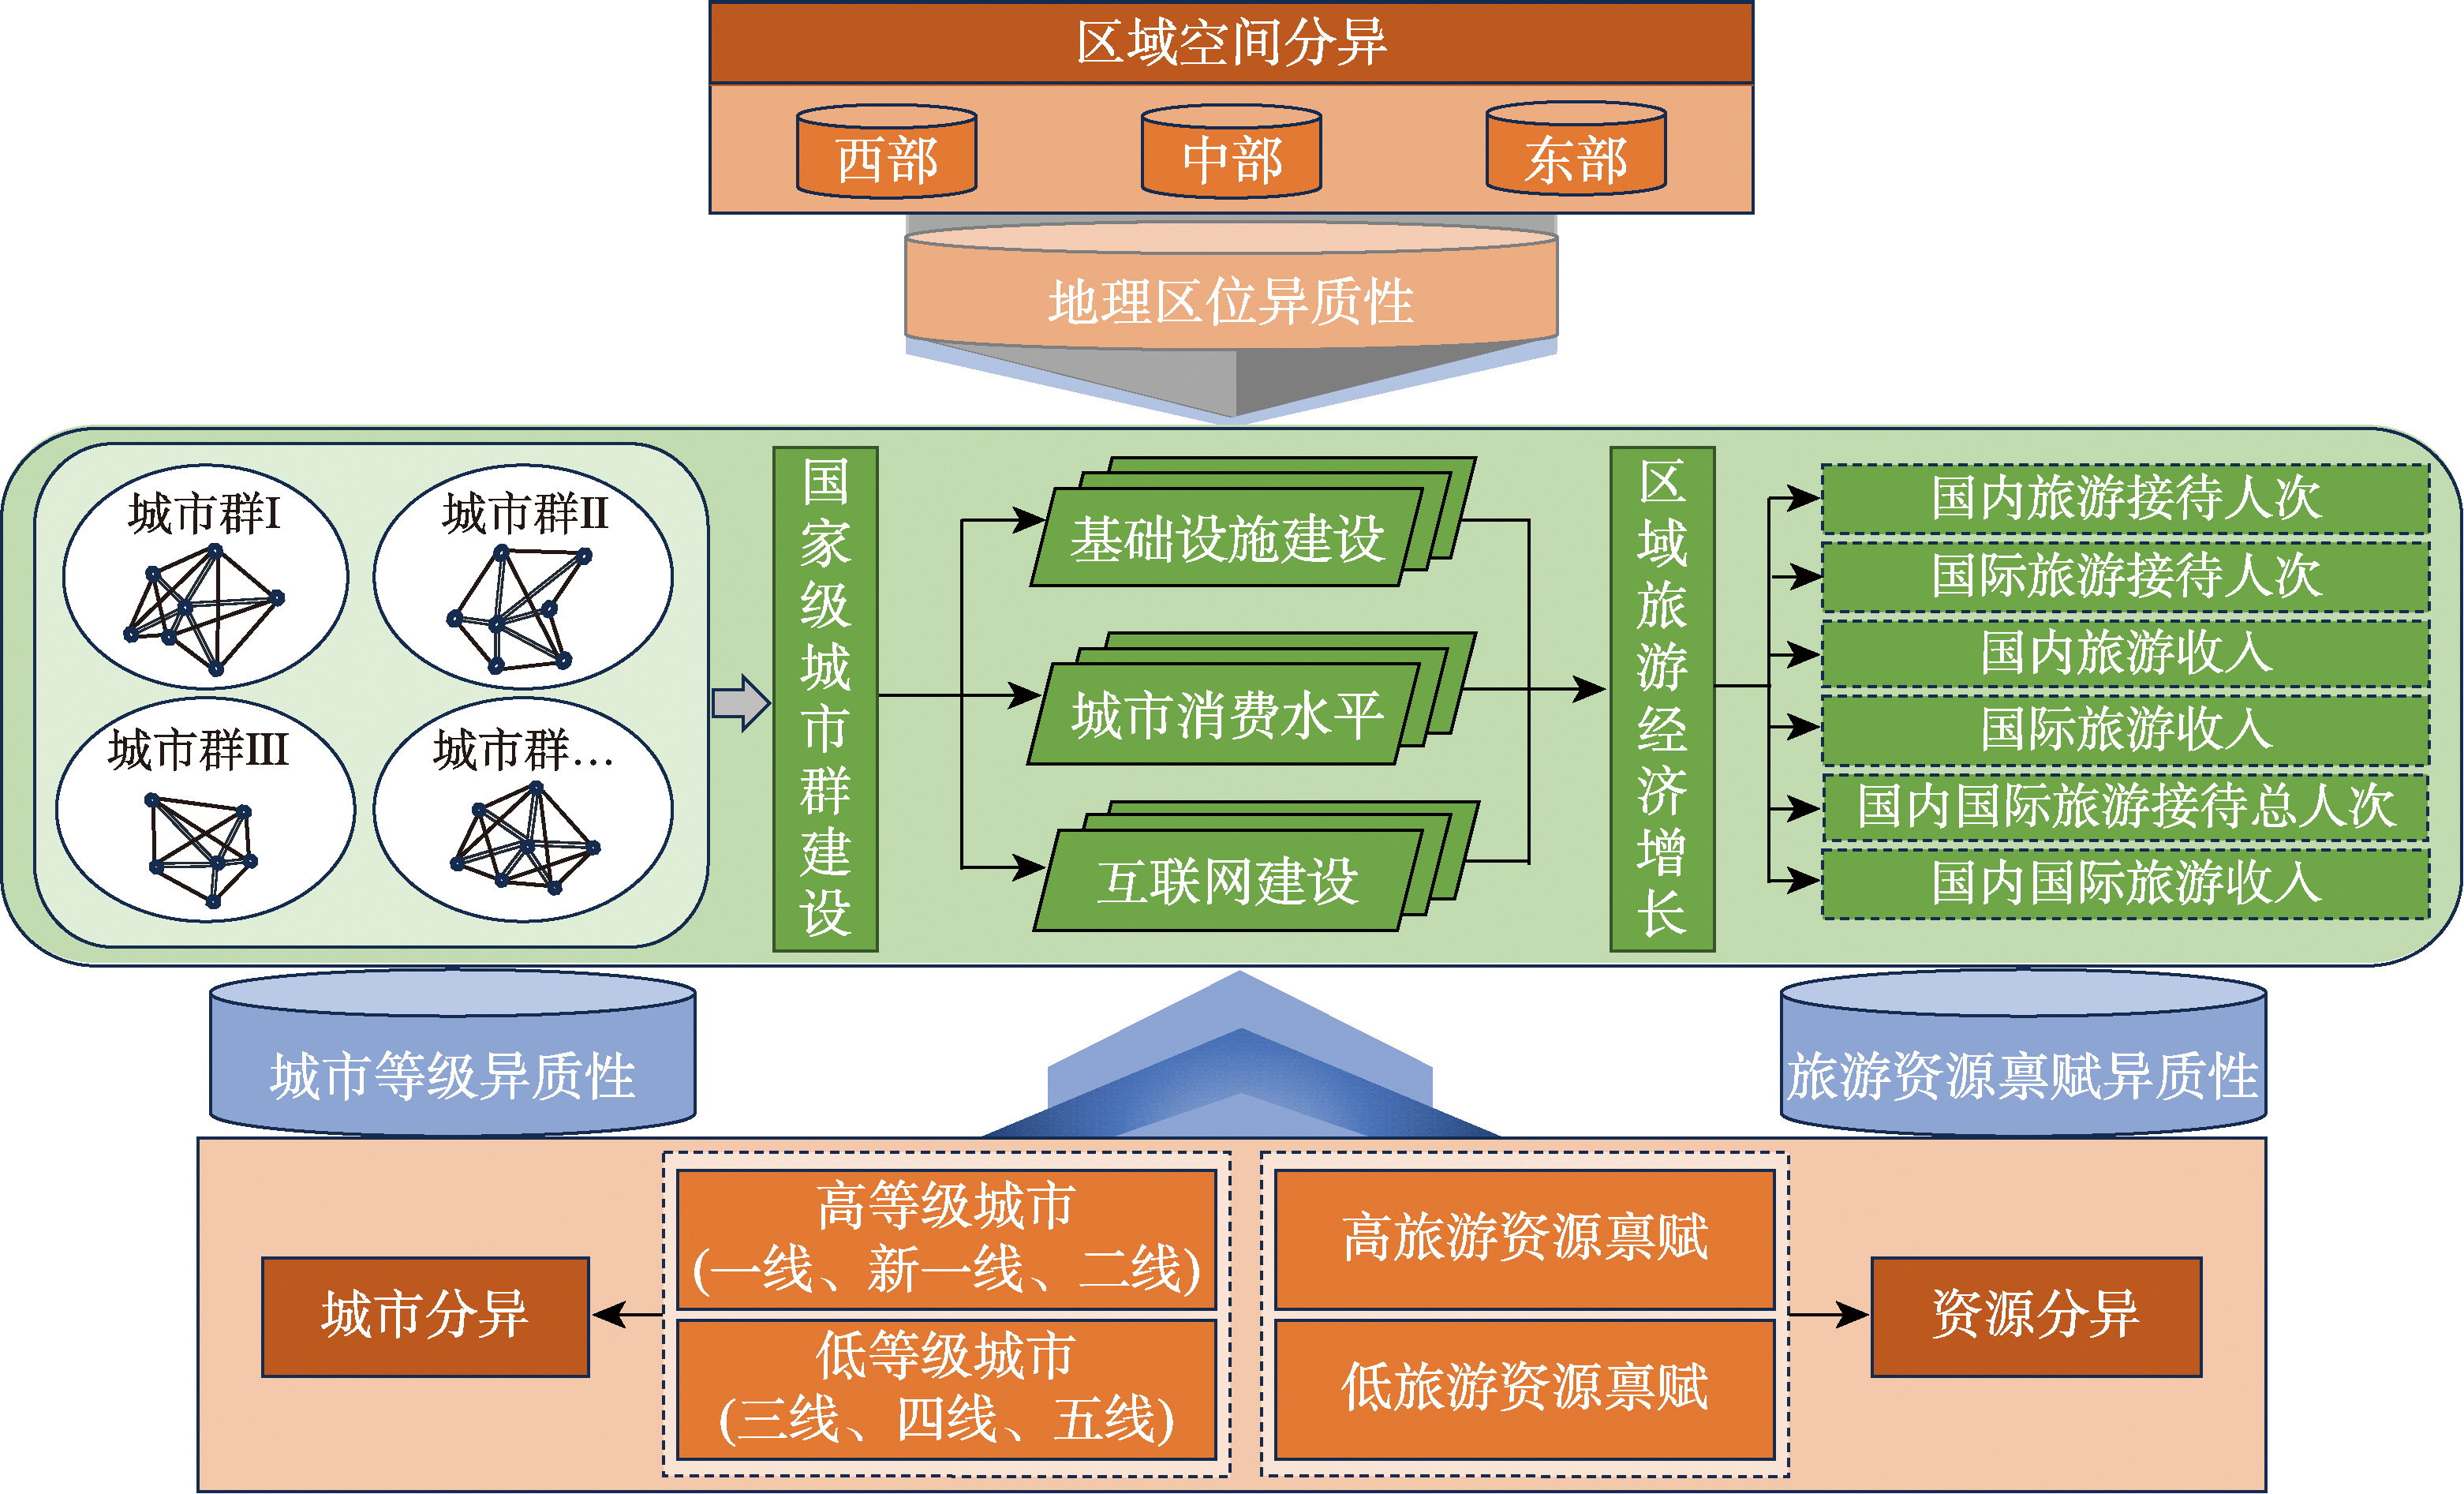
Urban agglomerations, as critical engines of China's urbanization process, are instrumental in creating new opportunities for modern industrial development, specifically by expanding the space for growth and fostering the transformation and upgrading of the regional tourism industry towards high-quality development. While the construction and socioeconomic effects of national-level urban agglomerations have been extensively studied, research on their impact on the tourism economy remains limited. To address this gap, this study investigates the specific mechanisms through which national-level urban agglomeration construction influences tourism economic growth. We employ a quasi-natural experiment design and panel data from 282 prefecture-level cities in China (2010-2019). By applying a Difference-in-Differences (DID) model, the study robustly tests and confirms that the development of these urban agglomerations significantly enhances the growth of city tourism economies. The results show that: (1) Even after various robustness tests aimed at confirming these findings, the positive impacts of urban agglomeration policies remain statistically significant, affirming their critical role in boosting tourism economic growth. The research identifies pronounced heterogeneity in the effects of urban agglomerations on tourism economic growth. The driving effect of the construction of national-level urban agglomerations on the urban tourism economy mainly comes from domestic tourists, thereby promoting the growth of the overall tourism economic indicators. (2) The main channels through which national-level urban agglomerations impact tourism economic growth include the enhancement of infrastructure, an increase in urban consumption levels, and improvements in internet infrastructure. The development of infrastructure facilitates better connectivity, thus attracting more tourists by enhancing accessibility and mobility within the urban agglomeration. Higher urban consumption levels reflect increased economic activity and greater disposable income, which in turn boosts tourist spending. Furthermore, the advancement of internet infrastructure significantly improves information availability and the marketing of tourism-related services, thereby enhancing the overall tourism experience and attracting a larger number of tourists. (3) These effects are more significant in cities within the eastern region of China, in cities classified at lower urban tiers, and in cities with rich tourism resources. This variability suggests that the locational and inherent characteristics of cities can influence how much they benefit from the development of urban agglomerations. The findings of this study not only underscore the significance of national-level urban agglomerations in promoting tourism economic growth but also offer valuable insights for policymakers aiming to leverage urbanization for economic development.
Based on the development concept of Digital China, this paper constructs an evaluation index system for high-quality development of rural tourism empowered by digital technology in Hunan province, and measures the level of such development across 14 cities and prefectures in Hunan from 2011 to 2020. Using the Gini coefficient and convergence model, this study analyzes the regional heterogeneity and convergence of high-quality rural tourism development empowered by digital technology across regions of this province. The results show that: (1) During the study period, the high-quality development level of rural tourism in Hunan exhibited a fluctuating growth trend, with a gradient feature of "Eastern Hunan leading, Central Hunan following, and Western Hunan lagging". (2) In terms of regional heterogeneity, the development level gap between Eastern and Western Hunan was the largest, followed by Eastern and Central Hunan, with relatively small differences between Central and Western Hunan. (3) Regarding convergence, the convergence trend of high-quality rural tourism development levels across the province and within each region gradually weakened, with Eastern Hunan showing the strongest convergence, Central Hunan moderate, and Western Hunan the weakest. Based on these findings, this paper proposes recommendations for strengthening infrastructure in lagging areas such as Western Hunan, promoting regional collaboration, and optimizing policy support to foster balanced high-quality development of rural tourism in Hunan province.
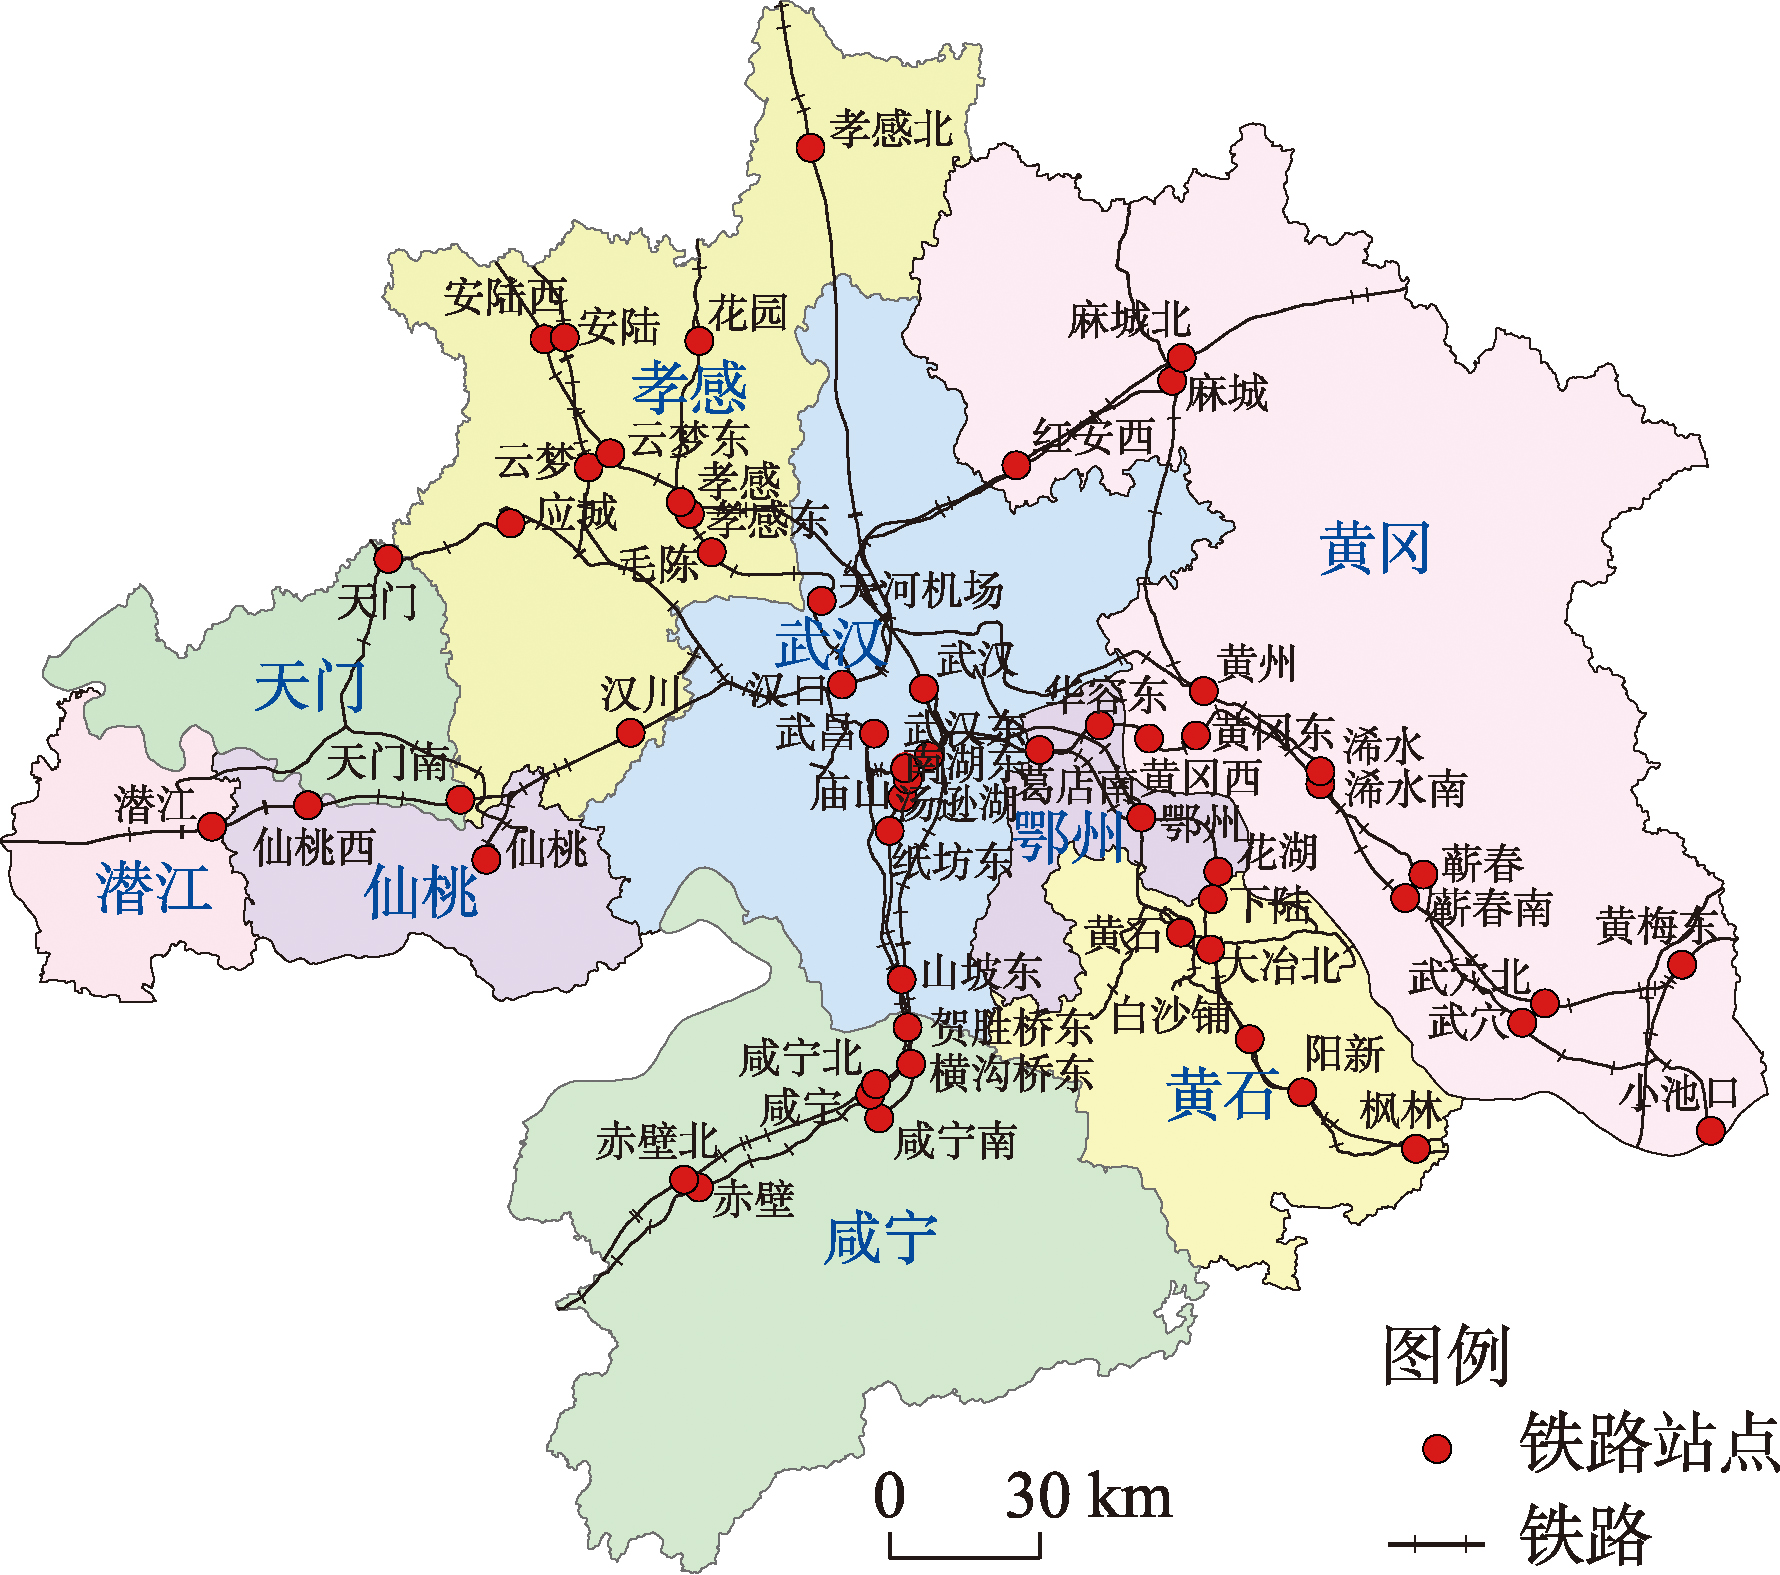
As railway hub stations become increasingly integrated with the urban fabric of metropolitan areas, the accessibility of the public transport network has become a key factor shaping their spatial configurations. From the perspective of the combination of hierarchical space and the space of flows, this paper reveals the role of the multi-node railway network in metropolitan areas in the balanced layout of living facilities and the construction of residents' cross-city living network, providing a new cognitive perspective and scientific basis for the optimization of transportation and service facilities layout in metropolitan areas. Using railway passenger classes flow data and POI data, this study constructed and calculated the three-tier railway network accessibility of Wuhan metropolitan area in 2012 and 2023, divided the functional hierarchy of living facilities by combining diversity and convenience indicators, and explored the impact of railway network accessibility on the functional hierarchy of living facilities and its location heterogeneity with the help of hierarchical linear model (HLM) and multi-scale geographically weighted regression (MGWR) model. The findings are as follows: (1) The Wuhan metropolitan area has formed a multi-center, small group, and networked hierarchical railway network of ordinary-speed, high-speed, and intercity railways. Various living facilities intensive areas spread in a multi-center pattern along the railway point-axis direction and the functional hierarchy of stations in the southern region has been significantly improved. (2) The accessibility of the railway network at both the city and station levels has a significant positive impact on the functional hierarchy of living facilities, and the interaction between these two levels of accessibility is also a significant positive predictor. During the research period, the mixed effect changed from the joint action of the city and station levels to the leading role of the station layer. The interaction between the two levels only exists between commercial service facilities, transportation facilities, and green space and open space facilities. (3) The influence mechanism of functional hierarchy of living facilities has obvious regional heterogeneity. Accessibility plays the dominant role in the core area, whereas economic factors are primary in the periphery. Improving railway network accessibility can serve as an effective strategy to extend the reach of high-grade living facilities, guide the siting of new ones, and ultimately enhance service equity and foster an integrated metropolitan living space.
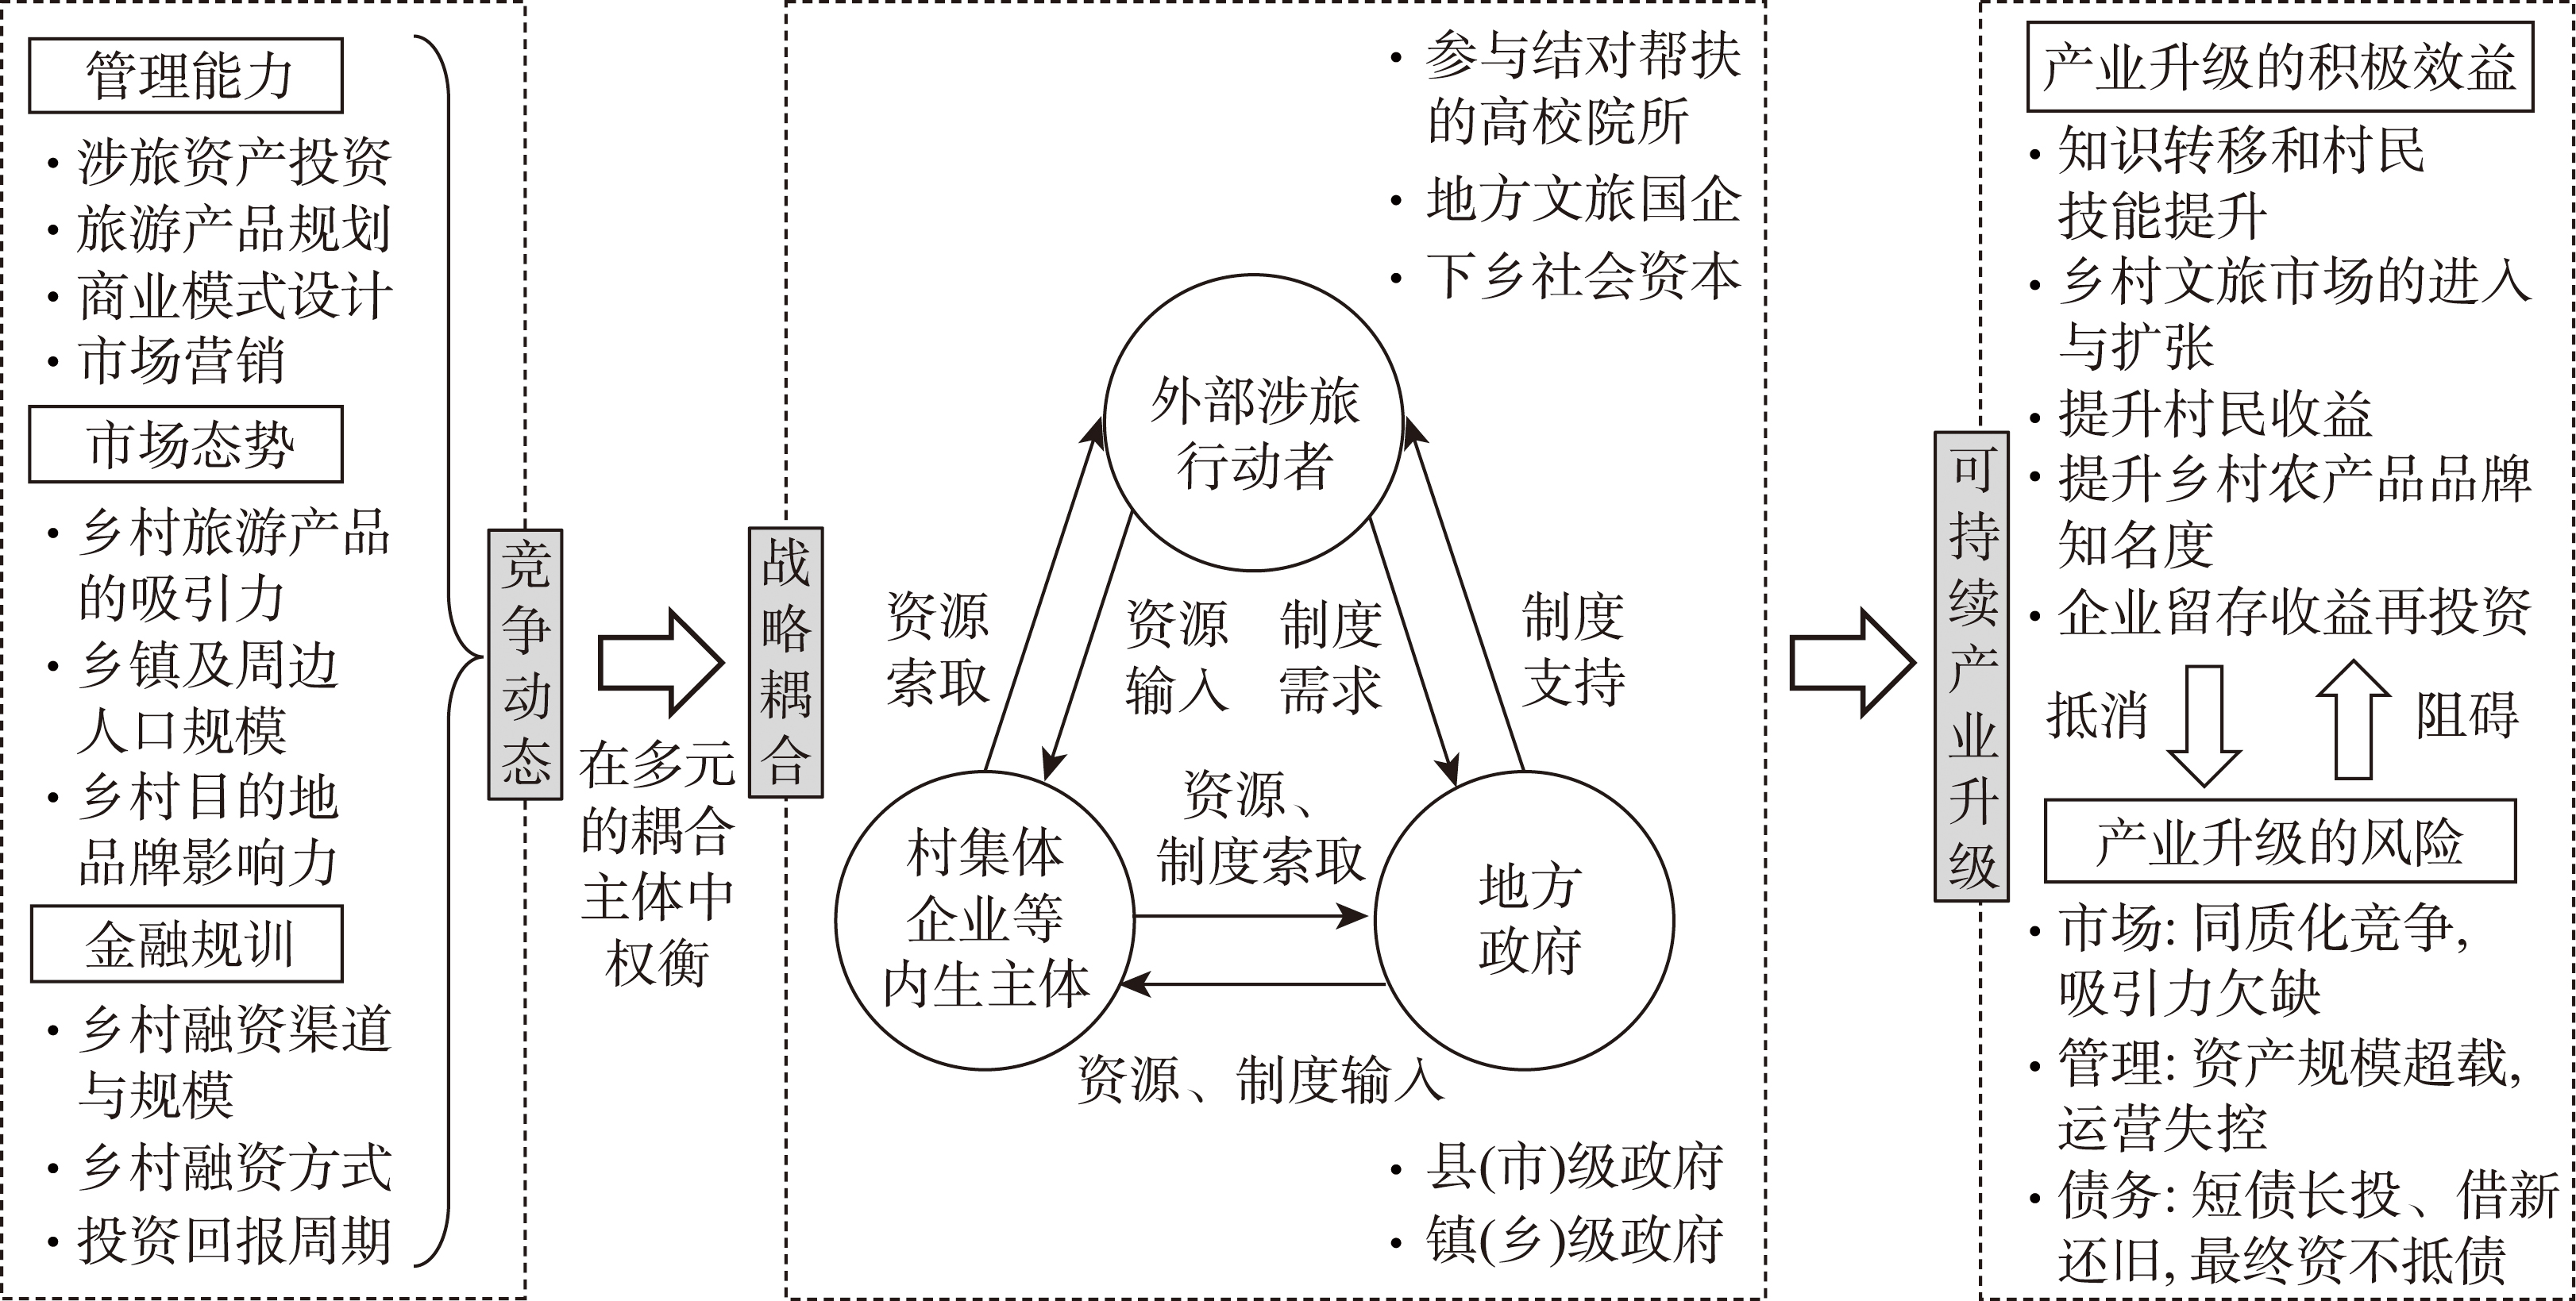
Accelerating rural industrial upgrading through collaboration between internal and external actors has become a crucial strategy in advancing comprehensive rural revitalization in China. However, the inherent tension between the rapid infusion of external resources and the sluggish growth of endogenous capabilities has introduced new risks to industrial upgrading, particularly in the form of escalating debt. To address this challenge, this study adopts the strategic coupling theory from relational economic geography and proposes a novel analytical framework of "competitive dynamics-strategic coupling-sustainable industrial upgrading". This study conducts a comparative case analysis of Village A and Village B in County F, Yunnan province, to explore how distinct modes of strategic coupling generate differentiated opportunities and constraints in the process of rural industrial upgrading. The study yields three key findings: (1) In the current context of rural tourism-driven development, strategic coupling plays a pivotal role in shaping the content, extent, and risk profile of industrial upgrading, thereby fundamentally influencing its sustainability; (2) Managerial capacity, market imperative, and financial discipline emerge as critical variables shaping the strategic coupling between internal and external actors, which differs significantly from the patterns observed in the manufacturing sector; (3) In the case of County F, despite similar managerial capacity and market conditions, villages A and B exhibit divergent upgrading outcomes due to differences in financial discipline within their coupling relationships. Village A, coupled with a local state-owned enterprise and subject to loose financial discipline, experienced rapid industrial upgrading accompanied by unsustainable debt accumulation. In contrast, Village B, coupled with a university under strict financial discipline, achieved slower but more sustainable progress. These findings contribute to a deeper understanding of the mechanisms underlying disparities in rural tourism support outcomes and offer new theoretical insights and practical guidance for fostering sustainable upgrading of rural tourism industries.
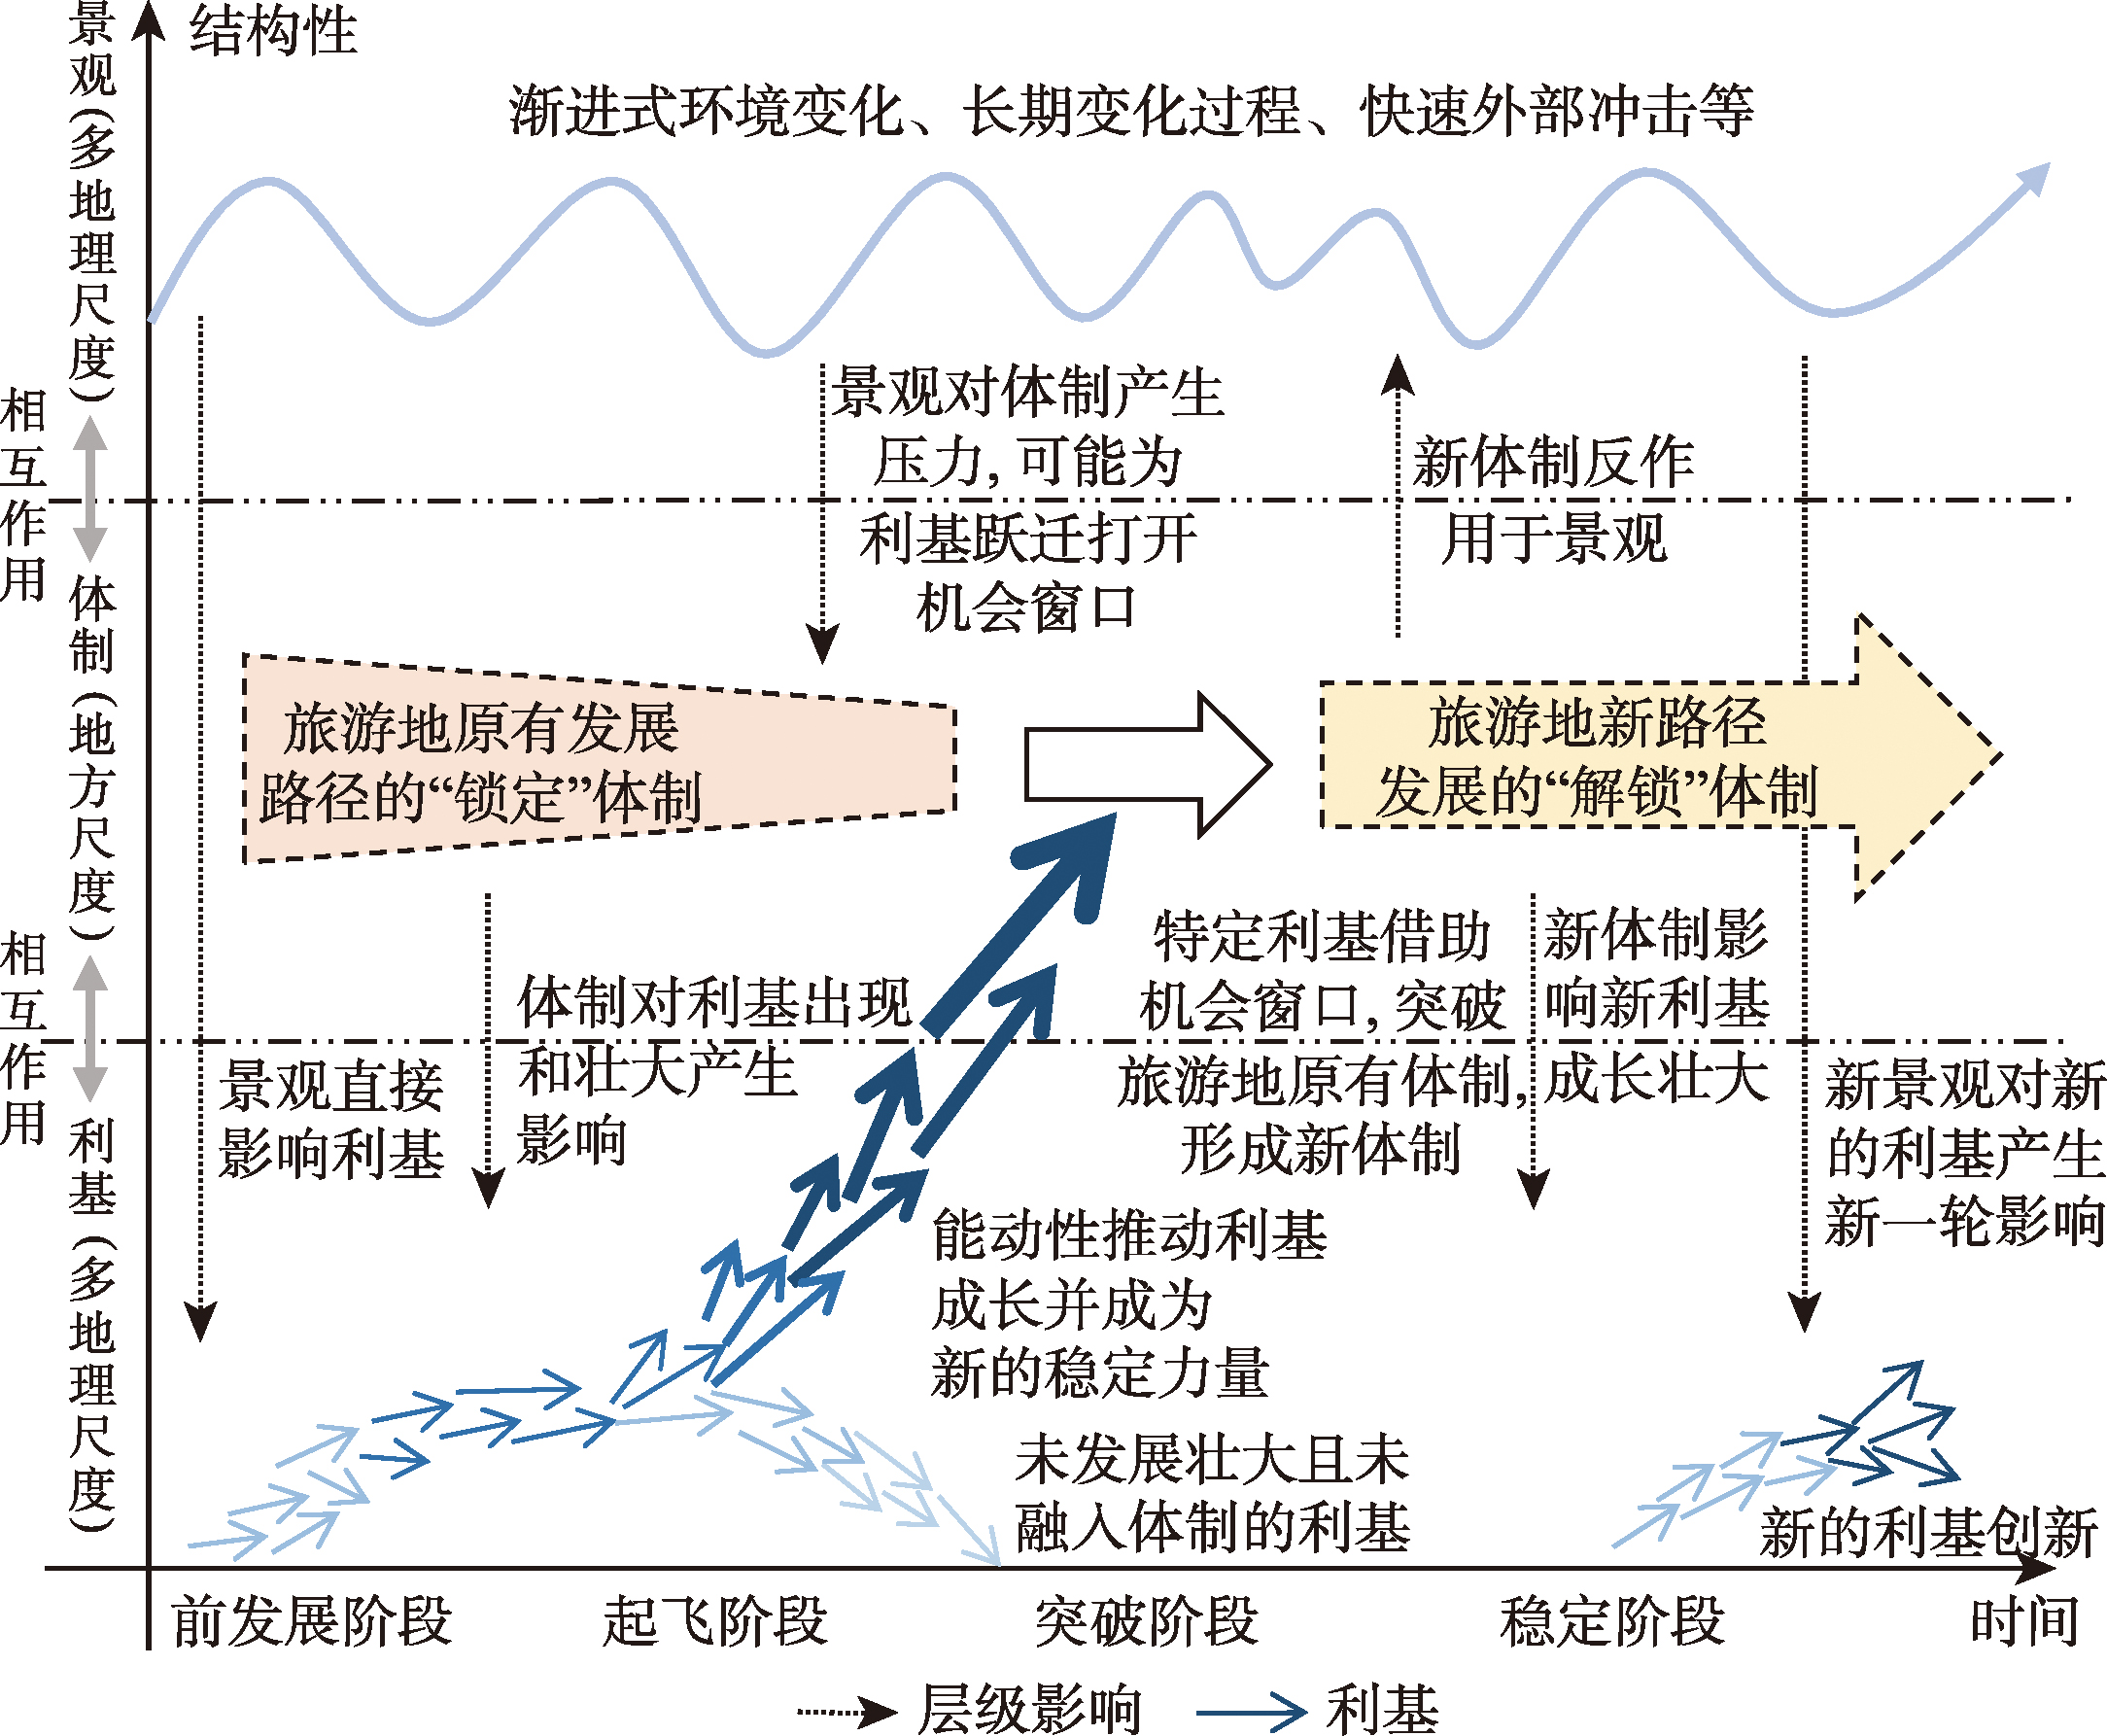
Based on the interaction of landscape, niche and regime from a multi-level perspective, integrating spatial perspective and scale views, this paper constructs an analytical framework to explain the evolution process and mechanism of traditional village tourism destinations, and takes Xidi and Hongcun as cases for verification. This can not only deepen the theoretical foundation of tourism destination evolution research, but also stimulate the application potential of multi-level perspectives. The following conclusions are drawn: (1) The process characteristics, succession nature and driving mechanism of traditional village tourism destination evolution have theoretical compatibility with the multi-level perspective. The multi-level perspective can provide guidance for practice path, development momentum and evolution goal of traditional village tourism destination evolution. From multi-level perspective, traditional village tourism destination evolution is an interactive process of landscape, regime and niche. (2) Under the interaction of landscape, niche and regime, the evolution of Xidi and Hongcun tourism destinations has undergone the pre-development stage, take-off stage, breakthrough stage and stability stage, and completed the transition from traditional rural community to tourism-based tourism villages. At present, it has entered re-takeoff stage and is moving towards an international rural tourism resort, but this stage is not mature. (3) The evolution of Xidi and Hongcun tourism destinations is beyond a single scale, a single subject, a single element and a monodirectional process. Its essence is the combination of time series, opportunity and event chain formed by the complex interaction of landscape releasing external pressure, niche creating sufficient impetus and system providing development basis, which promotes the process of tourism destination unlocking, adaptation and reshaping. The various stages of the evolution of traditional village tourism destinations are interwoven rather than zero-sum substitution. To promote its evolution, it is necessary to establish a dynamic development concept, get rid of the value concept of "accomplishing in one stroke", adhere to long-term thinking, and seize short-term opportunities.
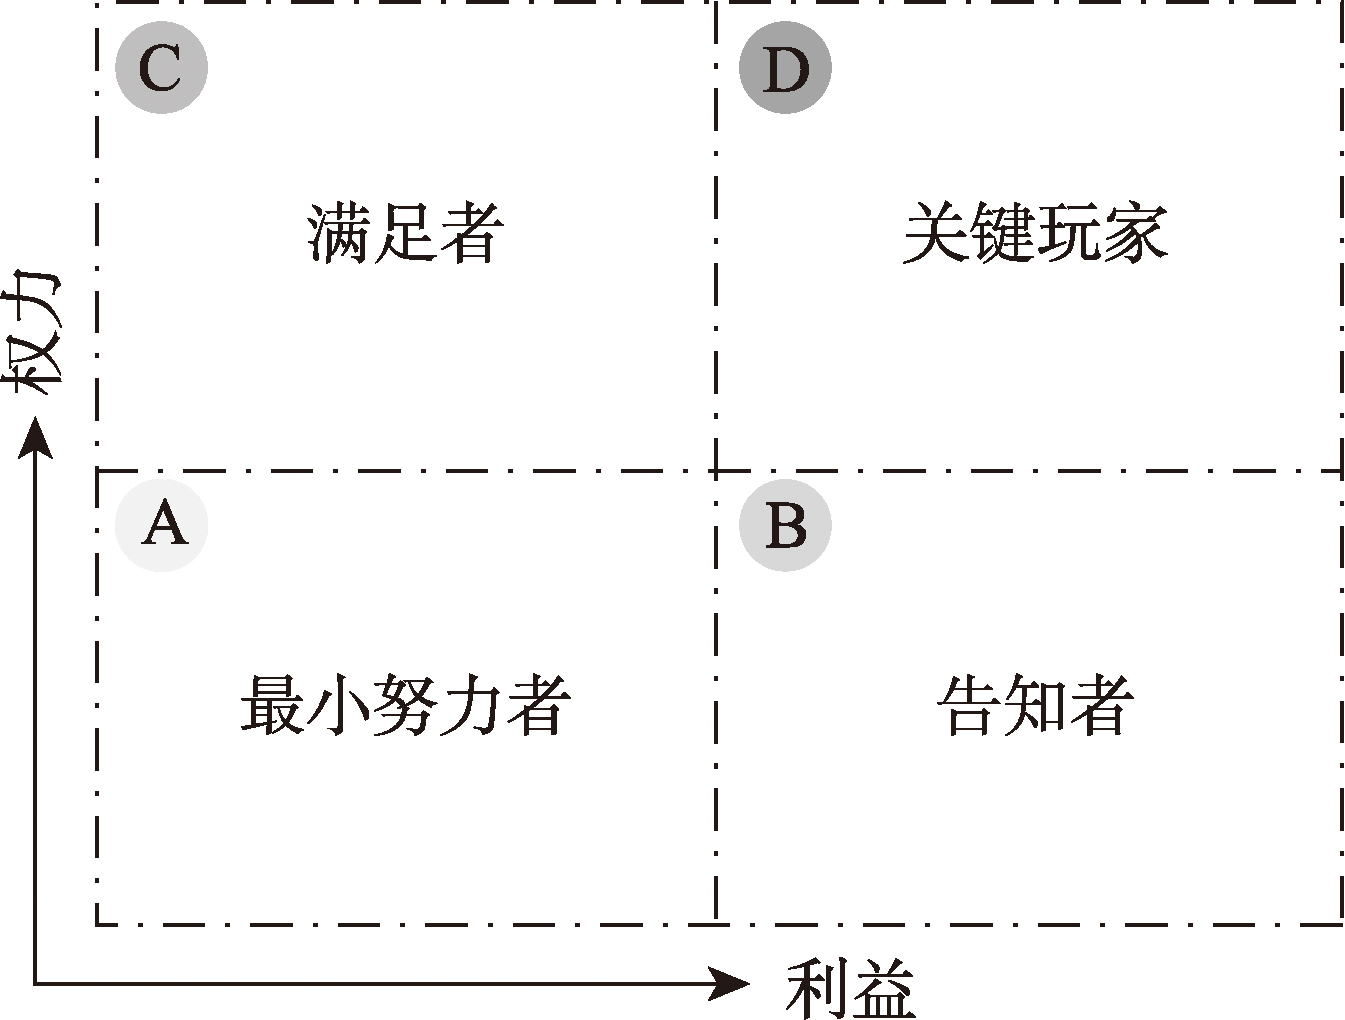
The deepening of global sustainable tourism development has made the tourismification of folk culture a key pathway for promoting rural economic development and cultural inheritance. However, the "failed majority" indicates that multiple hidden traps in the development process of folk cultural tourism pose serious challenges to its sustainability. This study investigates the Bailuyuan Folk Cultural Village in the Guanzhong region as a case study. It employs Q-methodology to identify the divergent perceptions of stakeholder groups regarding core traps in the tourismification process, and constructs a three-level dynamic temporal "power-interest" matrix to reveal the deep generative logic of these "tourismification traps". The findings demonstrate that: (1) Three key traps exist in the process of folk culture tourismification: "means-end chain disruption", "cultural alienation", and "responsibility decoupling". (2) The structural misalignment of power and interests among stakeholders is the root cause of the development predicament. Based on these findings, this study proposes an operable local collaborative governance mechanism, the "round table conference", structured on spatial power relations. This paper offers a dynamic analytical perspective for the sustainable development of folk cultural tourism, providing significant reference value for related research and local practice.