姚丽贞 , 乐阳
, 乐阳
YAO Lizhen, YUE Yang
通讯作者:
收稿日期: 2016-07-21
修回日期: 2016-09-30
网络出版日期: 2016-11-20
版权声明: 2016 《地球信息科学学报》编辑部 《地球信息科学学报》编辑部 所有
基金资助:
作者简介:
作者简介:姚丽贞(1991-),女,硕士生,研究方向为数据分析与挖掘。E-mail: yaolizhen715@foxmail.com
展开
摘要
重力模型是地理学的经典模型之一,常用于解释和预测人口、货物、交通、财富等的移动现象。其中Huff模型被广泛用于预测商圈规模,但目前多数研究以商场的面积作为吸引力的度量指标,不能准确反映商场真实的吸引力,造成模型预测的误差。本文针对Huff模型常使用规模表达商圈吸引力的不足,在对购物中心吸引力进行总结的基础上,选择了深圳市5个具有代表性的大型购物中心(或商圈)进行问卷调查。利用因子分析方法识别出6个影响购物中心吸引力的因子:可达性因子、环境因子、私家车出行因子、多功能因子、商品因子和个人特征因子。基于主成分Logistic模型,分析购物中心吸引力的显著影响因素及权重。最后,通过对比不同参照系下购物中心的显著性因素,对商圈吸引力因子进行可靠性检验。本文的分析方法及结果可为Huff模型等的精细化建模提供基础。
关键词:
Abstract
As one of the most classical geography models, Huff model has been widely used in explaining and predicting the movement of human, goods, transport, and currency. In determining trade area for shopping centers, the size of the shopping center is the most commonly used parameter to reflect its attractiveness. However, the attractiveness of a shopping center is usually determined by many other factors, such as price, services, accessibility and environment. Therefore, using size as the measurement of shopping center attractiveness could cause misleading results. To obtain the actual attractiveness factors that should be used in Huff model, this study conducted a questionnaire on five representative shopping malls in one of the largest city in Shenzhen, China, and identified six factors using factor analysis. Then, we used principal component Logistic model to obtain their level of significances and corresponding weights. The results of this study could be helpful to parameter selection of Huff model and thus improve the accuracy of model prediction.
Keywords:
Huff模型是经典的重力模型,用于解释和预测人口、货物、交通、财富等的移动,被广泛应用在预测商圈规模[1]、医院[2]等设施的选址策略中。虽然Huff模型有多种变形,多数研究都以“规模”(如商场的面积或店铺的数量[3-4])作为吸引力的度量指标。但是,许多研究已经证明,规模在商圈吸引力因素中并非显著性因素,其它因素,如商品多样性、商场环境、服务质量,以及距离、可达性因素[5]等,都是决定购物中心吸引力的不可忽略的因素[6-11]。仅以面积或商店数量等规模因素作为吸引力进行建模过于粗略,会造成模型预测的不准确性[1,5]。因此,本文通过对几个典型购物中心和商圈的问卷调查,分析影响购物中心或商圈的吸引力因素,从而为重力模型的精细化建模提供基础。
Reilly[12]在1931年最早指出城市购物中心吸引周边顾客的消费量与该市人口数呈正比;Huff在考虑个别顾客行为的基础上对其模型进行了修正,提出了Huff模型(哈夫模型)[13],将购物中心的规模作为吸引力指标;1974年Huff和Bastsell[14]对哈夫模型进行了修正,如式(1)所示。
式中:
在市场分析和零售地理相关研究中,有不少关于购物中心吸引力因子分析的研究。本文在文献[15]的基础上,将其归纳为以下几点,如表1所示。
表1 影响购物中心吸引力的主要因素
Tab. 1 Main factors affecting shopping center attractiveness
| 因子 | 描述 |
|---|---|
| 主力店 | 有吸引力的主力店、主力店的商品种类丰富、 主力店的购物气氛令人舒畅、主力店购物方便 |
| 功能多样化 | 有酒吧与餐馆、各种娱乐设施、休闲场所 |
| 商户组合 | 有很多知名的零售店铺、零售店铺选择多、有一定吸引力 |
| 商品价格 | 总体价格低、很多特价商品、商品性价比高、商品质量好 |
| 购物实体环境 | 购物中心气味宜人、空气舒适、温度舒适 |
| 空间布局 | 安全的迅速转身及移动、容易辨别自己所处的位置、店铺安排一目了然 |
| 购物氛围 | 让人心情舒畅、氛围很舒适 |
| 人员服务 | 友好、称职、有丰富的商品知识 |
| 停车 | 免费停车位、停车费在可接受范围内、有充足停车位 |
| 交通 | 容易到达、很快到达该购物中心 |
在此基础上,本文设计了调查问卷,通过调查深圳市5个大型购物中心或商圈,并对所得的数据进行分析整理。
(1)问卷内容
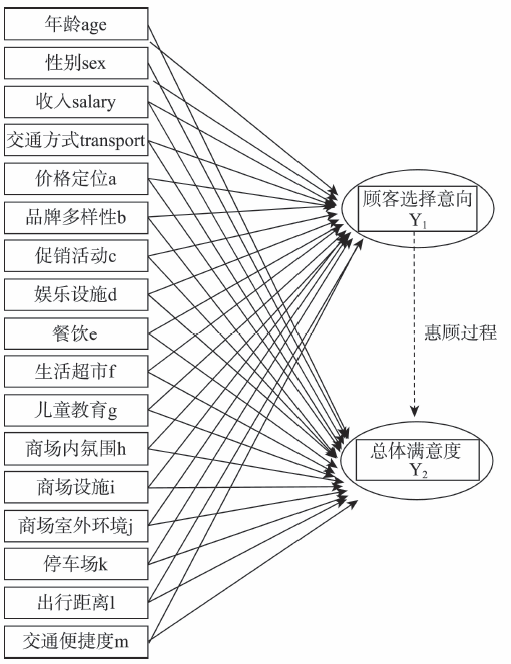
问卷分为3大部分:①顾客的个人信息,如年龄、性别、收入;②被调查者的购物出行情况;③顾客对该商圈影响因素的感知价值,以李克特5分量表(Likert Scale)[16]进行描述。对于因变量的设置,购物中心的吸引力可以通过顾客选择行为来表现,另一方面也可以通过顾客满意度来体现,顾客的满意度是由惠顾体验和对各个项目的感知价值共同决定的,故问卷最后设置了本商圈对顾客的吸引程度的评分问题。图1显示了问卷中涉及的以上3部分内容(共17个变量)及其关系。
表2 变量赋值或编码
Tab. 2 Variable and coding
| 变量 | 测量尺度 | 赋值 |
|---|---|---|
| 年龄 | 定距定比变量 | <18岁;19-25岁;26-35岁;36-50岁;>50岁 |
| 性别 | 定类变量 | 男性;女性 |
| 收入 | 定距定比变量 | <5千;5千~1万;1万-2万;>2万 |
| 交通方式 | 定类变量 | 出租车(私家车);公交车;地铁;步行 |
| 商圈因素(a-m) | 定序变量 | 李克特量表打分制,对本商圈各项满意度打分,从满意度很低至很高为1-5分 |
| 顾客选择Y1 | 定类变量 | 东门;华强北;Cocopark;宝能太古城,海雅缤纷城 |
| 总体满意度Y2 | 定序变量 | 满意度从低到高为1~10打分制 |
由于需要量化各影响因素变量,问卷对所选变量编码或赋值,如表2所示。
(2)实地调查
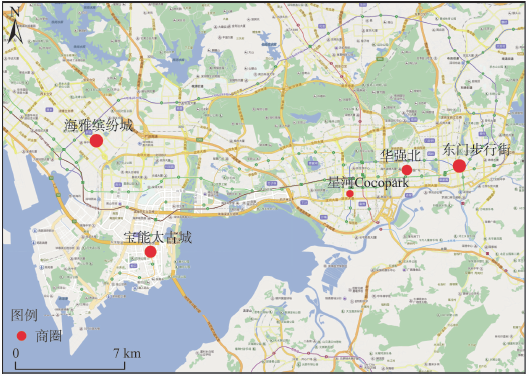
调查地点选择在深圳市具有代表性的5处大型购物中心商业圈:东门步行街、华强北商业圈、福田星河Cocopark、海雅缤纷城、宝能太古城。其位置如图2所示。
东门步行街是深圳最早出现的商业区,目前已发展成具有一定规模的商业步行街,街区内有众多大型商厦和大型批发市场,交通十分便利,是集购物、休闲和旅游于一体的商业步行街。华强北商业圈包揽了电子、电器、服装、百货等行业,有大型商场20多家,是多行业、多功能的综合商业旺区。星河Cocopark位于福田CBD中心区经济动脉上,无缝衔接地铁站,交通便利,采用主力店、精品店铺和特色酒吧街的商家组合策略。海雅缤纷城位于宝安区,是深圳西部最大的商业综合体。宝能太古城(宝能All city)位于南山后海区域,紧邻香港西部通道,交通便利,除地铁接驳外另拥有3000多个停车位。由于营业不久,调查时还有商场品牌在调整中。
本次调查共发放750份纸质问卷,5个商圈各150份问卷,均由调研人员在商圈内随机发放。回收问卷中有效问卷517份(东门107份,华强北102份,福田Cocopark 148份,海雅缤纷城105份,宝能太古城55份),有效问卷回收率为68.9%。问卷描述性统计见表3。
表3 问卷描述性统计
Tab. 3 Descriptive statistics of the questionnaire
| 数量/人次 | 百分比/(%) | ||
|---|---|---|---|
| 年龄 | <18 | 63 | 12.2 |
| 19-25 | 173 | 33.5 | |
| 26-35 36-50 | 191 67 | 36.9 13 | |
| >50 | 23 | 4.4 | |
| 性别 | 男 女 | 236 281 | 45.6 54.4 |
| 月收入/元 | <5000 5000-10 000 10 000-20 000 >20 000 | 240 166 75 36 | 46.4 32.1 14.5 6.9 |
(3)问卷信度分析
由于是主观态度的问卷,本文采用Cronbach's alpha系数来评估问卷信度。该系数用于考察问卷中各项目得分的一致性,是目前各类实证研究中最常用的信度分析工具。Cronbach's alpha系数若小于0.35,则应拒绝;当系数在0.35-0.7时表示信度可以接受,当系数大于0.7表示信度相当高[17]。本次调查问卷的Cronbach's alpha系数为0.695,因此本文采用的问卷数据是可信的。
(4)共线性诊断
计算容许值和方差膨胀因子,有2个条件指数大于30,分别是40.49和31.34;且40.49对应的截距方差分解比为98%,31.34对应的商场内氛围、商场设施的方差分解比分别为85%和53%,均超过了50%,表明本调查问卷数据中自变量存在多重共线性。因此,分析前需对以上问卷数据进行主成分分析,提取综合因子,消除多重共线性。
首先使用KMO 样本测度来检验数据是否适合做因子分析。KMO 在0-1之间,值越接近1,则越适合作因子分析[18]。如表4所示,本调查数据的KMO值为0.760,大于0.7;Bartlett球形度检验的卡方值为2038.084,此外,巴特利球体检验的统计值的显著性小于0.001,也说明该组数据具有较高的相关性,适合做因子分析。
表4 KMO与球形Barlett检验
Tab. 4 KMO and Barlett’s test
| 检验项 | 检验值 | |
|---|---|---|
| 取样足够度的 Kaiser-Meyer-Olkin 度量 | 0.760 | |
| Bartlett的球形度检验 | 近似卡方 | 2038.084 |
| df | 153 | |
| Sig. | 0.000 | |
本文采用主成分分析法作为抽取方法进行因子分析,因子的旋转方式利用正交旋转,即方差最大旋转方式,并将特征值大于1作为因子提取的标准。对方差表所有标准化后的变量进行主成分分析,结果见表5。
表5 主成分解释
Tab. 5 PCA variance explained
| 成份 | 初始特征值 | 提取平方和载入 | 旋转平方和载入 | ||||||||
|---|---|---|---|---|---|---|---|---|---|---|---|
| 合计 | 方差的百分比/(%) | 累积百分比/(%) | 合计 | 方差的百分比/(%) | 累积百分比/(%) | 合计 | 方差的百分比/(%) | 累积百分比/(%) | |||
| 1 | 3.762 | 20.901 | 20.901 | 3.762 | 20.901 | 20.901 | 2.611 | 14.503 | 14.503 | ||
| 2 | 2.068 | 11.488 | 32.390 | 2.068 | 11.488 | 32.390 | 2.003 | 11.127 | 25.630 | ||
| 3 | 1.696 | 9.421 | 41.811 | 1.696 | 9.421 | 41.811 | 1.712 | 9.512 | 35.143 | ||
| 4 | 1.260 | 6.999 | 48.810 | 1.260 | 6.999 | 48.810 | 1.629 | 9.049 | 44.192 | ||
| 5 | 1.101 | 6.114 | 54.924 | 1.101 | 6.114 | 54.924 | 1.516 | 8.421 | 52.612 | ||
| 6 | 1.077 | 5.981 | 60.905 | 1.077 | 5.981 | 60.905 | 1.493 | 8.293 | 60.905 | ||
| 7 | 0.901 | 5.004 | 65.909 | ||||||||
| 8 | 0.842 | 4.677 | 70.585 | ||||||||
| 9 | 0.746 | 4.142 | 74.727 | ||||||||
| 10 | 0.738 | 4.099 | 78.827 | ||||||||
| 11 | 0.635 | 3.528 | 82.355 | ||||||||
| 12 | 0.600 | 3.332 | 85.687 | ||||||||
| 13 | 0.500 | 2.776 | 88.462 | ||||||||
| 14 | 0.483 | 2.683 | 91.145 | ||||||||
| 15 | 0.442 | 2.454 | 93.600 | ||||||||
| 16 | 0.432 | 2.401 | 96.001 | ||||||||
| 17 | 0.307 | 1.704 | 100.000 | ||||||||
由表5可知,17个变量指标转化为了6个主成分,这些主成分满足特征根大于等于1的条件,且累积贡献率达到60.91%,表明主成分对变量有一定的解释能力。为了使因子荷载的结构更简明化,通过最大方差法进行因子旋转,集中荷载于少数因子之上,从而降低其他公共因子中的载荷,使因子间荷载的差异更分明。表6为将因子实行最大方差旋转后的载荷矩阵。
表6 正交旋转后的载荷矩阵
Tab. 6 Rotation sums of squared loadings
| Zscore | 成份 | |||||
|---|---|---|---|---|---|---|
| 1 | 2 | 3 | 4 | 5 | 6 | |
| 年龄 | -0.060 | -0.040 | 0.832 | -0.025 | -0.068 | 0.179 |
| 性别 | -0.060 | 0.058 | -0.521 | 0.033 | -0.282 | 0.302 |
| 收入 | 0.000 | 0.150 | 0.674 | -0.116 | 0.357 | 0.061 |
| 出行方式 | 0.003 | -0.008 | -0.260 | 0.083 | -0.717 | 0.101 |
| 价格定位 | 0.166 | 0.033 | -0.058 | 0.717 | -0.195 | 0.007 |
| 品牌多样性 | 0.192 | 0.348 | -0.060 | 0.644 | 0.062 | -0.160 |
| 促销活动 | 0.000 | -0.062 | -0.029 | 0.711 | 0.118 | 0.243 |
| 娱乐设施 | 0.156 | 0.577 | -0.192 | 0.311 | 0.289 | 0.127 |
| 餐饮 | -0.051 | 0.726 | -0.208 | 0.015 | 0.293 | 0.091 |
| 生活超市 | 0.099 | 0.099 | 0.002 | 0.032 | -0.160 | 0.755 |
| 儿童教育 | 0.237 | -0.032 | 0.077 | 0.081 | 0.283 | 0.675 |
| 商场内氛围 | 0.816 | 0.221 | 0.030 | 0.109 | 0.043 | 0.089 |
| 商场设施 | 0.798 | 0.180 | 0.064 | 0.115 | 0.008 | 0.095 |
| 商场外环境 | 0.803 | 0.132 | -0.037 | 0.066 | 0.010 | 0.091 |
| 停车场 | 0.330 | 0.092 | 0.111 | 0.126 | 0.539 | 0.374 |
| 出行距离 | 0.175 | 0.559 | 0.158 | 0.046 | -0.091 | 0.067 |
| 交通便捷度 | 0.234 | 0.701 | 0.159 | -0.008 | -0.233 | -0.111 |
因子载荷矩阵表明了不同测项对各因子的贡献。载荷值一般需在0.5以上,且越高聚合效果越好。从表6中各因子的高载荷可见,在第1因子上,商场内氛围、商场设施及商场室外环境有高载荷,因此将第一因子命名为环境因子。环境因子所包含的商场内氛围、商场设施及商场外环境等因素对顾客的购物体验和价值感知有很大的影响,说明人们到购物中心不再是简单的购物,更多的是需要集多功能消费服务于一体的一站式服务。第2因子涉及出行距离、交通便捷度,且还有娱乐设施与餐饮,反映了到达购物中心服务的可达性,命名为可达性因子。在第3因子中,年龄、性别、收入均为顾客人口描述性信息,命名为个人特征因子。第4因子主要反映了价格定位、品牌多样性和促销活动,称其为商品因子。第5因子包含交通出行方式和停车场2个变量,与第2因子的出行距离和交通便捷性相比,更侧重私家车出行,因此命名为私家车出行因子。在第6因子中,有生活超市和儿童教育两个变量,属于购物中心的多功能因素,命名为多功能 因子。
基于上述分析,本文确定了6个对顾客选择购物中心产生作用的影响因子,分别是环境因子、可达性因子、个人特征因子、商品因子、私家车出行因子,以及多功能因子。其中,可达性因子和私家车出行因子涉及了购物中心所处的地理位置、周围交通是否便利以及是否配备停车场、停车场的布局规划是否合理或停车位是否够用等问题,这些因素间都有一定的关联[5]。如果购物中心位于郊区可能会导致周围交通不便、客源量较小,而购物中心位于市区中心可能交通十分便利,但占地面积的局限性也可能导致停车场较小或布局不合理等问题。
为进一步定量分析以上6个因子对购物中心的吸引力,本文以以上6个因子作为新的变量与因变量,首先使用偏最小二乘回归解释商圈吸引力,结果显示偏最小二乘模型回归模型拟合显著(P<0.05),但是R2仅为0.321,模型解释力较低。因此,研究提出使用主成分回归的方法,对商圈吸引力进行建模表达。东门、华强北、Cocopark、太古城和海雅缤纷城的预测正确率分别为86.0%、41.2%、60.1%、21.8%和72.4%,平均达到60.2%。太古城之所以只有20%多的正确率是因为这是个新开业的商场,调查时商铺还未营业或在调整中,未形成稳定的商圈吸引力。由于在调查受时间、费用、人力等客观条件的限制,样本数量的局限可能导致数据的代表性不够全面,也是造成误差存在的原因之一。
与普通Logistic回归的结果相比(表7),主成分Logistic回归仍然有好的表现。从似然比检验的-2倍对数似然值(-2LL)来看,主成分Logistic回归的变异性较小,即主成分Logistic模型中包括所有自变量后的误差较小。主成分Logistic回归的Cox & Snell R2和Nagelkerke R2 2项指标都较普通Logistic回归高,说明前者自变量对因变量的解释作用更强。最后,从预测百分比校正值来看,主成分Logistic回归的判别准确率达到60%以上。总体来说,主成分Logistic回归的表现优于普通Logistic回归和偏最小二乘回归。
表7 模型拟合优度及预测效果的比较
Tab. 7 Comparison of goodness-of-fit and prediction results
| 模型 | -2LL | Cox 和 Snell R2 | Nagelkerke R2 | 预测百分比 校正/(%) |
|---|---|---|---|---|
| 普通Logistic回归 | 1157.276 | 0.590 | 0.617 | 53.60% |
| 主成分Logistic回归 | 1007.432 | 0.694 | 0.726 | 60.20% |
表8 吸引力显著性因子
Tab. 8 Significant factors
| 显著影响因素 | |
|---|---|
| 东门 | 可达性因子、环境因子、私家车出行因子 |
| 华强北 | 商品因子、环境因子、可达性因子 |
| Cocopark | 多功能因子,私家车出行因子、可达性因子 |
| 太古城 | 可达性因子、商品因子、私家车出行因子 |
| 海雅缤纷城 | 商品因子、多功能因子 |
为检验主成分Logistic回归表达商圈吸引力的可靠性,以太古城为参照系,对其他4个购物中心的样本数据进行回归分析。计算过程同上,鉴于篇幅的限制,具体计算数值不再罗列。结果显示似然比卡方检验结果显著水平小于0.05,说明回归模型显著;-2LL为1057.211,仍小于普通Logistic回归,Cox & Snell R2和Nagelkerke R2分别为0.663、0.693,模型总体表现仍优于普通Logistic, 且2次模型回归系数重合率达66.67%。基于以上的对比验证,可认为本文基于主成分Logistic回归的商圈吸引力模型具有一定的可靠性。表8列出了5个商圈影响吸引力的显著性因子。
以上结果不仅可代入Huff模型估计各商圈的吸引力,还可用于分析各商圈的优势和存在的问题。例如,完善的配套设施和四通八达的交通是东门商业区吸引顾客的主要因素,但从2次回归方程中环境因子和停车场因素相对于其他购物中心的效用函数来看,其回归系数均为负值,故东门在改善环境和停车场的配置方面还有一定的提升空间,这和实际情况相符。华强北作为中国最大的电子市场,商品的多样性以及较高的性价比毫无疑问是其最主要的商圈吸引力因素,但是由于该商业区现有的楼盘物资大多是在原有的工业厂房上改造而成的,加上片区道路、市政规划和公共设施均是原有设计和布局,因此带来的购物过于集中、空间较密集和停车场地布置不合理等问题亟待解决,其环境因子和停车场因素的回归系数同样为负值。
本文在分析已有相关研究的基础上,对影响购物中心的吸引力因素进行总结并设计调查问卷,以深圳市5个典型的购物中心和商圈为研究对象,获取问卷数据。由于问卷数据具有共线性,研究使用因子分析的方法,识别出6个对顾客选择购物中心产生作用的影响因子,分别是环境因子、可达性因子、个人特征因子、商品因子、私家车出行因子,以及多功能因子,提出基于主成分Logistic模型表达商圈吸引力,得出各购物中心或商圈中不同因子的权重。以上结果可以作为Huff模型中吸引力因子的输入,取代传统的以“规模”代表吸引力的建模方法,从而更准确地表达和预测购物中心等设施的影响范围,为精细化建模提供基础。此外,随着大数据在地学领域的深入应用,此问卷调查类数据及结论可以作为大数据应用的校准基础。未来可以结合用户轨迹数据、社交媒体签到数据等进行更大规模的分析和应用。
The authors have declared that no competing interests exist.
| [1] |
et al. Exploratory calibration of a spatial interaction model using taxi GPS trajectories [J].https://doi.org/10.1016/j.compenvurbsys.2011.09.002 URL 摘要
Model calibration is the cornerstone of spatial interaction models in many geographic, transportation and marketing analysis. Conventional questionnaire approaches that collect data for model calibration are both labor-intensive and time-consuming, and generally show a poor response rate. This study takes advantage of increasingly available vehicle GPS trajectory data to conduct spatial interaction model calibration. A Huff model for retail trading area analysis was used as an example. Model calibration and parameter validation were conducted based on over 63,000 taxi GPS trajectories for seven major shopping centers in Wuhan, a large city in China. The results were positive and in general showed satisfactory descriptive and predictive capability. This study demonstrated the feasibility of using the emerging technology to calibrate spatial interaction models (and also showed the potential for use in other related studies). The main advantage of using these new data sources is that they allow efficient use of increasingly available positioning data, which is easier to collect than conventional customer surveys, and usually with larger data sizes. It also allows inferences to be made about distance-decay rates based on accurate computation of travel time and distance. This could save both time and expense in many related areas of research, while achieving high quality model calibration results.
|
| [2] |
Evaluating and re-demarcating the Hospital Service Areas in Florida [J].https://doi.org/10.1016/j.apgeog.2014.10.008 URL 摘要
The Hospital Service Areas (HSAs) better portray underlying local patterns of hospitalization than administrative units, and offer a promising analysis unit for studies of healthcare market. The widely used Dartmouth HSAs in the U.S. were solely based on Medicare inpatient records about two decades ago. Our analysis used all discharge records from Florida hospitals in the 2011 Healthcare Cost and Utilization Project (HCUP) dataset from the Agency for Healthcare Research and Quality (AHRQ). We first matched Medicare-paid hospitalization records in 2011 to the Dartmouth HSAs for demonstrating the temporal variation of the Medicare-derived HSAs. We then compared the HSA configurations based on the overall hospitalization records to Medicare-derived HSAs in the same year (2011) for assessing the representativeness of the Medicare-derived HSAs. Results indicate the boundaries of the Medicare-derived HSAs have significantly shifted over two decades and are inadequate in representing the overall population. The Huff model was used to generate more solid HSAs than traditional approaches.
|
| [3] |
A retail market potential model [J].https://doi.org/10.1080/01944366508978155 URL 摘要
The authors explore possible equilibrium distributions for large retail trade center's in the Baltimore metropolitan area. Possible sites for centers are selected on general planning grounds and tested for feasibility and “balance.” Balance is determined in terms of the volume of business attracted by each center in relation to its size. By repeated trials, it is established that there exists a balanced distribution in which the size of centers is related to their drawing power, which in turn depends on the distribution of purchasing power projected for the area and the transportation facilities and for trip-makers. This land use model is intimately related to transportation models, by The balanced distribution of retail outlets turns out to be the minimum cost pattern for trip-makers. This land use model is intimately related to transportation models, by way of network tracing and a gravity model trip distribution theory. It represents a departure from some of the restrictions of central place theory (as illustrated in the article by Berry in this issue).
|
| [4] |
et al. Evaluating trade areas Using social media data with a Calibrated Huff Model [J].URL 摘要
Delimitating trade areas is a major business concern. Today, mobile communication technologies make it possible to use social media data for this purpose. Few studies however, have focused on methods to extract suitable samples from social media data for trade area delimitation. In our case study, we divided Beijing into regular grid cells and extracted activity centers for each social media user. Ten sample sets were obtained by selecting users based on the retail agglomerations they visited and aggregating user activity centers to each grid cell. We calculated distance and visitation frequency attributes for each user and each grid cell. The distance value of a grid cell is the average distance of user activity centers in this grid cell to a retail agglomeration. The visitation frequency of a grid cell refers to the average count of visits to retail agglomerations by user activity centers for a cell. The calculated attribute values of 10 sets were input into a Huff model and the delimitated trade areas were evaluated. Results show that sets obtained by aggregating user activity centers have a better delimitating effect than sets obtained without aggregation. Differences in the distribution and intensity of trade areas also became apparent.
|
| [5] |
Total locational surplus for facility users distributed continuously along a network [J].https://doi.org/10.1080/13658816.2014.895369 URL Magsci 摘要
This paper proposes an appropriate index for evaluating the degree to which facilities are desirable to their users under realistic assumptions. We derive an analytical expression for the index and discuss its calculation. Throughout this paper, we make the following three assumptions: (1) the distance from a user to a facility is measured by the shortest path, (2) facility users are continuously distributed along a network, and (3) the choice behavior of the facility users follows the Huff model. Under the third assumption, the index, called the 鈥榯otal locational surplus,鈥 enables us to conduct evaluations based on the concept of consumer surplus in microeconomics. We argue that this index is considered the most reliable among possible indices. First, we express the total locational surplus under our three assumptions as a definite integral. We then express a part of the integrand in the definite integral as an infinite series of exponential functions, which allows us to derive the infinite series expression of the definite integral. The infinite series expression enables us to calculate an approximate value for the total locational surplus using the first several terms of the series. We describe the computational procedure for calculating this approximation and evaluate its time complexity. We also utilize the procedure to evaluate the spatial configuration of some shopping centers in the northern part of Japan.
|
| [6] |
|
| [7] |
A structural equation modeling approaches on factors of shopping mall attractiveness that influence consumer decision-making in choosing a shopping mall [J].URL 摘要
The article discusses a study which examines the factors that influence consumer decision-making in choosing a shopping mall in Asian countries. It reveals the most influential factors in choosing a shopping mall which are design, entertainment, variety and mall essence. Other factors identified are tenant diversity and the mall's physical environment.
|
| [8] |
Mall atmospherics: the interaction effects of the mall environment on shopping behavior [J].https://doi.org/10.1016/j.jbusres.2003.07.004 URL 摘要
No abstract is available for this item.
|
| [9] |
Shopping-centre selection modelling: a segmentation approach [J]. |
| [10] |
零售商圈的吸引力分析 [J].https://doi.org/10.3969/j.issn.1001-148X.2004.24.042 URL 摘要
商圈是由顾客选择商店的行为形成的,常用于商圈分析的吸引力模型,主要有赖利法则和哈夫模型,他们从该商场的销售面积和消费者到该商场的距离来确定商圈的大小,他们假设所有零售店商品同质同价.现引入价格因素重新对零售引力进行分析.
The analysis of attraction of retailing business circle [J]https://doi.org/10.3969/j.issn.1001-148X.2004.24.042 URL 摘要
商圈是由顾客选择商店的行为形成的,常用于商圈分析的吸引力模型,主要有赖利法则和哈夫模型,他们从该商场的销售面积和消费者到该商场的距离来确定商圈的大小,他们假设所有零售店商品同质同价.现引入价格因素重新对零售引力进行分析.
|
| [11] |
零售商圈吸引力:基于雷利法则和赫夫模型的实证研究 [J].URL 摘要
本文在对商圈理论进行回顾和梳理的基础上,以消费者为主要着眼点,从一个比较微观的角度出发,对零售商圈吸引力进行了实证研究,试图探明影响商圈吸引力的主要因素。实证结果表明,作为“传统”商圈吸引力因素的营业面积在本研究中并未被证明为显著性因素,取而代之的是商品种类;而在商圈研究中讨论极少的店内环境在结论中被证明为显著性因素。本文还对作为赫夫模型延伸的布莱克模型进行了实证验证,表明布莱克模型具有实践应用价值,进而本文对其实践应用的方法进行了探讨。
An empirical research on attraction of retail trade area based on reilly rule and huff model [J].URL 摘要
本文在对商圈理论进行回顾和梳理的基础上,以消费者为主要着眼点,从一个比较微观的角度出发,对零售商圈吸引力进行了实证研究,试图探明影响商圈吸引力的主要因素。实证结果表明,作为“传统”商圈吸引力因素的营业面积在本研究中并未被证明为显著性因素,取而代之的是商品种类;而在商圈研究中讨论极少的店内环境在结论中被证明为显著性因素。本文还对作为赫夫模型延伸的布莱克模型进行了实证验证,表明布莱克模型具有实践应用价值,进而本文对其实践应用的方法进行了探讨。
|
| [12] |
|
| [13] |
|
| [14] |
Conceptual and operational problems with market share models of consumer spatial behavior [J].URL 摘要
Luce's choice axiom provides the theoretical foundation for most models of consumer spatial behavior. However, empirical applications indicate that the conceptual pro- perties of the axiom are not well understood. This paper reviews these properties in terms of choice behavior in a spatial context. A recent development in parameter estimation for market-share models is also discussed. Finally, suggestions for needed research are listed.
|
| [15] |
购物中心顾客波及惠顾研究[D] .
Research on customers’ spillover patronage in a shopping mall[D].
|
| [16] |
A technique for the measurement of attitudes [J].URL 摘要
The project conceived in 1929 by Gardner Murphy and the writer aimed first to present a wide array of problems having to do with five major "attitude areas"鈥攊nternational relations, race relations, economic conflict, political conflict, and religion. The kind of questionnaire material falls into four classes: yes-no, multiple choice, propositions to be responded to by degrees of approval, and a series of brief newspaper narratives to be approved or disapproved in various degrees. The monograph aims to describe a technique rather than to give results. The appendix, covering ten pages, shows the method of constructing an attitude scale. A bibliography is also given. (PsycINFO Database Record (c) 2012 APA, all rights reserved)
|
| [17] |
Fundamental statistics in psychology and education [M].
|
| [18] |
因子分析统计检验体系的探讨 [J].https://doi.org/10.3969/j.issn.1002-4565.2007.06.017 URL 摘要
为了更好地应用因子分析,论文提出建立因子分析统计检验体系,包括因子分析适用性的统计检验以及提取公共因子数目多少的检验,并对如何进行上述检验进行探讨,论文最后还提出了应用因子分析时应注意的其他问题.
Exploring the statistical test system of factor analysis. https://doi.org/10.3969/j.issn.1002-4565.2007.06.017 URL 摘要
为了更好地应用因子分析,论文提出建立因子分析统计检验体系,包括因子分析适用性的统计检验以及提取公共因子数目多少的检验,并对如何进行上述检验进行探讨,论文最后还提出了应用因子分析时应注意的其他问题.
|

/
| 〈 |
|
〉 |