低空遥感无人机影像反演河道流量
赵长森1,2,潘旭1,3,杨胜天1,2( ),刘昌明1,陈新4,张含明5,潘天力2
),刘昌明1,陈新4,张含明5,潘天力2
Measuring streamflow with low-altitude UAV imagery
ZHAO Changsen1,2,PAN Xu1,3,YANG Shengtian1,2(),LIU Changming1,CHEN Xin4,ZHANG Hanming5,PAN Tianli2
),LIU Changming1,CHEN Xin4,ZHANG Hanming5,PAN Tianli2
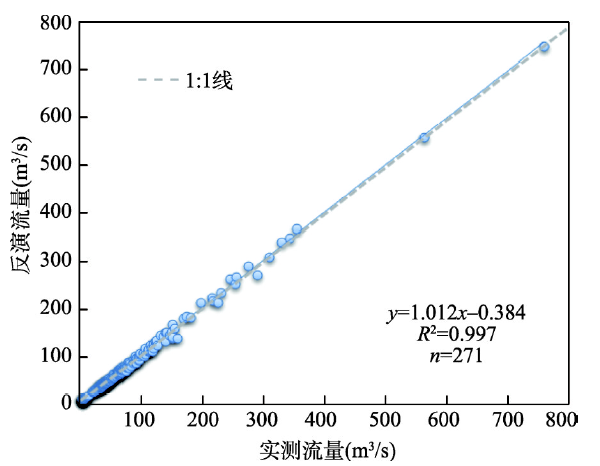
图5. 研究区三流域反演与实测流量关系图
Fig. 5. Retrieved and measured stream flows in the three basins of the study area (Gray dotted line slope is 1)