赵映慧 , 项亚楠
, 项亚楠
ZHAO Yinghui, XIANG Yanan
通讯作者:
收稿日期: 2016-12-6
修回日期: 2017-03-15
网络出版日期: 2017-08-07
版权声明: 2017 《地理学报》编辑部 本文是开放获取期刊文献,在以下情况下可以自由使用:学术研究、学术交流、科研教学等,但不允许用于商业目的.
基金资助:
作者简介:
作者简介:赵映慧(1976-), 男, 四川广元人, 博士, 副教授, 硕士生导师, 主要研究方向为城市、农村区域环境变化研究。E-mail: zhaoyhneau@163.com
展开
摘要
中国是一个自然灾害频发的国家,研究其自然灾害演变特征及粮食灾损规律,对实现中国社会经济可持续发展、解决中国粮食安全问题具有重要意义。本文先基于Python语言编程获取1949-2015年中国31省市自然灾害造成的受灾、成灾、绝收面积,构建灾害强度指数分析不同灾种的时序特征分异,利用趋势分析、ESDA方法分析不同灾种在省域空间的分布特征及冷热区;再获取1949-2015年粮食种植数据,通过粮食灾损估算模型、定义粮食灾损率、地理空间探测器,计算并检验中国粮食损失时空特征及分异性。结果表明:① 相比受灾面积曲线,本文构建的灾害程度指数能够更好揭示自然灾害时序演变特征;② 1949-2015年期间中国两大主力灾害(洪灾、旱灾)交替出现,未来5~10年以洪灾为主;③ 灾种排序旱灾>洪灾>风雹>低温>台风,其中旱灾、洪灾受灾占比过半;④ 省域不同灾种间空间趋势变化特征明显,区域受灾面积东部>西部,北部>南部,且北部灾种单一、南部多灾并发;⑤ 自然灾害受灾总和、旱灾、雹灾、低温空间上全局自相关性不显著,呈随机模式分布,洪涝、台风在空间分布上具有显著的全局自相关性,呈集聚模式;⑥ 1949-2015年灾害、灾损量、灾损率整体时序趋势呈现先升后降,2000年为临界点,空间分布具有异质性,单因子解释力度差异显著,多因子交互均呈非线性增强关系,胡焕庸线两侧冷热点分布呈两极化且其重心向北迁移。建议政府加强除旱减雹(西北)、除旱排内涝(东北)、排涝防冻(中部)、排涝预台(东南沿海)等工程技术措施;同时西北(环境恶劣)、东北(中国粮仓)应作为防灾减灾重点保护区,制定专项保护方案,以保证中国粮食丰产增收。
关键词:
Abstract
Prone to natural disasters, China badly needs a research into its spatio-temporal distribution of natural disasters and the corresponding grain loss to improve grain security and achieve sustainable development. By means of Python Programming Language and on the basis of grain production loss over Chinese 31 provinces from 1949 to 2015, this paper first constructed disaster intensity index to analyze temporal features of different natural disasters, and with trend analysis as well as ESDA to analyze spatial characteristics in different provinces. Then the paper collected crop planting data to calculate and test the spatio-temporal characteristics in grain loss through estimation model on grain loss, defining grain loss rate and geodetector. The conclusions of paper are: (1) compared with the curve of disaster-affected areas, disaster intensity index constructed in this paper could better present temporal changes of natural disasters; (2) China alternately suffered from flood and drought between 1949 and 2015 and in the coming 5 to 10 years the main suffering would be flood; (3) the ranking of natural disasters is: drought>flood>low temperature >hail> typhoon, among which, the areas affected by drought and flood occupied more than half of the total; (4) natural disasters show clear spatial characteristics and the ranking of regional areas prone to disasters is: eastern region> western region; northern region > southern region. Generally speaking, northern region is prone to only one particular natural disaster while southern region tends to suffer from several natural disasters in the meantime; (5) the sum of natural disasters, drought, hail and low temperature, with their random distribution in space, presented unclear spatial autocorrelation, while flood and typhoon, with their clustering model in space distribution, showed clear spatial autocorrelation; (6) from 1949 to 2015, the general temporal changes of disasters, grain loss amount and loss rate showed a feature that the figures would rise first, and then dropped with the critical point in 2000. Meanwhile, they had significant heterogeneity in spatial distribution, great difference in single-factor explanation power, and multi-factor interaction showed a nonlinear enhancement relation. The distribution of hot and cold spots on both sides of the Hu Line presented a polarization pattern and the gravity center of grain loss gradually moved northward. Accordingly, this paper proposes that our government should adopt different precautionary measures in different regions of China: measures against drought and hail in Northwest China; measures against drought and waterlogging in Northeast China; measures against flood and low temperature in Central China; measures against waterlogging and typhoon in coastal areas of Southeast China. And our government should show more concern to and formulate feasible protection plans for hostile-environment Northwest China and high-grain-production Northeast China so that a good harvest in grains could be guaranteed.
Keywords:
自然灾害是当今学术界乃世界人民普遍面临的难题之一,其影响严重制约经济、社会的可持续发展,甚至威胁人类生存。20世80年代以来,国际社会高度关注自然灾害问题。1981年成立的国际风险协会主要从事灾害风险分析与评估、管理与对策研究;1987年,联合国确立“国际减轻自然灾害十年”(IDNDR),旨在最大限度降低灾害损失、唤起国际重视、推动各国和各地区做好防灾减灾措施;2009年确立每年“10月13日”为“国际减灾日”。中国幅员辽阔、地理环境复杂、气候波动大、生态稳定性差、灾害类型多、频次高、强度大,是世界上受自然灾害影响最为严重的国家之一[1]。2016年1-8月份,中国各类自然灾害直接造成1.37亿人受灾,1074人死亡,270人失踪,624万人次紧急转移安置,直接经济损失2983亿元。因此,探索中国境内灾情空间分布态势,揭示典型灾种、灾损的时空演变规律,为国家制订防灾减灾、备灾、救灾等规划提供理论依据,具有较强的现实意义。
“灾害无情,人有情”诠释了自然灾害摧残人类的恐怖无情、以及人类团结互助共同抵御自然灾害的坚强决心。为此学术界对自然灾害展开大量研究[2-5]。史培军等学者对自然灾害的理论与实践进行了讨论与探索,为后来系统研究自然灾害奠定了理论基础[6-7];其次,学者们对灾种的危险性程度进行评估[8-10]、不同历史阶段自然灾害的空间特征与格局进行分析[11-14]、孕灾环境与致灾因子分析[15-16]、不同灾种区域组合规律研究[17]、减灾救灾标准演变与评价[18]等方面都进行了不同程度的探索与深入。灾害理论方面研究集中体现致灾因子论、孕灾环境论、承灾体论、成灾机制、灾害学科体系的构建等方面的探索;灾害危险性程度评价由单一灾种评价[12](如:洪涝、干旱、泥石流)向混合灾种评价(如:区域综合灾害评价、气象灾害评价)过渡;自然灾害时空特征研究主要从公元前180-1949年、1990-2001年、2000-2011年等不同历史时期角度展开研究[19];关于自然灾害的区域组合规律研究,李炳元等[17]基于地学区划、灾害自身区划等原则,将中国划分3个一级区、12个二级区并进行宏观组合分析;减灾救灾标准演变与评价研究主要从减灾救灾标准现状与存在问题、区域差异、国内外完备性对比分析评价等方面进行研究[18];自然灾害对粮食安全的影响多集中在洪灾[20-21]、旱灾[21-22],多灾种交互影响研究较少,且多偏于定性研究。从当前研究来看,首先对不同历史时期的灾害研究集中在建国前及最近二十年研究;其次数据多采用经济、人口统计指标,鲜有基于不同程度受灾面积、粮食单产、种植面积、粮食总产等数据研究1949-2015年中国典型自然灾害组合规律及其对粮食生产的影响;最后,灾害、灾损时空特征研究多集中在空间局域异质性,对空间分层异质性研究欠缺。
本文基于计算机数据挖掘、GIS平台,利用Python语言编程获取自然灾害、粮食种植相关统计数据,为了规避单从某种面积分析导致结论的片面性,构建灾害强度指数(多种面积加权百分比)研究灾害时序变化特征,运用空间探索数据分析方法[23]研究不同灾种在各省域的空间分布特征及区域组合规律,透视不同灾害的时空分布差异;最后运用粮食灾损估算模型[22]、定义灾损率、地理空间探测器[24]等方法估算并检验粮食灾损变化时空规律及分异性,为中国建立有效的防灾减灾体系、农业粮食生产布局提供参考。
由于缺少历年港澳台自然灾害的统计数据,中国大陆31个省(直辖市、自治区)作为研究区,其底图数据采用国家基础地理信息中心(http://ngcc.sbsm.gov.cn)提供的中国1∶400万的矢量图。本研究主要分析大陆省域洪涝、旱灾、风雹、低温、台风5种常见的自然灾害的时空分异特征及对粮食灾损的影响;基础数据主要包括1949-2015年上述前4种常见灾害造成的受灾、成灾、绝收面积,2001-2015年台风造成的受灾、成灾、绝收面积,1949-2015年省市尺度上粮食种植面积、农作物种植面积、粮食单产、粮食总产等数据(缺失1967年、1968年和1969年3年数据)。灾害数据来源于国家农业部种植司官网的自然灾害数据库数据、《中国统计年鉴》、中国社会经济发展数据库;粮食相关数据来源于农业部农作物数据库。随着科技的进步,灾害监测能力逐渐增强,为了保证数据之间的可比性,本文假设研究期内同一统计口径的数据资料统计力度一致;为了保证分析结果的可靠性,通过检验不同统计数据的之间匹配性,平均匹配性高达96.34%。
(1)灾害强度指数(Q)
本文构建的灾害强度指数是指一种反应灾害强度大小的多面积加权百分数;农作物成灾面积即因灾害造成作物减产三成以上的播种面积,农作物绝收面积即因灾害造成作物减产七成以上的播种面积,分别赋权重0.3、0.7于成灾面积、绝收面积,故构建的灾害强度指数Q,公式如下:
式中:C为成灾面积(104 mu);J为绝收面积(104 mu);S为受灾面积(104 mu),1 mu = 666.67 m2;Q为灾害强度指数。
(2)趋势分析
趋势分析是一种GIS平台上数据的三维透视图的方法,其揭示了不同灾种受灾面积空间总体的变化趋势,适用于大尺度研究。本文将省域的位置绘制在x、y平面上,z维中的杆的高度代表省域受灾面积,其次将z值作为散点图投影到x、z平面和y、z平面上,最后本文根据投影平面上的散点图,采用二阶多项式拟合。
(3)空间特征
为了研究自然灾害、粮食灾损的空间特征,本文采用基于GIS平台的空间自相关[23, 25]、Getis-Ord Gi*[25]来判别不同类型灾害、灾损的空间分布模式及热点探索;同时采用自然间断法[26]对灾害数据进行非监督离散化,并采用地理空间探测器q统计量[24, 26]对灾损的分层异质性进行检验,主要公式如下:
式中:
(4)粮食灾损的估算模型
过去的相关研究中,国内学者提出了多个粮食灾损估算模型,但常用灾损估算模型是比重法,本文选用比重法估算粮食灾损量[25],公式如下:
式中:Sc为灾损量;n为省市数量;Sci为第i个省市的粮食灾损量;Ri为第i个省份粮食种植面积占农作物种植面积的比例;Ai1、Ai2、Ai3分别为轻灾、中灾和重灾的农作物面积;yi为该省市当年的粮食单产水平;P1、P2和P3分别为受灾、成灾和绝收粮食产量减产程度,详细解释参考文献[25]。灾损量Sc与当年粮食总产量的比值则定义为当年灾损率。
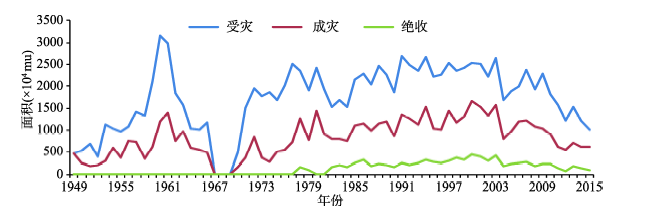
3.1.1 合计灾害时序变化特征 为揭示中国省市1949-2015年自然灾害时序特征,本文计算中国31省市的3种不同受灾强度的合计灾害平均线(图1)。根据自然灾害受灾、成灾的趋势线走势,本文将1949-2015年自然灾害时序特征大概分为3个阶段:1949-1970年为波动阶段,1970-2000年为波动上升阶段,2000-2015年为波动下降阶段;受灾面积、成灾面积趋势线除最高峰值不同步外,其整体趋势具有趋同性,整个合计受灾面积趋势线最高波峰位于1959-1961的三年自然灾害时期,而合计成灾面积最高波峰则位于1999-2002年之间;1970-2000年绝收面积趋势线整体呈现波动式上升,2000年达到峰值,2001-2015年趋势线开始波动下降。
图1 1949-2015年中国灾害合计面积变化曲线
Fig. 1 Variation curve of the overall disasters in China in 1949-2015
为了更好刻画1949-2015年中国受灾严重程度的变化,本文引入灾害强度指数Q,作出不同省域受灾强度Heatmap图、平均灾害强度指数图(图2)。结果显示:① 1949-1969年期间中国灾害强度指数呈波动下降趋势,1956年、1960年、1962年呈波动上浮态势(处于三年自然灾害时期前后),1951年、1953年、1958年显露波动下沉状态;② 1970-2000年期间中国灾害程度指数呈波动上升阶段,2000年左右达到峰值,1972年、1978年、1984年、1986年呈波动上浮趋势,历史上这些年份都发生了一定程度的旱灾、洪涝、台风等特大灾害;③ 2001-2010年中国灾害程度指数呈明显高频波动下降趋势,2003年、2006年、2008年呈上扬状态;④ 2010-2015年中国受灾面积呈相对减少趋势(图1),但受灾强度指数Q呈上升趋势,灾害强度指数能够更好地揭示自然灾害真实的演变特征。
图2 1949-2015年中国不同省份灾害程度指数
Fig. 2 Intensity index of the overall disasters in China in 1949-2015
3.1.2 不同灾种的时序变化特征研究 为了明晰1949-2015年不同灾种的时序变化特征,分别做不同灾种的平均受灾面积、灾害强度指数图,通过比较分析不同曲线的异常点、走势、拐点,研究了不同灾种的时序变异特性。
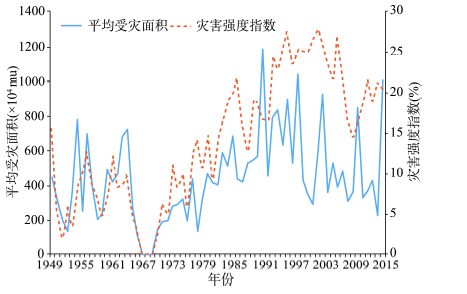
(1)洪涝灾害时序特征分析 洪涝受灾面积与灾害程度时间序列上呈现一定程度的异步性,且灾害强度更加明显地刻画了洪涝的演变特征。通过分析平均受灾面积曲线,1949-1968年洪涝受灾处于高频波动阶段,1969-1991年洪涝受灾呈现波动上升态势,1992-2015年平均受灾面积表现出高频波动下降趋势,其中1991年平均受灾面积达到峰值。1949-2015年灾害强度指数曲线表明,1949-1968年洪涝灾害程度指数波动下降,1969-2002年灾害程度指数呈波动上升走势,洪灾受灾强度不断增强,2002年达到灾害强度峰值,2003-2009年灾害程度指数波动下降,2010-2015年平均受灾面积逐渐较少,但是灾害严重程度指数呈波动上升趋势(图3)。
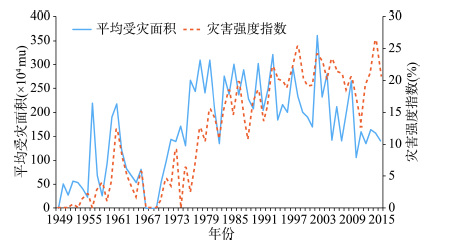
(2)旱灾时序特征分析 旱灾受灾面积与灾害程度指数长时序性具有较强的同步性。旱灾受灾面积与灾害程度指数在1949-1961年、1969-2000年呈波动上升趋势,1962-1968年、2001-2015年呈现波动下降趋势;1959-1961年三年旱灾形成一个小波峰,2000年全国旱灾受灾面积与旱灾程度指数达到最大值(图4)。
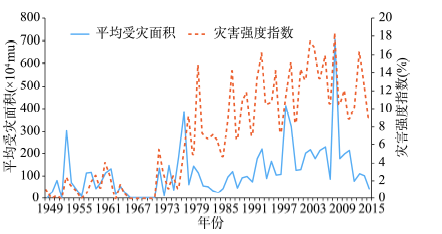
(3)风雹灾害时序特征分析 1949-2015年全国平均受灾面积呈高频小幅波动趋势,风雹灾害程度指数显现出高频波动上升趋势,2014年风雹灾害程度指数达到最大值。1967-2002年灾害程度指数增加速度逐渐放缓,波动频率加大,呈对数函数曲线形式;2000-2015年灾害程度指数呈现线性递增趋势(图5)。
(4)低温(冷冻)灾害时序特征分析 1949-2015年全国低温受灾面积和低温灾害程度指数呈微弱的上升趋势,但4个年份(1953年、1977年、1998年、2008年)低温受灾明显,2008年全国低温受灾面积达到峰值。受灾异常年份1953年、1977年、1998年、2008年期间分别相差24年、21年、10年,表明异常低温受灾周期逐渐缩短,异常低温灾害频发的态势初露端倪(图6)。
图6 1949-2015年中国低温灾害趋势
Fig. 6 Trend of low temperature disaster in China in 1949-2015
(5)台风灾害时序特征分析 2001-2015年台风灾害受灾面积和灾害程度指数呈波动趋势,具有同步性。2005年、2012年中国台风受灾严重,期间相距8年;2001-2004年全国台风受灾微弱,波动较小,2010年全国台风受灾面积、受灾程度指数都达到最小值,2010-2015年全国台风灾害程度指数逐渐递增(图7)。
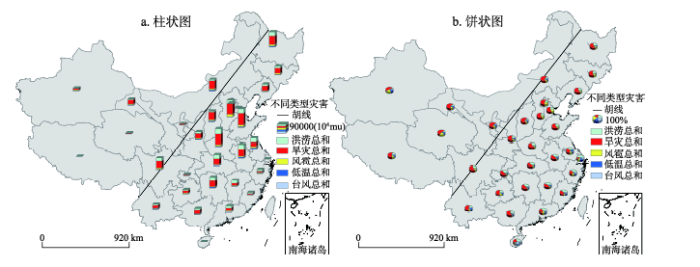
3.2.1 灾害省域空间分布特征 (1)省域空间灾害面积特征 为刻画1949-2015年不同灾种累积受灾面积在省市空间的数量分布状况,计算并统计不同省市不同灾种的累积受灾面积,同时绘制不同灾种受灾面积总和的堆叠图和饼状图(图8),通过可视化更直观的反映省域空间不同灾种受灾面积总和的数量空间分布特征。结果显示:① 全国省域累积受灾面积分布呈“北重南轻、中东部重西部轻”格局,灾种分布由北—南、西—东逐渐复杂,南涝北旱,且东南部呈现“多灾并发”特征;② 河北、山东、河南、黑龙江4个省份堆叠图最高,表明其累积受灾面积数量最大,且都以旱灾受灾为主,洪涝、风雹受灾次之,相比之下,低温、台风受灾面积略显微不足道;③ 北京、天津、重庆、西藏、青海、宁夏、上海7个省市堆叠图较低,说明其受灾面积总和数量较少,但其灾种区域分布特征明显,北京、天津受灾面积主要由旱灾、洪涝、风雹共同造成,重庆、西藏、青海、宁夏主要受旱灾、洪涝、低温、风雹影响,上海主要洪涝为主,其他灾种差异不明显。
图8 1949-2015年中国自然灾害省域受灾面积
Fig. 8 The affected area of natural disasters in China by province from 1949 to 2015
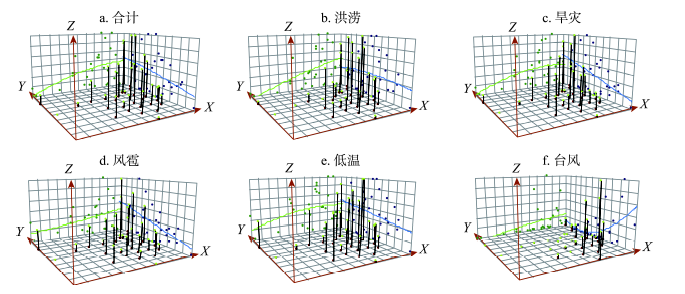
(2)不同灾种省域空间趋势变化 采用趋势分析法,以正东和正北方向为X和Y轴,以不同灾种省域空间累积受灾面积为Z轴,制作三维透视图,更好揭示中国不同灾种累积受灾面积在空间上的变化趋势特征(图9)。结果表明:① 自然灾害累积受灾面积总和空间分布趋势上,东西方向由西—东呈幂函数递增趋势,南北方向上呈“南—北线性递增”趋势;② 洪涝灾害空间分布趋势上,东西方向上由东—西呈抛物线曲线递减,西部洪涝受灾不显著,南北方向上呈“中部>南部>北部”,递减趋势平缓;③ 旱灾累积受灾面积空间分布趋势上,东西方向上“东部=中部>西部”,递减趋势微弱,南北方向上“中部>北部>南部”,南部鲜受旱灾影响,递减趋势明显;④ 风雹灾害累积受灾面积空间分布上,东西方向上由西—东呈指数函数曲线递增,中部—东部递增明显,南北方向上“北部>中部>南部”,呈线性递减趋势,递减趋势显著;⑤ 低温灾害累积受灾面积空间分布上,东西方向上“中部低东西高”,但差异不显著,南北方向上“中部>北部>南部”,南北差异显著,中部—南部递减趋势显著;⑥ 台风灾害累积受灾面积空间分布上,东西方向上由东—西呈递减趋势,整体受灾影响较小,递减趋势微弱,南北方向上由北—南呈指数函数曲线递增,递增显著,南北差异明显。
图9 中国自然灾害受灾面积全局趋势分析
Fig. 9 Overall trends of natural disasters affected area in China
(3)自然灾害全局空间相关性分析 空间自相关系受地理单元粒度大小与分区方法有关,根据陈江平等[23, 25]认为MAUP 效应对空间自相关的影响与权重矩阵的选择有关,县尺度上的自相关系数可能更可靠,但整体趋势一样,差异不大;由于目前本文能够获取省域尺度上最全的统计数据,虽然结果上有些偏差,但仍可以反映不同灾害空间集聚特征,故本文选用省域尺度上的统计数据进行空间集聚特征研究。
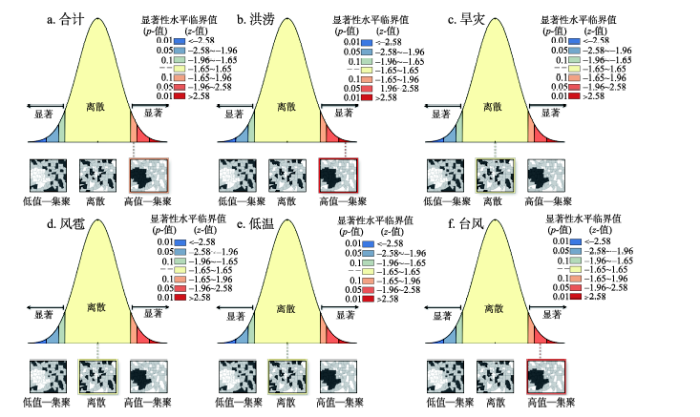
为了更全面反映中国省域不同灾种空间分布差异与格局分布特征,本文引用G统计量分析了不同灾种省域空间分布的集聚性特征。自然灾害受灾面积总和的全局G统计量值为0.075268(P<0.1),表明中国自然灾害发生在省域空间具有90%显著水平的空间集聚特征,呈空间正相关;洪涝、台风灾害的G统计量值分别为0.089017(P<0.01)、0.109471(P<0.05),反映出洪涝、台风在省域空间分布上分别有99%、95%显著水平的空间集聚特性;旱灾、风雹、低温灾害的G统计量值分别为0.072803(P>0.1)、0.067230(P>0.1)、0.068274(P>0.1),表明旱灾、风雹、低温空间分布呈现随机分布特征,集聚特性不显著(图10)。
图10 中国自然灾害的空间相关性分析
Fig. 10 Global autocorrelation index of natural disaster in China
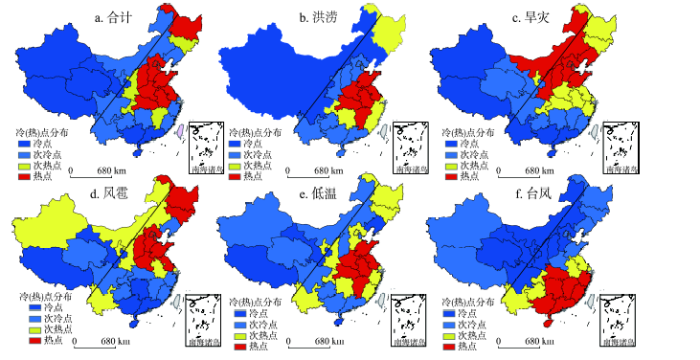
(4)灾害空间分布热点分析 利用空间优化热点分析工具将中国不同灾种的省域空间受灾区的聚类格局划分为冷点区、次冷区、次热区、热点区(图11)与胡焕庸线叠加分析。中国自然灾害空间冷热区分布具有一定地带性特征,除旱灾、雹灾外其他灾种的冷区、次冷区主要集中分布在胡焕庸线西侧,热区、次热区聚集在胡焕庸线东侧,其中大陆31个省及直辖市中多种灾害受灾面积总和、洪涝、旱灾、风雹、低温、台风的冷点、次冷点、次热点、热点区的数量比分别为:7∶10∶4∶10、8∶10∶7∶6、6∶7∶10∶8、4∶8∶13∶6、6∶9∶7∶9、8∶9∶6∶8。自然灾害受灾面积总和的热点区主要分布在华北、华东的大部分地区及黑龙江省,次热点分布在陕西、重庆、江西、吉林省份,次冷点主要分布在内蒙古、辽宁、宁夏、及西南、华东部分地区,冷点区主要分布在华南、西北大部分地区及西藏自治区;洪涝灾害的热点区主要分布在长江中下游地区,次热点主要分布在重庆、湖南、上海、浙江 、福建、黑龙江、吉林省份,次冷点主要分布在华北、华南、西南大部分地区,冷点主要分布在内蒙古、辽宁及西北、西南部分地区;旱灾的热点区主要分布在华北、西北的部分地区,次热点分布在长江中下地区及东北地区,次冷区主要分布在福建、湖南、江西、重庆、四川、青海省份,冷点主要分布在新疆及西南、华南地区;风雹灾害热点区主要分布在山东、江苏、江西及华中地区,次热点主要分布在华北、华东、东北、西南等部分地区,次冷点分布在内蒙古及西北地区,冷点分布在西藏、辽宁省份;低温灾害的热点区主要分布在华北、华中及东北地区,次热点发生在云南及西北地区,次冷点主要发生在西南、华东地区,冷点集中分布在西藏、华南地区;台风热点区集中在华东部分地区及华南地区,次热点集中在西南、华东部分地区,次冷点、冷点集中分布在内陆地区,不断递进。
图11 1949-2015年中国自然灾害空间分布
Fig. 11 Spatial pattern of natural disasters in China from 1949 to 2015
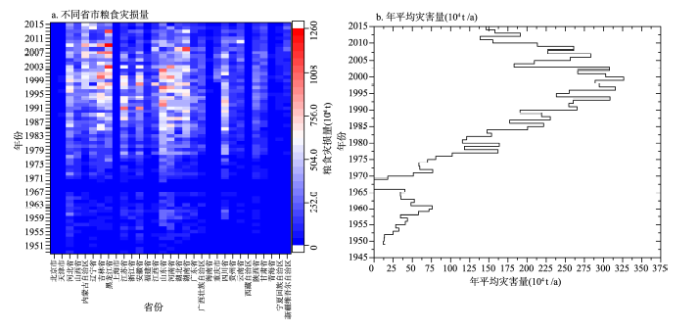
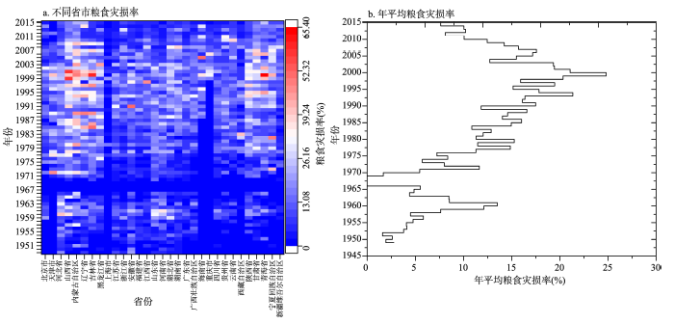
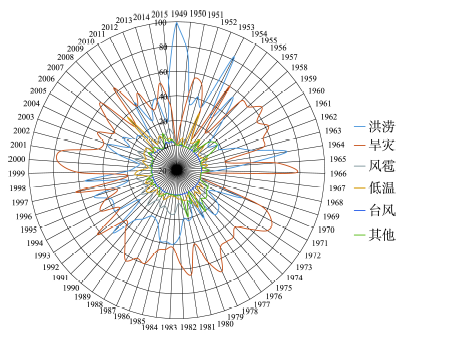
3.3.1 自然灾害对粮食生产的影响 为了分析1949-2015年中国自然灾害对粮食产量的影响,运用粮食灾损估算模型分别评估中国31个省市不同灾害对粮食产量的影响,并做不同省市的粮食灾损量、灾损率变化图(图12,图13)、不同灾种影响占比变化雷达图(图14)。结果表明:比较图12、图13可知,1949-2015年自然灾害对粮食影响时序特征大概分为3个阶段:1949-1970年、1970-2000年、2000-2015年。1949-1970年间,除1959-1961年3年左右时间具有较大的粮食损失量、损失率外,中国年均粮食灾损变化不大,稳定在较低水平;1970-2000年中国年均粮食灾损呈线性递增趋势,增幅明显;2000年中国省市平均粮食灾损量、灾损率均达到最大值(3.30×10⁶ t、24.8%),2001-2015年中国平均粮食灾损量呈波动下降态势。同时,1949-2015年中国单年灾损率大于50%的省市有吉林(2次)、山西(2次)、安徽(1次)、青海(1次)、海南(1次),时间多发生在2000年左右,2000年青海灾损率达到全国最大值65.3%。1949-2015年中国不同灾种对粮食生产影响比重排序为旱灾灾损量>洪灾灾损量>风雹灾损量>低温灾损量>其他灾损量>台风灾损量。1949-2015年间中国共有6年洪灾灾损量占总灾损量大于50%,1949-1966年、1991-1998年、2010-2015年为洪灾频发的几个阶段;除1960年左右3年时间中国受干旱影响较大外,1949-1966年中国的粮食损失主要由洪灾造成,其中1949年、1950年、1954年、1964年洪灾灾损均占到总灾损70%以上,1949年洪灾灾损占比最大(99.36%),1998年洪灾对农业生产最为严重,中国洪灾粮食灾损量高达4.9×10⁷ t;同时,1949-2015年间中国共有36年旱灾灾损量占总灾损量超过50%,1970-1990年、1999-2009年为旱灾频发的两个阶段,2000年旱灾最为严重,最大占比为76.47%;历年来中国风雹灾损占比最大值为1990年16.90%,2008年低温占比历年最大(38.63%)。
图12 1949-2015年中国省市粮食灾损量
Fig. 12 Changes of grain disaster loss amount by province in China in 1949-2015
图13 1949-2015年中国省份粮食灾损率变化
Fig. 13 Changes of grain disaster loss rate in China by province in 1949-2015
图14 1949-2015年中国不同灾损占比变化(%)
Fig. 14 Variation of different disaster loss in China from 1949 to 2015 (%)
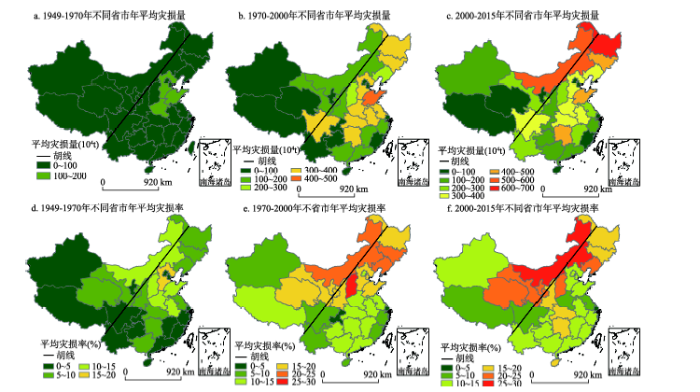
3.3.2 粮食灾损空间特征 为了分析灾损空间分布特征,通过计算不同阶段自然灾害对中国粮食生产的年平均灾损量、灾损率,进行空间可视化分析(图15)。基于前文自然灾害对粮食产量影响时序特征分析可知,时序特征大概分为3个阶段:1949-1970年、1970-2000年、2000-2015年,故分别计算不同阶段31省市的年均灾损量、灾损率。结果显示:1949-1970年河北、山东、河南省份的年均灾损量比较大,其他省市年均灾损量相对较小,华北地区省份的年均灾损率较大,此阶段华北地区受灾相对较为严重,年均灾损率均达到10%~15%之间;相比1949-1970年这一阶段,1970-2000年中国省市年均灾损量、灾损率都呈现出大幅度提升,且受灾重心逐渐开始向北方移动,山西、内蒙、辽宁、吉林等省份受灾较为严重,年均灾损率均达到20%~25%;相比前两阶段,2000-2015年的年均灾损量、灾损率略微上升,中国粮食受灾重心大体向西北移动,西北地区的粮食年均灾损率均达到22%~30%,而京津冀地区的年均粮食灾损率下降,仅在10%~13%之间,且最近十几年南方地区的湖南、湖北粮食受灾比较明显;不同地区之间粮食灾损差异较大,华中、华北部分地区、西北、东北地区的年平均粮食灾损量、灾损率明显大于京津冀地区、上海、广州、西南地区的年平均值;不同省份之间粮食灾损差异特征明显,1949-1970年河北省粮食灾损最为严重,1970-2000年山东省粮食受自然灾害影响明显,2000-2015年黑龙江、内蒙古粮食灾损最为严重,2000-2015年黑龙江省平均灾损量(6.41×106 t)大于2015年宁夏(3.73×10⁶ t)、西藏(1.01×10⁶ t)与青海(1.03×10⁶ t)粮食总产量之和。综上,1949-2015年31省市粮食的最大年均灾损量、灾损率由1.30×10⁶ t增到6.41×10⁶ t、由15.97%到28.95%,自然灾害对中国粮食产量产生越来越严重的影响。通过对粮食灾损的空间特征分析,为响应“国家粮食丰产增效科技创新”计划、保证国家粮食安全,建议未来应逐步做好宁夏、青海、内蒙、东北、湖南、湖北等省份的灾害防护,湖南、湖北主要预防洪涝灾害,西北地区主要预防干旱及突发性雹灾,东北地区主要除旱防内涝。
图15 1949-2015年中国不同阶段省市的年均灾损量与灾损率
Fig. 15 Spatial distribution of grain loss amount and rate in China by province from 1949 to 2015
为了检验粮食灾损的空间分异性,利用地理空间探测器对洪涝/旱灾/风雹/低温/台风受灾面积(HL/HZ/FB/DW/TF-SZ)、洪涝/旱灾/风雹/低温/台风成灾面积(HL/HZ/FB/DW/TF-CZ)、洪涝/旱灾/风雹/低温/台风绝收面积(HL/HZ/FB/DW/TF-JS)数据进行了单因子、交互因子探测,揭示各因子对灾损空间差异解释力(表1)。结果显示:旱灾受灾面积(HZ-SZ)、洪涝成灾面积(HL-CZ)、洪涝受灾面积(HL-SZ)的P值排在前三位,说明灾损空间分布差异受上述3种单因子影响较大,间接说明中国粮食产量主要受旱灾、洪灾影响;交互因子探测分析表明各因子对灾损空间分布差异并不是单独起作用,而是各因子交互作用的结果,且任意单因子与其他因素交互后的因子对灾损空间差异解释力都强于原来单因子的解释力。
表1 各影响因子探测结果
Tab. 1 The detection of of all the influencing factors
| 交互探测 | 单因子探测 | |||||||||||||||
|---|---|---|---|---|---|---|---|---|---|---|---|---|---|---|---|---|
| HL-SZ | HZ-SZ | FB-SZ | DW-SZ | TF-SZ | HL-CZ | HZ-CZ | FB-CZ | DW-CZ | TF-CZ | HL-JS | HZ-JS | FB-JS | DW-JS | TF-JS | P值 | |
| HL-SZ | 0.8503 | 0.8503 | ||||||||||||||
| HZ-SZ | 0.9700 | 0.8792 | 0.8792 | |||||||||||||
| FB-SZ | 0.9810 | 0.9380 | 0.7607 | 0.7607 | ||||||||||||
| DW-SZ | 0.9346 | 0.9790 | 0.9021 | 0.6780 | 0.6780 | |||||||||||
| TF-SZ | 0.9570 | 0.9819 | 0.9740 | 0.9246 | 0.3442 | 0.3442 | ||||||||||
| HL-CZ | 0.8951 | 0.9849 | 0.9744 | 0.9360 | 0.9521 | 0.8717 | 0.8717 | |||||||||
| HZ-CZ | 0.9702 | 0.8973 | 0.8979 | 0.9790 | 0.9580 | 0.9848 | 0.7968 | 0.7968 | ||||||||
| FB-CZ | 0.9872 | 0.9153 | 0.8541 | 0.8579 | 0.8986 | 0.9791 | 0.8931 | 0.7441 | 0.7441 | |||||||
| DW-CZ | 0.9328 | 0.9494 | 0.9451 | 0.8211 | 0.9290 | 0.9773 | 0.9465 | 0.9824 | 0.6033 | 0.6033 | ||||||
| TF-CZ | 0.9560 | 0.9788 | 0.9720 | 0.9174 | 0.4149 | 0.9439 | 0.9548 | 0.8926 | 0.9280 | 0.3833 | 0.3833 | |||||
| HL-JS | 0.9370 | 0.9675 | 0.9903 | 0.9214 | 0.9442 | 0.9503 | 0.9493 | 0.9637 | 0.8976 | 0.9133 | 0.7645 | 0.7645 | ||||
| HZ-JS | 0.9689 | 0.9261 | 0.8455 | 0.8416 | 0.8449 | 0.9896 | 0.8792 | 0.8050 | 0.9580 | 0.8494 | 0.9654 | 0.6948 | 0.6948 | |||
| FB-JS | 0.9693 | 0.9534 | 0.8555 | 0.8801 | 0.9412 | 0.9769 | 0.8805 | 0.8411 | 0.8676 | 0.9430 | 0.9315 | 0.8240 | 0.6201 | 0.6201 | ||
| DW-JS | 0.9682 | 0.9621 | 0.9293 | 0.8766 | 0.9152 | 0.9846 | 0.9693 | 0.9200 | 0.8051 | 0.8973 | 0.8859 | 0.8092 | 0.8118 | 0.5412 | 0.5412 | |
| TF-JS | 0.9398 | 0.9426 | 0.9402 | 0.8209 | 0.4598 | 0.9518 | 0.8874 | 0.8509 | 0.7582 | 0.5472 | 0.9019 | 0.8458 | 0.7644 | 0.9316 | 0.1803 | 0.1803 |
通过计算机Python语言编程进行数据获取,分析1949-2015年中国5种典型自然灾害造成的受灾、成灾、绝收面积的时空分异特征,估算并检验了粮食灾损的空间特征及分异性,认为不同灾种、灾损在时序变化、空间分布特征明显,主要包括:
(1)1949-2015年自然灾害时序趋势整体呈先升后降,2000年为临界点。1949-1970年中国自然灾害经历一个小的波动周期,1970-2000年中国自然灾害受灾面积、灾害强度指数均呈波动上升态势,2001-2015年中国自然灾害受灾面积呈明显下降趋势,2001-2015年中国自然灾害强度指数表现出先降后升的趋势,其中2011年为灾害强度指数的拐点,2011-2015年中国灾害强度指数呈显著线性单调递增,灾害程度逐渐恶化。
(2)1949-2015年不同灾种时序趋势特征差异显著。洪涝、旱灾、风雹、低温、台风受灾面积最大值年份分别是1991年、2000年、2002年、2008年、2005年,灾害强度指数最大值年份分别为2002年、2000年、2015年、2008年、2005年,旱灾、低温、台风灾害受灾面积最大与灾害强度最大相吻合。
(3)1949-2015年不同灾种空间异质性显著。5种灾害排序旱灾>洪灾>风雹>低温>台风,灾种在省域空间分布由北—南逐渐多样化,东南部省域呈现多灾并发格局;不同灾种受灾面积在由西—东、南—北的空间变化曲线各异、特征明显,这些特征与区域环境、经济产业关系密切。洪涝、台风空间分布上显著正相关,呈显著集聚分布模式,说明这些灾种发生更依赖孕灾环境,自然灾害总和、旱灾、风雹、低温在省域空间分布上相关性显著水平较低,呈随机分布格局;灾害冷热点分布具有一定地带性特征,冷点、次冷点多集中分布在胡焕庸线西北侧,热点、次热点聚集在胡焕庸线东南侧。
(4)粮食灾损时空分异性特征显著,其中旱涝灾害对粮食生产影响较大,且灾损重心逐渐北移。1949-1966年、1991-1998年、2010-2015年中国主要受洪灾影响,1970-1990年、1999-2009年中国主要受旱灾影响更频繁;1949-2015年中国粮食的灾损量、灾损率均呈先上升后下降的趋势,2000年达到峰值;旱灾灾损量占总灾损量大于50%的年份共出现36次,洪灾仅6次占总灾损大于50%;吉林、山西、安徽、青海等省份单年灾损率多次达到50%以上,黑龙江、山东、河北等省份粮食灾损量比较大;HZ-SZ、HL-CZ、HL-SZ等单因子对灾损空间分异性解释力度最大,多因子交互均呈非线性增强关系。
(5)建议政府加强西北地区除旱减雹,东北地区除旱排内涝、东南沿海排涝防冻预台等措施,制定专项保护方案,以保证中国粮食丰产增收。宁夏、青海、内蒙古、黑龙江、湖南、湖北等省份未来应逐步加强自然灾害防护。湖南、湖北主要预防洪涝灾害,西北地区主要预防干旱及突发性雹灾,东北地区主要除旱防内涝。农业部门应从自然灾害预警、防灾减灾、灾后救援、农业保险等多方面对灾害热点区、粮食主产区制定专项保护方案,以确保国家粮食安全。
本文通过计算机Python编程语言进行数据采集,构建灾害强度指数分析自然灾害的时序特征,利用ESDA、粮食灾损估算模型、地理空间探测器q统计等方法研究灾害、灾损的时空特征及灾损的空间分异性,取得以上结论,但由于不同阶段灾害监测技术有差异,如何降低统计数据间误差,还需进一步研究探讨,除此由于资料受限、技术方法不完善,后续研究仍待逐步提高。随着计算机数据挖掘与深度学习逐渐智能化,有关自然灾害时空分布研究的数据应由农业、人口、经济等传统的统计数据向网络、新闻、社交等多源数据过渡,方法应由传统地学方法结合(循环、卷积)神经网络构建空间识别模型,逐步完善自然灾害时空规律的研究与监测体系;同时研究自然灾害发生机制也具有重大意义,自然灾害的爆发是气候变化引起的,究其本源是地表温度变化,人类活动、植被变化、星体间空间位置的移动(如:地潮、海潮、气潮)都会导致地表温度的变化,而不应仅仅停留在自然灾害爆发与人口、GDP、降雨、城市化率等因素方面的相关性研究,努力从宇宙空间大尺度分析灾害爆发驱动机制将是未来研究努力拓展的方向,以期更好地为农业服务。
The authors have declared that no competing interests exist.
| [1] |
|
| [2] |
Spatial-temporal pattern changes of main agriculture natural disasters in China during 1990-2011. https://doi.org/10.1007/s11442-015-1175-x URL 摘要
China is a disaster prone country, and a comprehensive understanding of change of disasters is very important for China’s agricultural development. In this study, statistical techniques and geographic information system tools are employed to quantify the main agriculture disasters changes and effects on grain production in China during the period of 1990–2011. The results show that China’s grain production was severely affected by disasters including drought, flood, hail, frost and typhoon. The annual area covered by these disasters reached up to 48.7×10 6 ha during the study period, which accounted for 44.8% of the total sown area, and about 55.1% of the per unit area grain yield change was caused by disasters. In addition, all of the disasters showed high variability, different changing trends, and spatial distribution. Drought, flood, and hail showed significantly decreasing trends, while frost and typhoon showed increasing trends. Drought and flood showed gradual changes and were distributed across the country, and disasters became more diversified from north to south. Drought was the dominated disaster type in northern China, while flood was the most important disaster type in the southern part. Hail was mainly observed in central and northern China, and frost was mainly distributed in southern China. Typhoon was greatly limited to the southeast coast. Furthermore, the resilience of grain production of each province was quite different, especially in several major grain producing areas, such as Shandong, Liaoning, Jilin and Jiangsu, where grain production was seriously affected by disasters. One reason for the difference of resilience of grain production was that grain production was marginalized in developed provinces when the economy underwent rapid development. For China’s agricultural development and grain security, we suggest that governments should place more emphasis on grain production, and invest more money in disaster prevention and mitigation, especially in the major grain producing provinces.
|
| [3] |
Major natural disasters and their spatio-temporal variation in the history of China. https://doi.org/10.1007/s11442-012-0976-4 URL 摘要
Based on historical documents and records this paper analyzes the characteristics of frequency and distribution of major disasters that took place in the history of China. The findings show that occurrences of different types of disasters varied and spatial pattern at provincial level are significantly different as well. The results also indicate that there is a strong relationship between type of disasters and spatial distribution and that the spatial pattern of losses was not the same as that of the frequency. The reasons are: (1) the hazard-formative environments which, to a large extent, determine the spatial pattern of the disasters are significantly different; (2) the losses caused by natural disasters were closely related to the concentration of economy and population. Number of deaths was usually large in areas where agriculture, culture and business were relatively developed. The spatial pattern of disaster losses is an evitable result of uneven economic development in the history of China.
|
| [4] |
Risk assessment of flood disaster in Shanghai based on spatial-temporal characteristics analysis from 251 to 2000. https://doi.org/10.1007/s12665-014-3360-0 URL 摘要
As one of the top 20 cities exposed to flood disasters, Shanghai is particularly vulnerable because it is exposed to powerful floods and poorly prepared. However, it is unclear to understand the evolution process of floods and the variation of flood risk in Shanghai during the past 1,000 years. This paper analyzed the spatial–temporal characteristics of flood disaster and evaluated the integrated risk of flood disaster in Shanghai based on the historical flood data from 251 to 2000. The results show that flood disaster in Shanghai was divided into storm surge-induced flood, rainstorm-induced flood and overbank flood. Flood disaster in Shanghai presents rising trend with time and mainly occurs in summer and autumn. Moreover, the flood disaster is dominated by rainstorm-induced flood, especially after the establishment of the People’s Republic of China in 1949. Additionally, flood risk in different areas of Shanghai between the years 251–1949 and 1950–2000 changed significantly. Shanghai urban area, Jinshan District and Chongming County belong to increased flood risk area; Baoshan, Jiading, Qingpu, Songjiang, Fengxian, Pudong and Minhang District belong to decreased flood risk area. The integrated risk of flood disaster in Shanghai has presented spatial disparities evidently at present. Shanghai urban area is most likely to suffer flood disaster; Baoshan, Jiading and Minhang District have medium flood risk rank; and Jinshan, Songjiang, Fengxian, Pudong, Qingpu and Chongming County show low flood risk at present. The combined effect of urbanization, sea-level rise, land subsidence and the poor capacity of flood prevention facilities will give rise to the risk of flood in the next several decades. These results provide very important information for the local government to improve flood risk management.
|
| [5] |
Wang Jing'ai, et al. Wang Risk mapping of integrated natural disasters in China.
|
| [6] |
Agronomic impacts of climate variability on rice production in the Philippines. Agriculture, https://doi.org/10.1016/S0167-8809(00)00222-X URL 摘要
Climate variability is a threat to food production. Typhoons, floods, and droughts caused 82.4% of the total Philippine rice losses from 1970 to 1990. In 1990 alone, domestic losses due to climatic constraints amounted to US$ 39.2 million. Weather aberrations, climatic fluctuations such as El Ni帽o, and the growing concern for their effects on agriculture have stimulated academic, public and policy-level interests on the analysis of the impacts of climate variability on agricultural production systems. This paper is presented to discuss the agronomic impacts of climate variability on rice production in the Philippines. Long-term climate variability influences sowing date, crop duration, crop yield, and the management practices adapted in rice production. Short-term weather episodes can also affect yield by inducing changes in temperature, potential evapotranspiration, and moisture availability. The degree of vulnerability of crops to climate variability depends mainly on the development stage of the crops at the time of weather aberration. The vulnerability and risk of crop production due to weather fluctuations and climate variability can be minimized if future weather variation can be adequately predicted and a suitable process-based ecophysiological crop yield forecasting model can be identified to produce real-time yield forecasts. Scientists and farmers must join efforts to further understand crop鈥揷limate relationships and formulate viable, locally adapted production technologies that will address critical issues such as climate variability.
|
| [7] |
Theory on disaster science and disaster dynamics. 再论灾害研究的理论与实践 . |
| [8] |
Theory on disaster science and disaster dynamics.
三论灾害研究的理论与实践 .
|
| [9] |
Assessment and analysis of natural hazards danger degree in the Sichuan-Yunnan-Guizhou bordering area of Southwest China. 川滇黔接壤地区自然灾害危险度评价 . |
| [10] |
Assessment and validation of short-term flood hazards in China. https://doi.org/10.11821/yj2012010004 URL 摘要
基于自然灾害风险理论、借助GIS空间分析功能、采用归一化和层次分析法,对中国全国范围尺度进行短时洪涝灾害危险性评估。通过对洪涝灾害危险性因子分析,分别提取当天降雨量、前三天降雨量、地形高程、地形标准差、河湖网络等因素作为评估因子,提出了各因子危险性指数计算方法,以及全国洪涝灾害危险性指数计算模型公式,根据统计分析危险指数的最小值、最大值,结合历史灾情,利用阈值分割法确定危险等级分割值为0.3、0.45及0.6,将洪涝灾害危险等级划分为高危险、中危险、低危险与无危险四个等级,从而建立类似于天气预报模式的全国洪涝灾害危险性评估模型,并以2009年9月14日为例进行了洪涝灾害危险等级评估的实际应用。最后,本文提出了基于昨日灾情的危险性评估结果验证方法,通过整理同期昨日灾情资料构建灾情数据库,对2009年汛期的洪涝灾害危险性评估结果分别从数量和面积两个角度,基于县和地市两级行政区划作为验证单元进行验证。验证结果表明,洪涝灾害危险性评估结果无论是从数量上还是从面积上看均具有较高的正确率,与实际灾情基本吻合。
中国短时洪涝灾害危险性评估与验证 .https://doi.org/10.11821/yj2012010004 URL 摘要
基于自然灾害风险理论、借助GIS空间分析功能、采用归一化和层次分析法,对中国全国范围尺度进行短时洪涝灾害危险性评估。通过对洪涝灾害危险性因子分析,分别提取当天降雨量、前三天降雨量、地形高程、地形标准差、河湖网络等因素作为评估因子,提出了各因子危险性指数计算方法,以及全国洪涝灾害危险性指数计算模型公式,根据统计分析危险指数的最小值、最大值,结合历史灾情,利用阈值分割法确定危险等级分割值为0.3、0.45及0.6,将洪涝灾害危险等级划分为高危险、中危险、低危险与无危险四个等级,从而建立类似于天气预报模式的全国洪涝灾害危险性评估模型,并以2009年9月14日为例进行了洪涝灾害危险等级评估的实际应用。最后,本文提出了基于昨日灾情的危险性评估结果验证方法,通过整理同期昨日灾情资料构建灾情数据库,对2009年汛期的洪涝灾害危险性评估结果分别从数量和面积两个角度,基于县和地市两级行政区划作为验证单元进行验证。验证结果表明,洪涝灾害危险性评估结果无论是从数量上还是从面积上看均具有较高的正确率,与实际灾情基本吻合。
|
| [11] |
Assessment of social vulnerability to natural disasters in the midwest of China. 中西部地区自然灾害社会易损性空间特征分析 . |
| [12] |
Distribution features of hail disasters and its formation analysis of the Three-River Headwaters Region. 三江源地区冰雹灾害分布特征及其成因 . |
| [13] |
Spatial distribution of major natural disasters of China in historical period. https://doi.org/10.11821/xb201203001 URL 摘要
通过历史文献和史料记载的整理,对中国历史时期的重大自然灾害进行了系统的梳理,分析了公元前180年-1911年和民国时期重大自然灾害发生的频次和损失的时空格局特征,得出结论:(1)对灾害发生的频次进行分析,不同灾种发生频次不同,空间格局呈现明显的地域分异,灾害的空间分布与灾种之间的关系明显;(2)对灾害带来的损失进行分析,发现不同类型灾害发生的频次与灾害带来损失的空间格局并不相同。究其原因在于:(1)各种自然灾害的孕灾环境不同,是其空间格局差异性的决定性因素;(2)自然灾害带来的损失大小与经济和人口的集中程度密切相关。自然灾害损失较大的往往都是农业、文化、商贸较为发达的区域,这也是我国区域经济格局空间差异的必然。
历史时期中国重大自然灾害时空分异特征 .https://doi.org/10.11821/xb201203001 URL 摘要
通过历史文献和史料记载的整理,对中国历史时期的重大自然灾害进行了系统的梳理,分析了公元前180年-1911年和民国时期重大自然灾害发生的频次和损失的时空格局特征,得出结论:(1)对灾害发生的频次进行分析,不同灾种发生频次不同,空间格局呈现明显的地域分异,灾害的空间分布与灾种之间的关系明显;(2)对灾害带来的损失进行分析,发现不同类型灾害发生的频次与灾害带来损失的空间格局并不相同。究其原因在于:(1)各种自然灾害的孕灾环境不同,是其空间格局差异性的决定性因素;(2)自然灾害带来的损失大小与经济和人口的集中程度密切相关。自然灾害损失较大的往往都是农业、文化、商贸较为发达的区域,这也是我国区域经济格局空间差异的必然。
|
| [14] |
Spatial-temporal variations in natural disasters of the coastal regions in Zhejiang province during Ming and Qing dynasties. https://doi.org/10.11821/dlyj201409018 URL 摘要
明清小冰期是我国气候的异常期,各种自然灾害频发。通过系统搜集、整理明清时期浙江沿海地区自然灾害历史资料并对其进行统计分析发现,浙江省沿海地区各种自然灾害发生频次和造成的损失具有明显的时空地域分异特征,得到如下特征:①明清时期,随着时间推移,各种灾害发生频次成波动上升的趋势,在明末清初达到一个高峰值;在浙江沿海地区的各种灾害中,水、旱两灾的发生最为频繁,水灾发生频次高于旱灾。②水灾、旱灾、台风和潮灾是该地区的主要灾害类型,台风与水灾、潮灾之间是高度相关的,且台风灾害是浙江沿海地区的主要致灾因子,台风灾害诱发的灾害链具有波及面广、危害严重的特点。旱灾和水灾具有显著的相关性,在该地区水、旱两灾在时间尺度上的变化相对一致,这种现象可能是副高季节内振荡所导致的。③浙江省自然灾害发生频次和损失程度与地貌形态之间具有一定的联系。以平原、丘陵及低山等地貌类型为主的孕灾环境对浙江沿海地区水灾、旱灾、台风灾害和风暴潮灾等4种主要自然灾害类型及其损失的空间分布有着显著的影响。浙北地区水旱灾害变化剧烈,浙中、浙南地区相对较弱。杭州湾地区台风灾害的分布具有湾口多于湾顶,南岸多于北岸的特点。④从灾害损失的空间格局来看,特大损失程度灾害的主要类型为潮灾,且集中分布在浙北平原,浙南山地和浙东南平原丘陵分布较少。
明清时期浙江沿海自然灾害的时空分异特征 .https://doi.org/10.11821/dlyj201409018 URL 摘要
明清小冰期是我国气候的异常期,各种自然灾害频发。通过系统搜集、整理明清时期浙江沿海地区自然灾害历史资料并对其进行统计分析发现,浙江省沿海地区各种自然灾害发生频次和造成的损失具有明显的时空地域分异特征,得到如下特征:①明清时期,随着时间推移,各种灾害发生频次成波动上升的趋势,在明末清初达到一个高峰值;在浙江沿海地区的各种灾害中,水、旱两灾的发生最为频繁,水灾发生频次高于旱灾。②水灾、旱灾、台风和潮灾是该地区的主要灾害类型,台风与水灾、潮灾之间是高度相关的,且台风灾害是浙江沿海地区的主要致灾因子,台风灾害诱发的灾害链具有波及面广、危害严重的特点。旱灾和水灾具有显著的相关性,在该地区水、旱两灾在时间尺度上的变化相对一致,这种现象可能是副高季节内振荡所导致的。③浙江省自然灾害发生频次和损失程度与地貌形态之间具有一定的联系。以平原、丘陵及低山等地貌类型为主的孕灾环境对浙江沿海地区水灾、旱灾、台风灾害和风暴潮灾等4种主要自然灾害类型及其损失的空间分布有着显著的影响。浙北地区水旱灾害变化剧烈,浙中、浙南地区相对较弱。杭州湾地区台风灾害的分布具有湾口多于湾顶,南岸多于北岸的特点。④从灾害损失的空间格局来看,特大损失程度灾害的主要类型为潮灾,且集中分布在浙北平原,浙南山地和浙东南平原丘陵分布较少。
|
| [15] |
A research on regional distribution of major natural hazards in China. 中国主要自然灾害致灾因子的区域分异 . |
| [16] |
Regional hazard assessment of disaster environment for debris flows: Taking Jundu Mountain, Beijing as an example. https://doi.org/10.11821/yj2013040002 URL 摘要
以北京军都山区实测泥石流沟谷数为基准,基于因子叠加、信息量模型和FCM-粗糙集三种方法,分别获得了泥石流灾害发生的危险性等级分布,结果表明:①各分区单位面积内泥石流沟谷数都随着危险性评价等级的提高而增多;②因子叠加法和信息量模型法可得出五级泥石流灾害危险性分级,而粗糙集法只得出三级分级;③以实际泥石流沟谷落在评价区数目为标准,信息量模型法有90%以上的泥石流沟谷在危险性高和极高区域;粗糙集法得到危险区域覆盖了63.72%的泥石流沟谷分布;④从单位面积泥石流沟谷数与泥石流沟谷分布比率可得,信息量模型法评价精度较高,因子叠加法没有形成良好的梯度,而粗糙集法计算等级结果与其他方法存在差异,故须在其他区域进行进一步研究。
区域泥石流孕灾环境危险性评价: 以北京军都山区为例 .https://doi.org/10.11821/yj2013040002 URL 摘要
以北京军都山区实测泥石流沟谷数为基准,基于因子叠加、信息量模型和FCM-粗糙集三种方法,分别获得了泥石流灾害发生的危险性等级分布,结果表明:①各分区单位面积内泥石流沟谷数都随着危险性评价等级的提高而增多;②因子叠加法和信息量模型法可得出五级泥石流灾害危险性分级,而粗糙集法只得出三级分级;③以实际泥石流沟谷落在评价区数目为标准,信息量模型法有90%以上的泥石流沟谷在危险性高和极高区域;粗糙集法得到危险区域覆盖了63.72%的泥石流沟谷分布;④从单位面积泥石流沟谷数与泥石流沟谷分布比率可得,信息量模型法评价精度较高,因子叠加法没有形成良好的梯度,而粗糙集法计算等级结果与其他方法存在差异,故须在其他区域进行进一步研究。
|
| [17] |
Areal association of natural hazard in China. https://doi.org/10.11821/xb199601001 URL 摘要
By analyzing disaster forming mechanism.natural hazards in China can be divided into 20 basic types according to direct factors causing disasters, in which drought, waterlogging, flood, earthquake, landslide and debris are the most serious in China.The macrolandform,especially the three grand relief terraces in China, and the macrolandform-dominated regionalization of natural environment affect the distribution of flood, waterlogging, landslide, debris and earthquake.The difference in natural hazard distribution can reflect the regularities of areal association of natural hazards. The regionalization of disasters should abide by not only geographic principles, but also the principles of similarity and difference in the main types of natural hazards. By analyzing the areal differentiation of Chinese main natural hazards and the intensity of factors inducing disasters based on the Chinese data bases of intensities of the main factors inducing disasters and the data bases of social environment, and using ARC/INFO GIS. the authors compiled distribution maps of Chinese main natural hazards and maps of intensity of factors inducing disasters. Results show that Chinese natural hazards can be divided into 3 regions and 12 subregions.I. Severe hazard region in monsoon plain and mountain in east China This region is located west of seas and controlled by monsoon. The intensity and frequency of drought, waterlogging and flood in the area are the highest in China under the influences of abnormality of monsoon, typhoon and cold wave, and exclusive hazards of oceanic genesis appear here.Microtherm, earthquake, landslide and debris are serious. The area includes seven subregions: I Moderate hazard subregion of waterlogging. flood, microtherm and biological hazards in northeast China; I Severe hazard subregion of drought. waterlogging. flood and earthquake in the plain in east China. I Severe hazard subregion of waterlogging. flood and draught in the middle Changjing River, I Severe hazard subregion of waterlogging, flood, drought and earthquake in the southeast coastal area; I Severe and moderate hazard subregion of drought, soil erosion and earthquake in the Loess Plateau; I Severe hazard subregion of drought, waterlogging, flood, landslide and debris in Sichuan, Guizhou, Hunan and west Hubei; I Severe hazard subregion of earthquake. landslide and debris in Yunnan and west Sichuan.Ⅱ. Moderate hazard region in mountain and basin in dry northwest China This area lies in the inland with dry climate, strong wind and frequent sandstorm. and there is no rainfed agriculture. The main natural hazards are earthquake. flood, drought and windstorm.The area includes three subregions: Ⅱ Moderate and slight hazard subregion of drought, heavy snow and forest fire in Inner Mongolia: Ⅱ Moderate hazard subregion of earthquake, sandstorm,flood and drought in Xingjiang and Gansu; Ⅱ Moderate hazard subregion of earthquake. landslide and debris in the Tianshan Mt. in Xinjian Ⅲ. Slight hazard region in the cold Qinghai-Tibet Plateau Tectonic movement in the region is strong. Earthquake, collapse. debris and heavy snow are intense, but the losses population. This region includes two subregions: Ⅲ Moderate hazard subregion of earthquake, landslide and debris in the southeast Qinghai-Tibet Plateau; Ⅲ Slight hazard subregion of earthquake and heavy snow in the northwest Qinghai-Tibet Plateau.
中国自然灾害的区域组合规律 .https://doi.org/10.11821/xb199601001 URL 摘要
By analyzing disaster forming mechanism.natural hazards in China can be divided into 20 basic types according to direct factors causing disasters, in which drought, waterlogging, flood, earthquake, landslide and debris are the most serious in China.The macrolandform,especially the three grand relief terraces in China, and the macrolandform-dominated regionalization of natural environment affect the distribution of flood, waterlogging, landslide, debris and earthquake.The difference in natural hazard distribution can reflect the regularities of areal association of natural hazards. The regionalization of disasters should abide by not only geographic principles, but also the principles of similarity and difference in the main types of natural hazards. By analyzing the areal differentiation of Chinese main natural hazards and the intensity of factors inducing disasters based on the Chinese data bases of intensities of the main factors inducing disasters and the data bases of social environment, and using ARC/INFO GIS. the authors compiled distribution maps of Chinese main natural hazards and maps of intensity of factors inducing disasters. Results show that Chinese natural hazards can be divided into 3 regions and 12 subregions.I. Severe hazard region in monsoon plain and mountain in east China This region is located west of seas and controlled by monsoon. The intensity and frequency of drought, waterlogging and flood in the area are the highest in China under the influences of abnormality of monsoon, typhoon and cold wave, and exclusive hazards of oceanic genesis appear here.Microtherm, earthquake, landslide and debris are serious. The area includes seven subregions: I Moderate hazard subregion of waterlogging. flood, microtherm and biological hazards in northeast China; I Severe hazard subregion of drought. waterlogging. flood and earthquake in the plain in east China. I Severe hazard subregion of waterlogging. flood and draught in the middle Changjing River, I Severe hazard subregion of waterlogging, flood, drought and earthquake in the southeast coastal area; I Severe and moderate hazard subregion of drought, soil erosion and earthquake in the Loess Plateau; I Severe hazard subregion of drought, waterlogging, flood, landslide and debris in Sichuan, Guizhou, Hunan and west Hubei; I Severe hazard subregion of earthquake. landslide and debris in Yunnan and west Sichuan.Ⅱ. Moderate hazard region in mountain and basin in dry northwest China This area lies in the inland with dry climate, strong wind and frequent sandstorm. and there is no rainfed agriculture. The main natural hazards are earthquake. flood, drought and windstorm.The area includes three subregions: Ⅱ Moderate and slight hazard subregion of drought, heavy snow and forest fire in Inner Mongolia: Ⅱ Moderate hazard subregion of earthquake, sandstorm,flood and drought in Xingjiang and Gansu; Ⅱ Moderate hazard subregion of earthquake. landslide and debris in the Tianshan Mt. in Xinjian Ⅲ. Slight hazard region in the cold Qinghai-Tibet Plateau Tectonic movement in the region is strong. Earthquake, collapse. debris and heavy snow are intense, but the losses population. This region includes two subregions: Ⅲ Moderate hazard subregion of earthquake, landslide and debris in the southeast Qinghai-Tibet Plateau; Ⅲ Slight hazard subregion of earthquake and heavy snow in the northwest Qinghai-Tibet Plateau.
|
| [18] |
Wu Jidong et al. Complete assessment of disaster reduction and relief standards in China. URL 摘要
Exploring the inadequate and completeness of disaster mitigation and relief standards in China is of great significance to the improvement of existing disaster mitigation and relief standard systems. The difference in disaster reduction and relief standards between China and the USA, in quantity, was analyzed. Standard fault tree analysis for natural disaster mitigation and relief standards was used to evaluate the completeness of China鈥檚 standards. The standard fault tree comprised comprehensive disasters, disaster monitoring and early warnings, disaster response preparedness, disaster emergency responses, disaster recovery and reconstruction, and disaster reduction. The results reveal a significant difference between China and the USA for existing disaster mitigation and relief standards. China has 779 related disaster standards and the USA has 263. In addition to the fire and marine disaster standards, China has done more research into floods and droughts, and meteorological, biological, earthquake and geological disasters than the USA. The number of national, industry, local and enterprise standards across China was 180, 358, 233 and 8 respectively. There had 664 currently valid standards in China: the number of mandatory, recommended standards and guidance documents is 150, 493, and 1, respectively. The completeness of standards was related to the number of existing standards and the total completeness of China鈥檚 disaster mitigation and relief relevant standards was 77.9%. The completeness of flood and drought standards was 67.9%, meteorological was 75.0%, biological was 88.2%, geological was 60.3%, earthquake was 89.1%, fire was 76.5% and marine disaster standards was 51.0%. These results suggest that the disaster mitigation and relief standards for earthquake and biological disasters are relatively complete, and relatively incomplete for marine disasters. As a major maritime country, China should strengthen its research and the development of marine disaster mitigation and relief standards. Improving and perfecting related fire standards should also be done. The current lack of natural disaster standards across China should be improved and will involve aspect of the management of the emergency plan, community disaster reduction, disaster information, disaster prevention and mitigation capability assessment, prevention and disposal of secondary disasters, ecosystem production order and the social restoration, monitoring and the prevention of animal disease, emergency broadcast and natural disaster risk zoning technology, disaster monitoring networks, and disaster insurance.
中国自然灾害减灾救灾标准完备性评价 .URL 摘要
Exploring the inadequate and completeness of disaster mitigation and relief standards in China is of great significance to the improvement of existing disaster mitigation and relief standard systems. The difference in disaster reduction and relief standards between China and the USA, in quantity, was analyzed. Standard fault tree analysis for natural disaster mitigation and relief standards was used to evaluate the completeness of China鈥檚 standards. The standard fault tree comprised comprehensive disasters, disaster monitoring and early warnings, disaster response preparedness, disaster emergency responses, disaster recovery and reconstruction, and disaster reduction. The results reveal a significant difference between China and the USA for existing disaster mitigation and relief standards. China has 779 related disaster standards and the USA has 263. In addition to the fire and marine disaster standards, China has done more research into floods and droughts, and meteorological, biological, earthquake and geological disasters than the USA. The number of national, industry, local and enterprise standards across China was 180, 358, 233 and 8 respectively. There had 664 currently valid standards in China: the number of mandatory, recommended standards and guidance documents is 150, 493, and 1, respectively. The completeness of standards was related to the number of existing standards and the total completeness of China鈥檚 disaster mitigation and relief relevant standards was 77.9%. The completeness of flood and drought standards was 67.9%, meteorological was 75.0%, biological was 88.2%, geological was 60.3%, earthquake was 89.1%, fire was 76.5% and marine disaster standards was 51.0%. These results suggest that the disaster mitigation and relief standards for earthquake and biological disasters are relatively complete, and relatively incomplete for marine disasters. As a major maritime country, China should strengthen its research and the development of marine disaster mitigation and relief standards. Improving and perfecting related fire standards should also be done. The current lack of natural disaster standards across China should be improved and will involve aspect of the management of the emergency plan, community disaster reduction, disaster information, disaster prevention and mitigation capability assessment, prevention and disposal of secondary disasters, ecosystem production order and the social restoration, monitoring and the prevention of animal disease, emergency broadcast and natural disaster risk zoning technology, disaster monitoring networks, and disaster insurance.
|
| [19] |
Spatio-tempo-ral properties of flood/drought hazards and possible causes and impacts in 1961-2010. URL 摘要
搜集并分析了全国29个省份(不包括港、澳、台地区)1961~2010年农业洪旱灾害数据,深入探讨了中国洪旱灾害时空变异规律及其对粮食产量的影响。研究结果表明:中国大部分省份农业洪涝、干旱灾害具有明显的突变和趋势特征。中国中部、中西部及西北部洪涝灾害呈显著上升趋势;西北、东北地区及云南等地区干旱灾害呈显著上升趋势。除华北和东北地区外,洪涝灾害对农业的威胁日益严峻,而干旱灾害则无显著变化。这对中国粮食安全形成了重大挑战,尤其是西部以及北部地区粮食灾损率和灾损量显著上升。降水时空分布发生变化以及人类活动共同影响了中国农业洪涝、干旱时空变化特征。
1961-2010年中国农业洪旱灾害时空特征、成因及影响 .URL 摘要
搜集并分析了全国29个省份(不包括港、澳、台地区)1961~2010年农业洪旱灾害数据,深入探讨了中国洪旱灾害时空变异规律及其对粮食产量的影响。研究结果表明:中国大部分省份农业洪涝、干旱灾害具有明显的突变和趋势特征。中国中部、中西部及西北部洪涝灾害呈显著上升趋势;西北、东北地区及云南等地区干旱灾害呈显著上升趋势。除华北和东北地区外,洪涝灾害对农业的威胁日益严峻,而干旱灾害则无显著变化。这对中国粮食安全形成了重大挑战,尤其是西部以及北部地区粮食灾损率和灾损量显著上升。降水时空分布发生变化以及人类活动共同影响了中国农业洪涝、干旱时空变化特征。
|
| [20] |
Spatio-temporal distribution of flood disasters and analysis of influencing factors in Africa. https://doi.org/10.1007/s11069-016-2181-8 URL 摘要
To analyse inner- and inter-annual changes, disaster events of 55 countries in Africa from 1990 to 2014 recorded in the International Disaster Database (EM-DAT) were recounted by year and month and were reorganised in five different regions. Thematic maps of flood disasters in Africa between 1990 and 2014 were drawn using ArcGIS 9.3 to research the spatial distribution patterns of average annual flood frequency, total deaths, total affected, and damage. There were eight natural and socio-economic indicators chosen to explore the main factors influencing the spatio-temporal distribution of flood disasters in Africa, including precipitation, ENSO, runoff, forest coverage rate, reservoir capacity, per capita GDP, population, and urbanisation rate. Studies show that seasonal changes of flood disasters in various regions of Africa, except North Africa, are closely related to precipitation. Annual flood frequencies, from 1990 to 2014, showed a fluctuating upward trend and were in good agreement with ENSO years. In terms of spatial distributions, Ethiopia, Kenya, Somalia, Tanzania in eastern Africa, Nigeria in western Africa, and Libya, and Sudan in northern Arica are flood-prone countries, and main factors influencing spatial disparities include runoff, per capita GDP, population, and urbanisation rate.
|
| [21] |
Influence of drought and flood disasters on grain production in Shaanxi Province. URL 摘要
The study is to promulgate the character and influence of drought and flood disasters on grain production in Shaanxi Province.Based on the statistical data of drought and flood disasters and grain production from 1971 to 2010 in Shaanxi Province,the impact of drought and flood on grain production was researched.The results show that the strength of affected area and damaged area caused by drought and flood disasters is of fluctuation,the occurrence frequency of drought and flood is most heavily from 1991 to 2000.Disaster-induced intensity of drought and flood on grain production became more and more obvious fluctuately,but during 2001-2010,the reduction of grain production caused by drought and flood disasters was less than that during 1991-2000.The impact of drought and flood on food production is of fluctuation,in 21st century,drought and flood disasters on food production have less impact compared with 90鈥檚 in 20 century.
旱涝灾害对陕西省粮食生产的影响研究 .URL 摘要
The study is to promulgate the character and influence of drought and flood disasters on grain production in Shaanxi Province.Based on the statistical data of drought and flood disasters and grain production from 1971 to 2010 in Shaanxi Province,the impact of drought and flood on grain production was researched.The results show that the strength of affected area and damaged area caused by drought and flood disasters is of fluctuation,the occurrence frequency of drought and flood is most heavily from 1991 to 2000.Disaster-induced intensity of drought and flood on grain production became more and more obvious fluctuately,but during 2001-2010,the reduction of grain production caused by drought and flood disasters was less than that during 1991-2000.The impact of drought and flood on food production is of fluctuation,in 21st century,drought and flood disasters on food production have less impact compared with 90鈥檚 in 20 century.
|
| [22] |
Quantitative analysis of agro-drought impact on food security in China. 农业旱灾对国家粮食安全影响程度的定量分析 . |
| [23] |
Spatiotemporal data analysis in geography. https://doi.org/10.11821/dlxb201409007 URL 摘要
随着地理空间观测数据的多年积累,地球环境、社会和健康数据监测能力的增强,地理信息系统和计算机网络的发展,时空数据集大量生成,时空数据分析实践呈现快速增长.本文对此进行了分析和归纳,总结了时空数据分析的7类主要方法,包括:时空数据可视化,目的是通过视觉启发假设和选择分析模型;空间统计指标的时序分析,反映空间格局随时间变化;时空变化指标,体现时空变化的综合统计量;时空格局和异常探测,揭示时空过程的不变和变化部分;时空插值,以获得未抽样点的数值;时空回归,建立因变量和解释变量之间的统计关系;时空过程建模,建立时空过程的机理数学模型;时空演化树,利用空间数据重建时空演化路径.通过简述这些方法的基本原理、输入输出、适用条件以及软件实现,为时空数据分析提供工具和方法手段.
地理学时空数据分析方法 .https://doi.org/10.11821/dlxb201409007 URL 摘要
随着地理空间观测数据的多年积累,地球环境、社会和健康数据监测能力的增强,地理信息系统和计算机网络的发展,时空数据集大量生成,时空数据分析实践呈现快速增长.本文对此进行了分析和归纳,总结了时空数据分析的7类主要方法,包括:时空数据可视化,目的是通过视觉启发假设和选择分析模型;空间统计指标的时序分析,反映空间格局随时间变化;时空变化指标,体现时空变化的综合统计量;时空格局和异常探测,揭示时空过程的不变和变化部分;时空插值,以获得未抽样点的数值;时空回归,建立因变量和解释变量之间的统计关系;时空过程建模,建立时空过程的机理数学模型;时空演化树,利用空间数据重建时空演化路径.通过简述这些方法的基本原理、输入输出、适用条件以及软件实现,为时空数据分析提供工具和方法手段.
|
| [24] |
Geodetector: Principle and prospective. https://doi.org/10.11821/dlxb201701010 URL 摘要
空间分异是自然和社会经济过程的空间表现,也是自亚里士多德以来人类认识自然的重要途径。地理探测器是探测空间分异性,以及揭示其背后驱动因子的一种新的统计学方法,此方法无线性假设,具有优雅的形式和明确的物理含义。基本思想是:假设研究区分为若干子区域,如果子区域的方差之和小于区域总方差,则存在空间分异性;如果两变量的空间分布趋于一致,则两者存在统计关联性。地理探测器q统计量,可用以度量空间分异性、探测解释因子、分析变量之间交互关系,已经在自然和社会科学多领域应用。本文阐述地理探测器的原理,并对其特点及应用进行了归纳总结,以利于读者方便灵活地使用地理探测器来认识、挖掘和利用空间分异性。
地理探测器: 原理与展望 .https://doi.org/10.11821/dlxb201701010 URL 摘要
空间分异是自然和社会经济过程的空间表现,也是自亚里士多德以来人类认识自然的重要途径。地理探测器是探测空间分异性,以及揭示其背后驱动因子的一种新的统计学方法,此方法无线性假设,具有优雅的形式和明确的物理含义。基本思想是:假设研究区分为若干子区域,如果子区域的方差之和小于区域总方差,则存在空间分异性;如果两变量的空间分布趋于一致,则两者存在统计关联性。地理探测器q统计量,可用以度量空间分异性、探测解释因子、分析变量之间交互关系,已经在自然和社会科学多领域应用。本文阐述地理探测器的原理,并对其特点及应用进行了归纳总结,以利于读者方便灵活地使用地理探测器来认识、挖掘和利用空间分异性。
|
| [25] |
Effect of MAUP in spatial autocorrelation. 空间自相关的可塑性面积单元问题效应 . |
| [26] |
Spatial distribution characteristics of OSDS registered users and its influencing factor. Journal of https://doi.org/10.3724/SP.J.1047.2016.01332 URL 摘要
本文以2005年以来中国科学院遥感与数字地球研究所开放式空间数据共享网站(OSDS)平台的注册用户为研究对象,利用最近邻层次空间聚类方法和地理探测器模型,对各省注册用户量的空间分布特征和差异影响因素进行了分析。分析结果表明,整体上用户空间分布很不均衡,主要集中在东部发达地区和几个在测绘和地理信息科学领域卓有建树的地区,信息、科研和教育是主要影响因素,经济、网络和测绘的单因素影响力较低,而与主要影响因素结合的交互影响得到了提升。因此,多因素共同制约着用户群的空间分布格局和区域不均衡性。应用地理探测器能从宏观上把握遥感学者群体的空间分布特征及其影响因素,其分析结果能够指导数据提供者更有针对性地为用户提供服务,也可为遥感产业调整和空间布局优化提供依据。
OSDS注册用户空间分布特征及影响因素分析 .https://doi.org/10.3724/SP.J.1047.2016.01332 URL 摘要
本文以2005年以来中国科学院遥感与数字地球研究所开放式空间数据共享网站(OSDS)平台的注册用户为研究对象,利用最近邻层次空间聚类方法和地理探测器模型,对各省注册用户量的空间分布特征和差异影响因素进行了分析。分析结果表明,整体上用户空间分布很不均衡,主要集中在东部发达地区和几个在测绘和地理信息科学领域卓有建树的地区,信息、科研和教育是主要影响因素,经济、网络和测绘的单因素影响力较低,而与主要影响因素结合的交互影响得到了提升。因此,多因素共同制约着用户群的空间分布格局和区域不均衡性。应用地理探测器能从宏观上把握遥感学者群体的空间分布特征及其影响因素,其分析结果能够指导数据提供者更有针对性地为用户提供服务,也可为遥感产业调整和空间布局优化提供依据。
|

/
| 〈 |
|
〉 |


